Races in Waltham, Vermont (VT) Detailed Stats
Ancestries, Foreign-born residents, place of birth
6.5% of Waltham, VT residents are foreign-born (3.1% born in Asia, 2.3% born in Europe, 1.0% born in North America), which is 38.2% greater than the foreign-born rate of 4.0% across the entire state of Vermont.
Race distribution in Waltham

- 47398.7%White alone
- 30.6%Asian alone
- 20.4%Black alone
- 10.2%Hispanic

2000
2022
-
- 585,43196.2%White alone
- 6,8091.1%Two or more races
- 5,5040.9%Hispanic
- 5,1600.8%Asian alone
- 2,9210.5%Black alone
- 2,3250.4%American Indian alone
- 5570.09%Other race alone
- 1200.02%Native Hawaiian and Other
Pacific Islander alone

-
- 583,54690.2%White alone
- 27,3404.2%Two or more races
- 14,7702.3%Hispanic
- 11,5121.8%Asian alone
- 6,2641.0%Black alone
- 2,5210.4%Other race alone
- 1,0520.2%American Indian alone
- 590.01%Native Hawaiian and Other
Pacific Islander alone

Income and house value in Waltham
- Median household income in 2022
- $83,076White non-Hispanic householders
- Median 2022 house value
- $387,644White Non-Hispanic householders
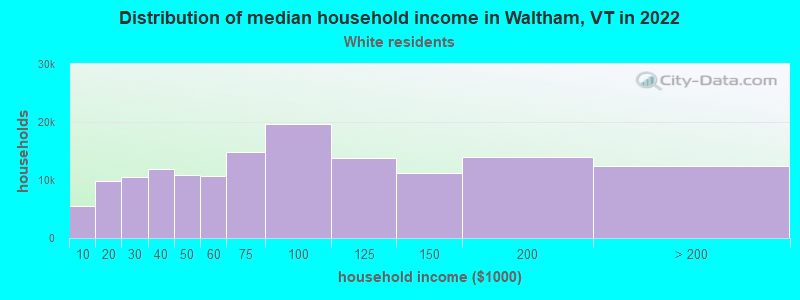
Household income for White non-Hispanic householders
Foreign-born residents in Waltham
31 residents are foreign born (3.1% Asia, 2.3% Europe, 1.0% North America).
| This city: | 6.5% |
| Vermont: | 3.8% |
Ancestries in Waltham

- 10017.9%English
- 6311.3%United States
- 5910.6%French
- 5710.2%Irish
- 529.3%Other
- 437.7%French Canadian
- 386.8%Italian
- 346.1%German
- 325.7%Scottish
- 305.4%Dutch
- 132.3%Polish
- 122.2%Lithuanian
- 81.4%Russian
- 81.4%Scotch-Irish
- 30.5%Swedish
- 30.5%Welsh
- 20.4%Arab
- 10.2%Greek

Zip codes: 05491.