Races in Walnut Grove, Washington (WA) Detailed Stats
According to 2022 data, the most numerous races in Walnut Grove, WA are White alone (7,880 residents), Hispanic (1,083 residents), and Asian alone (977 residents). 78.6% of Walnut Grove residents speak English at home. 14.4% of Walnut Grove, WA residents are foreign-born (7.0% born in Europe, 4.4% born in Asia, 2.2% born in Latin America), which is 3.9% less than the foreign-born rate of 15.0% across the entire state of Washington.
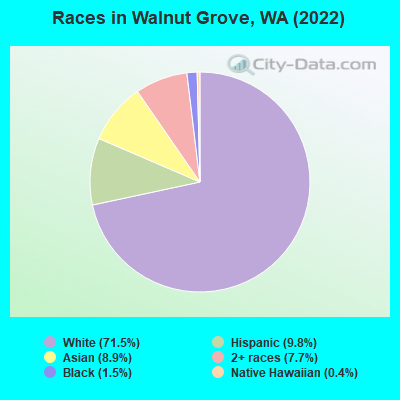
Race distribution in Walnut Grove
2000 2022
4,652,490 78.9% White alone 441,509 7.5% Hispanic 319,401 5.4% Asian alone 184,631 3.1% Black alone 175,926 3.0% Two or more races 85,396 1.4% American Indian alone 22,779 0.4% Native Hawaiian and Other 11,989 0.2% Other race alone
4,941,456 63.5% White alone 1,093,313 14.0% Hispanic 755,832 9.7% Asian alone 523,448 6.7% Two or more races 299,537 3.8% Black alone 69,024 0.9% American Indian alone 52,231 0.7% Native Hawaiian and Other 50,945 0.7% Other race alone
Income and house value in Walnut Grove Median household income in 2022 $96,221 White non-Hispanic householders$118,842 Black householders$37,726 American Indian and Alaska Native householders$82,824 Asian householders$53,363 Some other race householders$82,298 Two or more races householders$58,236 Hispanic or Latino race householdersMedian 2022 house value $517,099 White Non-Hispanic householders$521,619 Black or African American householders$603,688 American Indian or Alaska Native householders $617,250 Asian householders$434,683 Some other race householders$465,632 Two or more races householders$554,308 Hispanic or Latino householders
Median age by race in Walnut Grove
43.2 Median age for White residents42.9 44.3 52.0 Median age for Black or African American residents52.3 45.2 89.3 Median age for American Indian / Alaska Native residents37.5 Median age for Asian residents30.4 40.4 61.9 Median age for Native Hawaiian / Pacific Islander residents26.8 Median age for Other race residents31.3 Median age for Two or more races residents24.7 30.4 44.0 Median age for White alone residents43.3 45.3 31.0 Median age for Hispanic or Latino residents34.0 30.7
Owner/renter occupied households by race in Walnut Grove
House owners and renters - White residents 2,523 71.2% Owner occupied1,019 28.8% Renter occupiedHouse owners and renters - Black or African American residents 49 74.4% Owner occupied17 25.6% Renter occupiedHouse owners and renters - American Indian / Alaska Native residents 2 100.0% Renter occupiedHouse owners and renters - Asian residents 422 100.0% Owner occupiedHouse owners and renters - Native Hawaiian / Pacific Islander residents 23 100.0% Owner occupiedHouse owners and renters - Other race residents 17 26.3% Owner occupied48 73.7% Renter occupiedHouse owners and renters - Two or more races residents 489 88.8% Owner occupied61 11.2% Renter occupiedHouse owners and renters - White alone residents 2,485 72.2% Owner occupied957 27.8% Renter occupiedHouse owners and renters - Hispanic or Latino residents 109 42.1% Owner occupied150 57.9% Renter occupied
Language usage in Walnut Grove
English speakers - Total 78.6% of residents of Walnut Grove speak English at home.
4.5% of residents speak Spanish at home 280 59.7% Speak English very well189 40.3% Speak English less than very well17.1% of residents speak other language at home 850 48.0% Speak English very well920 52.0% Speak English less than very well
English speakers - Born in the United States 94.3% of residents of Walnut Grove speak English at home.
3.1% of residents speak Spanish at home 141 84.4% Speak English very well26 15.6% Speak English less than very well2.5% of residents speak other language at home 120 90.2% Speak English very well13 9.8% Speak English less than very well
English speakers - Native, born elsewhere 65.2% of residents of Walnut Grove speak English at home.
23.9% of residents speak other language at home 4 36.4% Speak English very well7 63.6% Speak English less than very well
English speakers - Foreign-born 13.1% of residents of Walnut Grove speak English at home.
11.8% of residents speak Spanish at home 68 30.2% Speak English very well157 69.8% Speak English less than very well76.3% of residents speak other language at home 565 38.7% Speak English very well896 61.3% Speak English less than very well
White (Caucasian) - Speak only English Native:
96.3% (6,796)Foreign-born:
13.7% (119)
White (Caucasian) - Speak another language Native:
3.8% (267)Foreign-born:
84.1% (732)
Black or African American - Speak only English Native:
97.5% (127)Foreign-born:
100.0% (43)
Asian - Speak only English Native:
56.2% (142)Foreign-born:
3.7% (24)
Asian - Speak another language Native:
44.2% (112)Foreign-born:
93.3% (620)
Other race - Speak only English Native:
24.1% (20)Foreign-born:
62.8% (34)
Other race - Speak another language Native:
71.4% (58)Foreign-born:
72.3% (39)
Two or more races - Speak only English Native:
90.0% (971)Foreign-born:
48.9% (15)
White alone - Speak only English Native:
97.6% (6,593)Foreign-born:
15.2% (120)
White alone - Speak another language Native:
2.4% (165)Foreign-born:
87.2% (689)
Hispanic or Latino - Speak only English Native:
60.7% (351)Foreign-born:
8.8% (23)
Hispanic or Latino - Speak another language Native:
39.8% (230)Foreign-born:
91.3% (239)
Foreign-born residents in Walnut Grove 1,592 residents are foreign born (7.0% Europe , 4.4% Asia , 2.2% Latin America ).
This city:
14.4%Washington:
100.0%
Marital status for residents in Walnut Grove Marital status - White (Caucasian) population 15 years and over
Males 30.4% Never married50.0% Now married4.7% Separated5.7% Widowed9.2% DivorcedFemales 15.5% Never married53.9% Now married3.0% Separated9.9% Widowed17.7% DivorcedWomen who gave birth in the past 12 months Now married:
79.3% (64)Unmarried:
20.7% (17)
Women who did not give birth in the past 12 months Now married:
56.1% (831)Unmarried:
43.9% (650)
Marital status - Black or African American population 15 years and over
Males 21.7% Never married56.5% Now married0.0% Separated0.0% Widowed21.7% DivorcedFemales 45.0% Never married55.0% Now married0.0% Separated0.0% Widowed0.0% DivorcedWomen who did not give birth in the past 12 months Now married:
44.1% (18)Unmarried:
55.9% (22)
Marital status - Asian population 15 years and over
Males 46.2% Never married49.8% Now married2.0% Separated2.0% Widowed0.0% DivorcedFemales 22.7% Never married58.1% Now married0.0% Separated0.0% Widowed19.2% DivorcedWomen who gave birth in the past 12 months Now married:
100.0% (33)Unmarried:
0.0% (0)
Women who did not give birth in the past 12 months Now married:
43.4% (127)Unmarried:
56.6% (166)
Marital status - Native Hawaiian / Pacific Islander population 15 years and over
Males 0.0% Never married100.0% Now married0.0% Separated0.0% Widowed0.0% DivorcedFemales 43.3% Never married56.7% Now married0.0% Separated0.0% Widowed0.0% DivorcedWomen who did not give birth in the past 12 months Now married:
56.7% (19)Unmarried:
43.3% (14)
Marital status - Other race population 15 years and over
Males 4.0% Never married61.3% Now married0.0% Separated0.0% Widowed34.7% DivorcedFemales 0.0% Never married81.0% Now married0.0% Separated19.0% Widowed0.0% DivorcedWomen who did not give birth in the past 12 months Now married:
100.0% (41)Unmarried:
0.0% (0)
Marital status - Two or more races population 15 years and over
Males 76.6% Never married16.0% Now married0.0% Separated0.0% Widowed7.4% DivorcedFemales 50.8% Never married7.9% Now married0.0% Separated5.2% Widowed36.1% DivorcedWomen who did not give birth in the past 12 months Now married:
7.4% (30)Unmarried:
92.6% (379)
Marital status - White alone, not Hispanic / Latino population 15 years and over
Males 29.7% Never married49.9% Now married5.0% Separated5.8% Widowed9.6% DivorcedFemales 15.7% Never married53.5% Now married3.1% Separated9.9% Widowed17.8% DivorcedWomen who gave birth in the past 12 months Now married:
79.3% (64)Unmarried:
20.7% (17)
Women who did not give birth in the past 12 months Now married:
56.7% (818)Unmarried:
43.3% (625)
Marital status - Hispanic or Latino population 15 years and over
Males 33.1% Never married52.4% Now married0.0% Separated3.1% Widowed11.3% DivorcedFemales 8.1% Never married68.1% Now married0.0% Separated13.5% Widowed10.3% DivorcedWomen who did not give birth in the past 12 months Now married:
68.4% (90)Unmarried:
31.6% (42)
Ancestries in Walnut Grove
646 13.3% Ukrainian367 7.5% German218 4.5% English210 4.3% Irish199 4.1% American176 3.6% Italian139 2.9% Norwegian119 2.4% Northern European104 2.1% European71 1.5% African61 1.3% Russian53 1.1% Swedish44 0.9% Scandinavian41 0.8% British39 0.8% Scottish37 0.8% Scotch-Irish36 0.7% French Canadian32 0.7% Assyrian31 0.6% Romanian29 0.6% Finnish28 0.6% Polish25 0.5% Greek23 0.5% Dutch19 0.4% French17 0.3% South African16 0.3% Yugoslavian13 0.3% Welsh12 0.2% Canadian10 0.2% Lithuanian10 0.2% Iranian9 0.2% Swiss8 0.2% Czech7 0.1% Hungarian6 0.1% Danish6 0.1% Latvian
Children Nativity (place of birth) in Walnut Grove
Children under 6 years - Living with two parents Both parents native 294 100.0% NativeBoth parents foreign-born 150 100.0% NativeOne native, one foreign-born parent 138 100.0% NativeChildren under 6 years - Living with one parent Native parent 138 100.0% NativeChildren 6 to 17 years - Living with two parents Both parents native 546 100.0% NativeBoth parents foreign-born 298 76.5% Native92 23.5% Foreign-bornOne native, one foreign-born parent 52 100.0% NativeChildren 6 to 17 years - Living with one parent Native parent 288 100.0% Native
Grandparents responsible for own grandchildren in Walnut Grove
Grandparents (30 to 59 years) White / Caucasian 59 69.6% Responsible for grandchildren26 30.4% Not responsible for grandchildrenOther race 13 100.0% Not responsible for grandchildrenWhite alone, not Hispanic / Latino 55 67.3% Responsible for grandchildren27 32.7% Not responsible for grandchildrenHispanic or Latino 6 31.9% Responsible for grandchildren12 68.1% Not responsible for grandchildrenGrandparents (60 years and over) White / Caucasian 5 7.6% Responsible for grandchildren58 92.4% Not responsible for grandchildrenWhite alone, not Hispanic / Latino 5 7.2% Responsible for grandchildren60 92.8% Not responsible for grandchildren