Races in Wacissa, Florida (FL) Detailed Stats
Ancestries, Foreign-born residents, place of birth

Data:
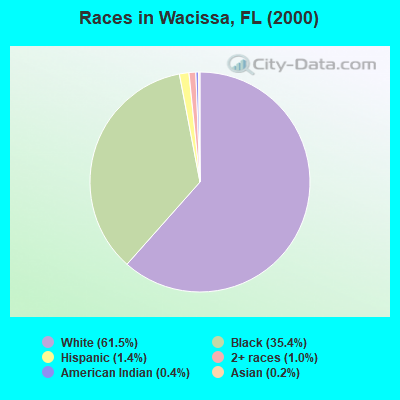
Race distribution in Wacissa

- 2,46561.5%White alone
- 1,41735.4%Black alone
- 581.4%Hispanic
- 401.0%Two or more races
- 160.4%American Indian alone
- 90.2%Asian alone
- 30.07%Other race alone
2000
2022
-
- 10,458,50965.4%White alone
- 2,682,71516.8%Hispanic
- 2,264,26814.2%Black alone
- 261,6931.6%Asian alone
- 236,9541.5%Two or more races
- 42,3580.3%American Indian alone
- 28,9940.2%Other race alone
- 6,8870.04%Native Hawaiian and Other
Pacific Islander alone
-
- 11,309,40350.8%White alone
- 6,025,03927.1%Hispanic
- 3,241,01514.6%Black alone
- 861,6303.9%Two or more races
- 623,6922.8%Asian alone
- 152,0540.7%Other race alone
- 22,5040.1%American Indian alone
- 9,4860.04%Native Hawaiian and Other
Pacific Islander alone
Income and house value in Wacissa
- Median household income in 2022
- $76,994White non-Hispanic householders
- $34,868Black householders
- $7,513American Indian and Alaska Native householders
- $9,397Asian householders
- $56,113Two or more races householders
- $36,342Hispanic or Latino race householders
- Median 2022 house value
- $249,594White Non-Hispanic householders
- $292,889Black or African American householders
- $399,526American Indian or Alaska Native householders