Races in Virginia Beach, Virginia (VA) Detailed Stats
Data:
Races - White alone (%)
Races - White alone (% change since 2000)
Races - Black alone (%)
Races - Black alone (% change since 2000)
Races - American Indian alone (%)
Races - American Indian alone (% change since 2000)
Races - Asian alone (%)
Races - Asian alone (% change since 2000)
Races - Hispanic (%)
Races - Hispanic (% change since 2000)
Races - Native Hawaiian and Other Pacific Islander alone (%)
Races - Native Hawaiian and Other Pacific Islander alone (% change since 2000)
Races - Two or more races(%)
Races - Two or more races(% change since 2000)
Races - Other race alone (%)
Races - Other race alone (% change since 2000)
Racial diversity
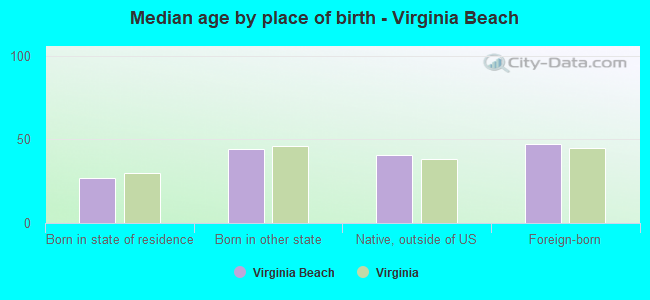
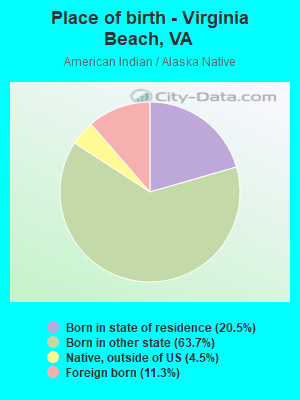
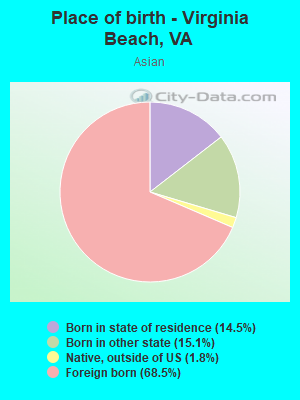
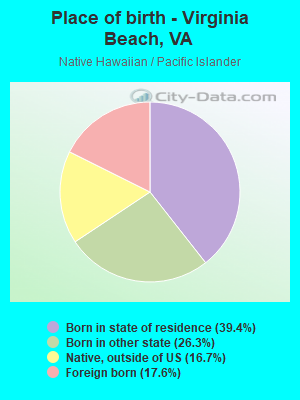
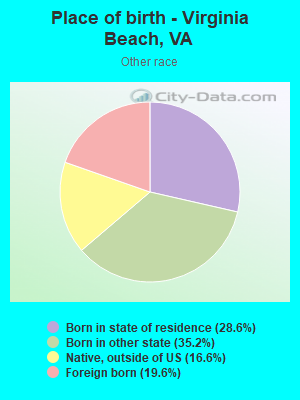
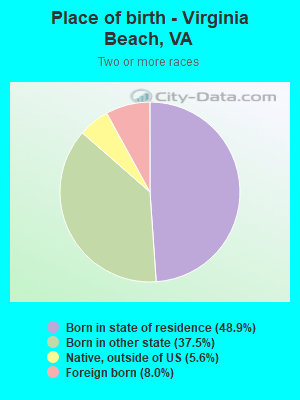
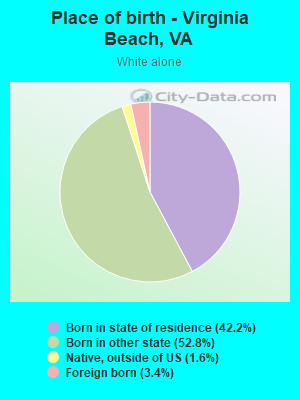
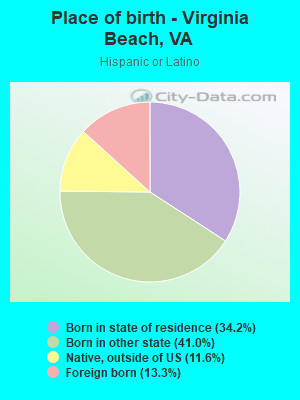
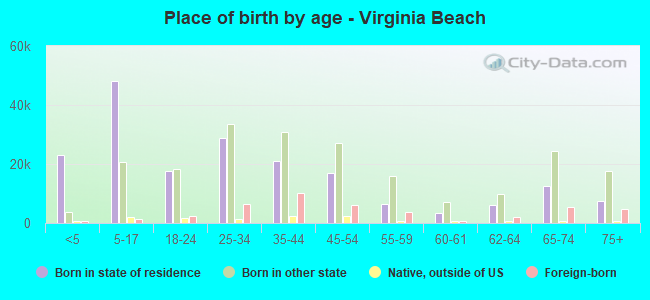
Place of birth - Born in state of residence (%)
Place of birth - Born in state of residence (%) - White
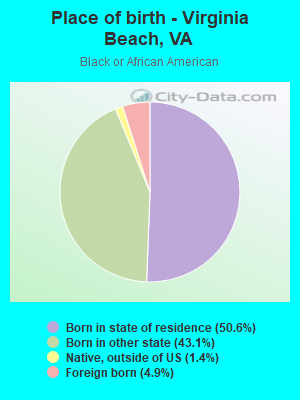
Place of birth - Born in state of residence (%) - Black or African American
Place of birth - Born in state of residence (%) - Asian
Place of birth - Born in state of residence (%) - Hispanic or Latino
Place of birth - Born in state of residence (%) - American Indian and Alaska Native
Place of birth - Born in state of residence (%) - Multirace
Place of birth - Born in state of residence (%) - Other Race
Place of birth - Born in other state (%)
Place of birth - Born in other state (%) - White
Place of birth - Born in other state (%) - Black or African American
Place of birth - Born in other state (%) - Asian
Place of birth - Born in other state (%) - Hispanic or Latino
Place of birth - Born in other state (%) - American Indian and Alaska Native
Place of birth - Born in other state (%) - Multirace
Place of birth - Born in other state (%) - Other Race
Place of birth - Native, outside of US (%)
Place of birth - Native, outside of US (%) - White
Place of birth - Native, outside of US (%) - Black or African American
Place of birth - Native, outside of US (%) - Asian
Place of birth - Native, outside of US (%) - Hispanic or Latino
Place of birth - Native, outside of US (%) - American Indian and Alaska Native
Place of birth - Native, outside of US (%) - Multirace
Place of birth - Native, outside of US (%) - Other Race
Place of birth - Foreign born (%)
Place of birth - Foreign born (%) - White
Place of birth - Foreign born (%) - Black or African American
Place of birth - Foreign born (%) - Asian
Place of birth - Foreign born (%) - Hispanic or Latino
Place of birth - Foreign born (%) - American Indian and Alaska Native
Place of birth - Foreign born (%) - Multirace
Place of birth - Foreign born (%) - Other Race
Residents speaking English at home (%)
Residents speaking English at home - Born in the United States (%)
Residents speaking English at home - Native, born elsewhere (%)
Residents speaking English at home - Foreign born (%)
Residents speaking Spanish at home (%)
Residents speaking Spanish at home - Born in the United States (%)
Residents speaking Spanish at home - Native, born elsewhere (%)
Residents speaking Spanish at home - Foreign born (%)
Residents speaking other language at home (%)
Residents speaking other language at home - Born in the United States (%)
Residents speaking other language at home - Native, born elsewhere (%)
Residents speaking other language at home - Foreign born (%)
Marital status - Never married (%)
Marital status - Now married (%)
Marital status - Separated (%)
Marital status - Widowed (%)
Marital status - Divorced (%)
Ancestries Reported - Arab (%)
Ancestries Reported - Czech (%)
Ancestries Reported - Danish (%)
Ancestries Reported - Dutch (%)
Ancestries Reported - English (%)
Ancestries Reported - French (%)
Ancestries Reported - French Canadian (%)
Ancestries Reported - German (%)
Ancestries Reported - Greek (%)
Ancestries Reported - Hungarian (%)
Ancestries Reported - Irish (%)
Ancestries Reported - Italian (%)
Ancestries Reported - Lithuanian (%)
Ancestries Reported - Norwegian (%)
Ancestries Reported - Polish (%)
Ancestries Reported - Portuguese (%)
Ancestries Reported - Russian (%)
Ancestries Reported - Scotch-Irish (%)
Ancestries Reported - Scottish (%)
Ancestries Reported - Slovak (%)
Ancestries Reported - Subsaharan African (%)
Ancestries Reported - Swedish (%)
Ancestries Reported - Swiss (%)
Ancestries Reported - Ukrainian (%)
Ancestries Reported - United States (%)
Ancestries Reported - Welsh (%)
Ancestries Reported - West Indian (%)
Ancestries Reported - Other (%)
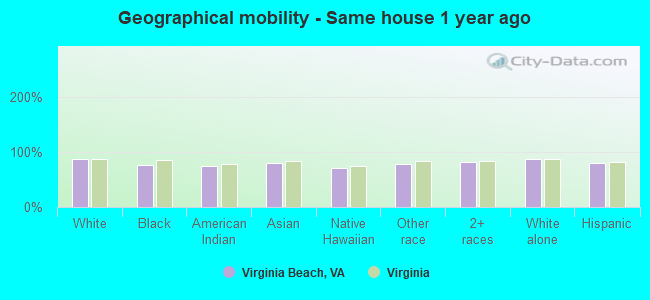
Geographical mobility - Same house 1 year ago (%)
Geographical mobility - Same house 1 year ago (%) - White
Geographical mobility - Same house 1 year ago (%) - Black or African American
Geographical mobility - Same house 1 year ago (%) - Asian
Geographical mobility - Same house 1 year ago (%) - Hispanic or Latino
Geographical mobility - Same house 1 year ago (%) - American Indian and Alaska Native
Geographical mobility - Same house 1 year ago (%) - Multirace
Geographical mobility - Same house 1 year ago (%) - Other Race
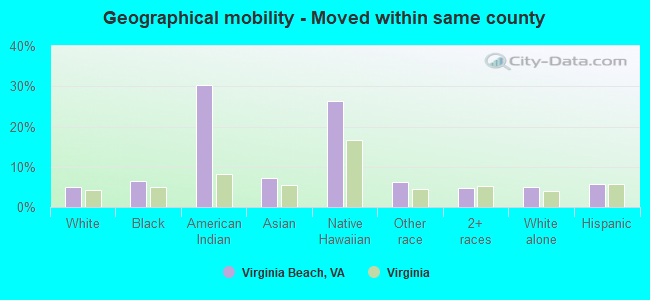
Geographical mobility - Moved within same county (%)
Geographical mobility - Moved within same county (%) - White
Geographical mobility - Moved within same county (%) - Black or African American
Geographical mobility - Moved within same county (%) - Asian
Geographical mobility - Moved within same county (%) - Hispanic or Latino
Geographical mobility - Moved within same county (%) - American Indian and Alaska Native
Geographical mobility - Moved within same county (%) - Multirace
Geographical mobility - Moved within same county (%) - Other Race
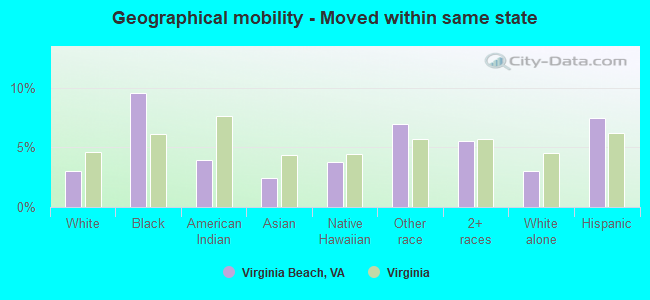
Geographical mobility - Moved from different county within same state (%)
Geographical mobility - Moved from different county within same state (%) - White
Geographical mobility - Moved from different county within same state (%) - Black or African American
Geographical mobility - Moved from different county within same state (%) - Asian
Geographical mobility - Moved from different county within same state (%) - Hispanic or Latino
Geographical mobility - Moved from different county within same state (%) - American Indian and Alaska Native
Geographical mobility - Moved from different county within same state (%) - Multirace
Geographical mobility - Moved from different county within same state (%) - Other Race
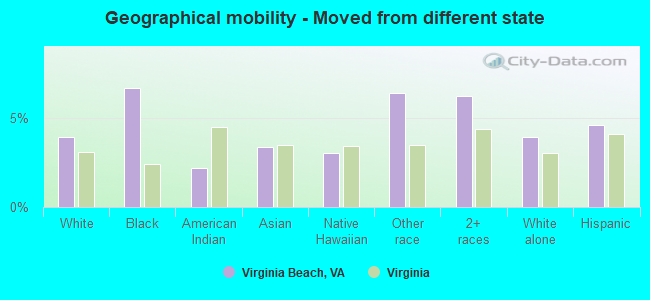
Geographical mobility - Moved from different state (%)
Geographical mobility - Moved from different state (%) - White
Geographical mobility - Moved from different state (%) - Black or African American
Geographical mobility - Moved from different state (%) - Asian
Geographical mobility - Moved from different state (%) - Hispanic or Latino
Geographical mobility - Moved from different state (%) - American Indian and Alaska Native
Geographical mobility - Moved from different state (%) - Multirace
Geographical mobility - Moved from different state (%) - Other Race
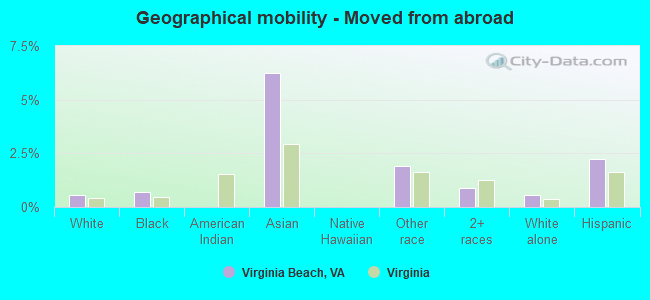
Geographical mobility - Moved from abroad (%)
Geographical mobility - Moved from abroad (%) - White
Geographical mobility - Moved from abroad (%) - Black or African American
Geographical mobility - Moved from abroad (%) - Asian
Geographical mobility - Moved from abroad (%) - Hispanic or Latino
Geographical mobility - Moved from abroad (%) - American Indian and Alaska Native
Geographical mobility - Moved from abroad (%) - Multirace
Geographical mobility - Moved from abroad (%) - Other Race
Place of birth for the foreign-born population - Ireland (%)
Place of birth for the foreign-born population - Denmark (%)
Place of birth for the foreign-born population - Norway (%)
Place of birth for the foreign-born population - Sweden (%)
Place of birth for the foreign-born population - United Kingdom (%)
Place of birth for the foreign-born population - England (%)
Place of birth for the foreign-born population - Scotland (%)
Place of birth for the foreign-born population - Other Northern Europe (%)
Place of birth for the foreign-born population - Austria (%)
Place of birth for the foreign-born population - Belgium (%)
Place of birth for the foreign-born population - France (%)
Place of birth for the foreign-born population - Germany (%)
Place of birth for the foreign-born population - Netherlands (%)
Place of birth for the foreign-born population - Switzerland (%)
Place of birth for the foreign-born population - Other Western Europe (%)
Place of birth for the foreign-born population - Greece (%)
Place of birth for the foreign-born population - Italy (%)
Place of birth for the foreign-born population - Portugal (%)
Place of birth for the foreign-born population - Spain (%)
Place of birth for the foreign-born population - Other Southern Europe (%)
Place of birth for the foreign-born population - Albania (%)
Place of birth for the foreign-born population - Belarus (%)
Place of birth for the foreign-born population - Bosnia and Herzegovina (%)
Place of birth for the foreign-born population - Bulgaria (%)
Place of birth for the foreign-born population - Croatia (%)
Place of birth for the foreign-born population - Czechoslovakia (%)
Place of birth for the foreign-born population - Hungary (%)
Place of birth for the foreign-born population - Latvia (%)
Place of birth for the foreign-born population - Lithuania (%)
Place of birth for the foreign-born population - North Macedonia (Macedonia) (%)
Place of birth for the foreign-born population - Moldova (%)
Place of birth for the foreign-born population - Poland (%)
Place of birth for the foreign-born population - Romania (%)
Place of birth for the foreign-born population - Russia (%)
Place of birth for the foreign-born population - Serbia (%)
Place of birth for the foreign-born population - Ukraine (%)
Place of birth for the foreign-born population - Other Eastern Europe (%)
Place of birth for the foreign-born population - China (%)
Place of birth for the foreign-born population - Hong Kong (%)
Place of birth for the foreign-born population - Taiwan (%)
Place of birth for the foreign-born population - Japan (%)
Place of birth for the foreign-born population - Korea (%)
Place of birth for the foreign-born population - Other Eastern Asia (%)
Place of birth for the foreign-born population - Afghanistan (%)
Place of birth for the foreign-born population - Bangladesh (%)
Place of birth for the foreign-born population - India (%)
Place of birth for the foreign-born population - Iran (%)
Place of birth for the foreign-born population - Kazakhstan (%)
Place of birth for the foreign-born population - Nepal (%)
Place of birth for the foreign-born population - Pakistan (%)
Place of birth for the foreign-born population - Sri Lanka (%)
Place of birth for the foreign-born population - Uzbekistan (%)
Place of birth for the foreign-born population - Other South Central Asia (%)
Place of birth for the foreign-born population - Burma (%)
Place of birth for the foreign-born population - Cambodia (%)
Place of birth for the foreign-born population - Indonesia (%)
Place of birth for the foreign-born population - Laos (%)
Place of birth for the foreign-born population - Malaysia (%)
Place of birth for the foreign-born population - Philippines (%)
Place of birth for the foreign-born population - Singapore (%)
Place of birth for the foreign-born population - Thailand (%)
Place of birth for the foreign-born population - Vietnam (%)
Place of birth for the foreign-born population - Other South Eastern Asia (%)
Place of birth for the foreign-born population - Armenia (%)
Place of birth for the foreign-born population - Iraq (%)
Place of birth for the foreign-born population - Israel (%)
Place of birth for the foreign-born population - Jordan (%)
Place of birth for the foreign-born population - Kuwait (%)
Place of birth for the foreign-born population - Lebanon (%)
Place of birth for the foreign-born population - Saudi Arabia (%)
Place of birth for the foreign-born population - Syria (%)
Place of birth for the foreign-born population - Turkey (%)
Place of birth for the foreign-born population - Yemen (%)
Place of birth for the foreign-born population - Other Western Asia (%)
Place of birth for the foreign-born population - Eritrea (%)
Place of birth for the foreign-born population - Ethiopia (%)
Place of birth for the foreign-born population - Kenya (%)
Place of birth for the foreign-born population - Somalia (%)
Place of birth for the foreign-born population - Uganda (%)
Place of birth for the foreign-born population - Zimbabwe (%)
Place of birth for the foreign-born population - Other Eastern Africa (%)
Place of birth for the foreign-born population - Cameroon (%)
Place of birth for the foreign-born population - Congo (%)
Place of birth for the foreign-born population - Democratic Republic of Congo (Zaire) (%)
Place of birth for the foreign-born population - Other Middle Africa (%)
Place of birth for the foreign-born population - Egypt (%)
Place of birth for the foreign-born population - Morocco (%)
Place of birth for the foreign-born population - Sudan (%)
Place of birth for the foreign-born population - Other Northern Africa (%)
Place of birth for the foreign-born population - South Africa (%)
Place of birth for the foreign-born population - Other Southern Africa (%)
Place of birth for the foreign-born population - Cabo Verde (%)
Place of birth for the foreign-born population - Ghana (%)
Place of birth for the foreign-born population - Liberia (%)
Place of birth for the foreign-born population - Nigeria (%)
Place of birth for the foreign-born population - Senegal (%)
Place of birth for the foreign-born population - Sierra Leone (%)
Place of birth for the foreign-born population - Other Western Africa (%)
Place of birth for the foreign-born population - Australia (%)
Place of birth for the foreign-born population - New Zealand (%)
Place of birth for the foreign-born population - Fiji (%)
Place of birth for the foreign-born population - Micronesia (%)
Place of birth for the foreign-born population - Bahamas (%)
Place of birth for the foreign-born population - Barbados (%)
Place of birth for the foreign-born population - Cuba (%)
Place of birth for the foreign-born population - Dominica (%)
Place of birth for the foreign-born population - Dominican Republic (%)
Place of birth for the foreign-born population - Grenada (%)
Place of birth for the foreign-born population - Haiti (%)
Place of birth for the foreign-born population - Jamaica (%)
Place of birth for the foreign-born population - St. Vincent and the Grenadines (%)
Place of birth for the foreign-born population - Trinidad and Tobago (%)
Place of birth for the foreign-born population - West Indies (%)
Place of birth for the foreign-born population - Other Caribbean (%)
Place of birth for the foreign-born population - Belize (%)
Place of birth for the foreign-born population - Costa Rica (%)
Place of birth for the foreign-born population - El Salvador (%)
Place of birth for the foreign-born population - Guatemala (%)
Place of birth for the foreign-born population - Honduras (%)
Place of birth for the foreign-born population - Mexico (%)
Place of birth for the foreign-born population - Nicaragua (%)
Place of birth for the foreign-born population - Panama (%)
Place of birth for the foreign-born population - Other Central America (%)
Place of birth for the foreign-born population - Argentina (%)
Place of birth for the foreign-born population - Bolivia (%)
Place of birth for the foreign-born population - Brazil (%)
Place of birth for the foreign-born population - Chile (%)
Place of birth for the foreign-born population - Colombia (%)
Place of birth for the foreign-born population - Ecuador (%)
Place of birth for the foreign-born population - Guyana (%)
Place of birth for the foreign-born population - Peru (%)
Place of birth for the foreign-born population - Uruguay (%)
Place of birth for the foreign-born population - Venezuela (%)
Place of birth for the foreign-born population - Other South America (%)
Place of birth for the foreign-born population - Canada (%)
Place of birth for the foreign-born population - Other Northern America (%)
Place of birth for the foreign-born population - Other (%)
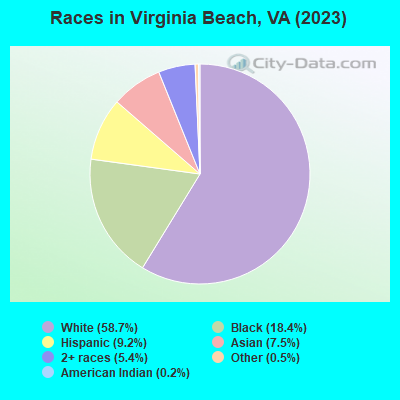
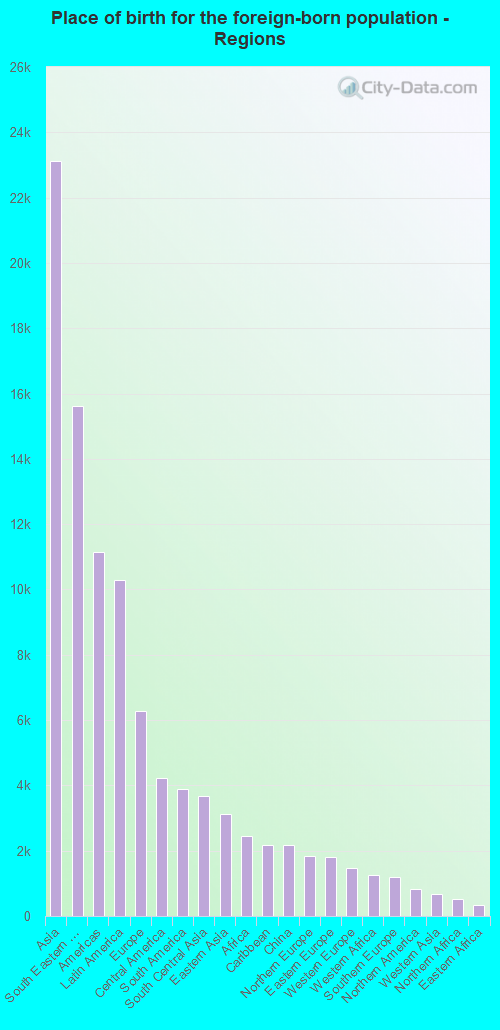
According to 2022 data, the most numerous races in Virginia Beach, VA are White alone (267,514 residents), Black alone (82,100 residents), and Hispanic (41,186 residents). 87.9% of Virginia Beach residents speak English at home. 9.5% of Virginia Beach, VA residents are foreign-born (5.0% born in Asia, 2.2% born in Latin America, 1.4% born in Europe), which is 26.8% less than the foreign-born rate of 12.0% across the entire state of Virginia.
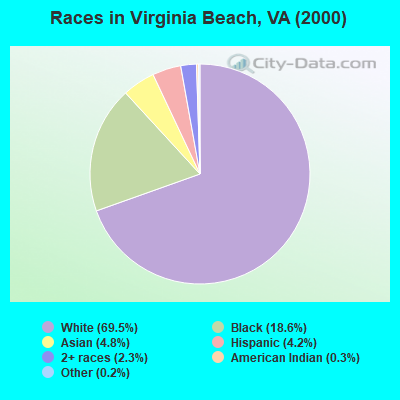
Race distribution in Virginia Beach
2000 2022
295,402 69.5% White alone 79,092 18.6% Black alone 20,618 4.8% Asian alone 17,770 4.2% Hispanic 9,658 2.3% Two or more races 1,448 0.3% American Indian alone 913 0.2% Other race alone 356 0.08% Native Hawaiian and Other
267,514 58.7% White alone 82,100 18.0% Black alone 41,186 9.0% Hispanic 30,982 6.8% Asian alone 29,704 6.5% Two or more races 2,654 0.6% Other race alone 888 0.2% Native Hawaiian and Other 590 0.1% American Indian alone
2000 2022
4,965,637 70.2% White alone 1,376,378 19.4% Black alone 329,540 4.7% Hispanic 259,277 3.7% Asian alone 114,022 1.6% Two or more races 18,596 0.3% American Indian alone 11,685 0.2% Other race alone 3,380 0.05% Native Hawaiian and Other
5,095,130 58.7% White alone 1,594,785 18.4% Black alone 905,750 10.4% Hispanic 602,881 6.9% Asian alone 406,047 4.7% Two or more races 60,419 0.7% Other race alone 11,738 0.1% American Indian alone 6,869 0.08% Native Hawaiian and Other
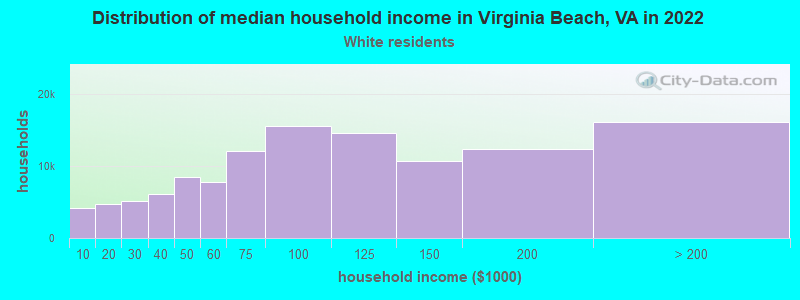
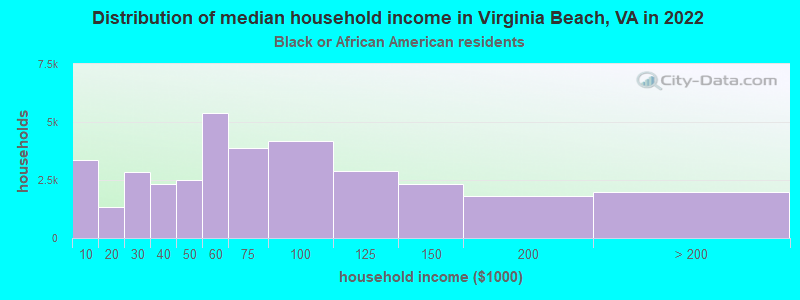
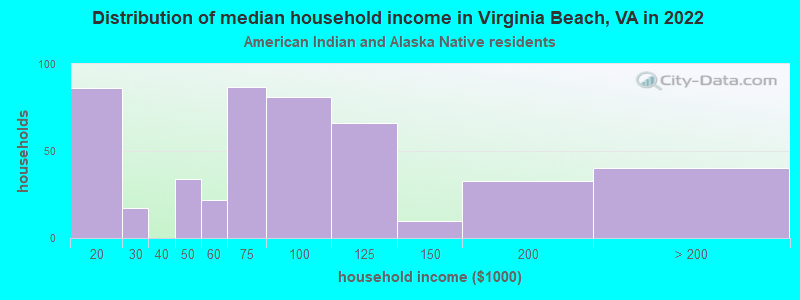
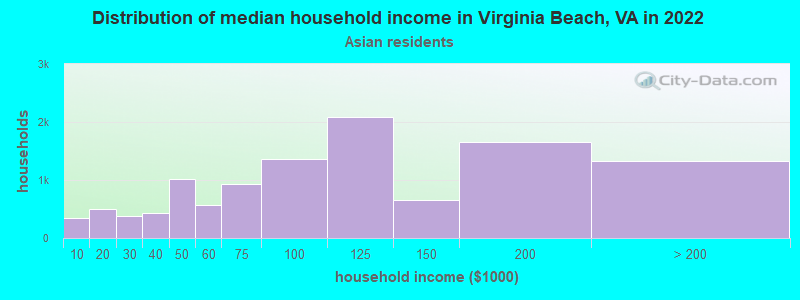
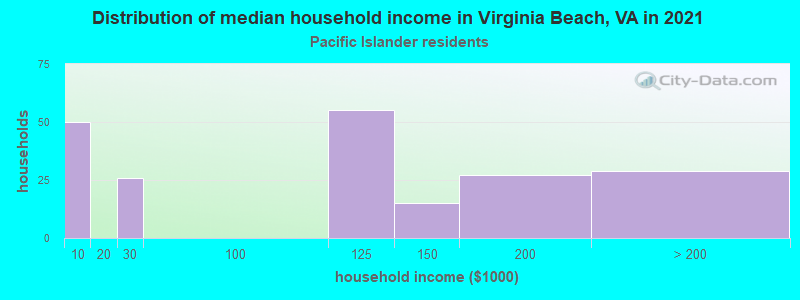
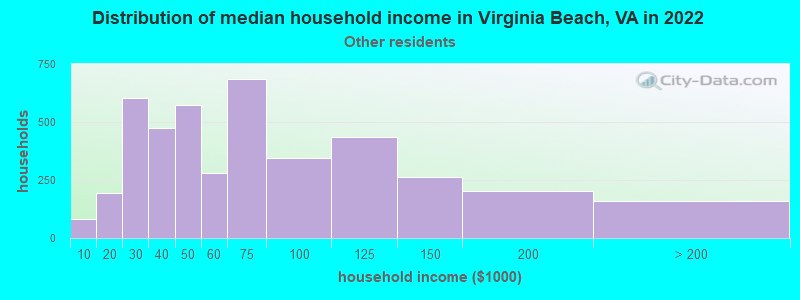
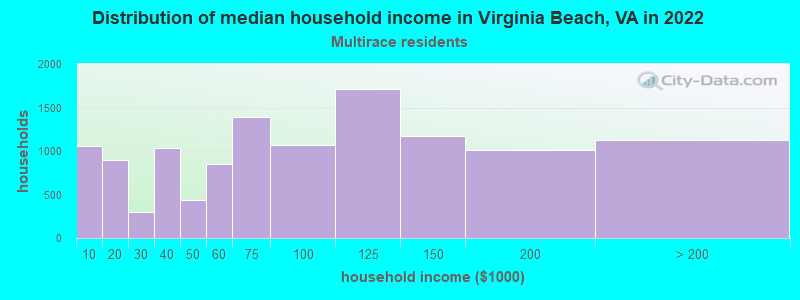
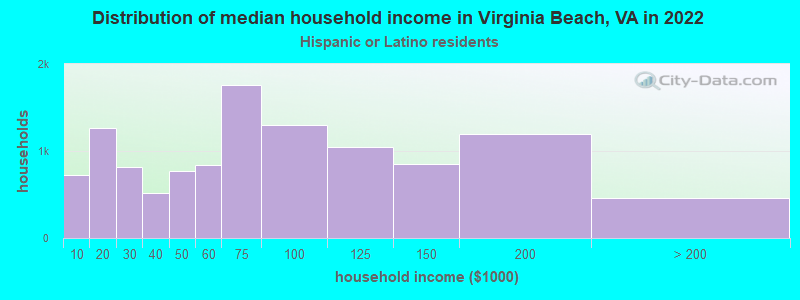
Income and house value in Virginia Beach Median household income in 2022 $91,020 White non-Hispanic householders$58,452 Black householders$76,104 American Indian and Alaska Native householders$102,203 Asian householders$77,534 Some other race householders$78,293 Two or more races householders$66,303 Hispanic or Latino race householdersMedian 2022 house value $395,900 White Non-Hispanic householders$298,982 Black or African American householders$330,069 American Indian or Alaska Native householders $362,375 Asian householders$386,453 Native Hawaiian and other Pacific Islander householders$315,135 Some other race householders$303,554 Two or more races householders$344,089 Hispanic or Latino householders
Median age by race in Virginia Beach
40.8 Median age for White residents39.5 42.2 34.4 Median age for Black or African American residents33.2 37.1 33.6 Median age for American Indian / Alaska Native residents33.9 31.5 42.6 Median age for Asian residents38.5 45.0 38.5 Median age for Native Hawaiian / Pacific Islander residents35.5 42.5 31.2 Median age for Other race residents33.4 29.3 25.2 Median age for Two or more races residents24.8 25.7 41.3 Median age for White alone residents39.8 43.0 29.0 Median age for Hispanic or Latino residents27.0 30.4
Owner/renter occupied households by race in Virginia Beach
House owners and renters - White residents 82,467 70.0% Owner occupied35,420 30.0% Renter occupiedHouse owners and renters - Black or African American residents 15,556 44.6% Owner occupied19,303 55.4% Renter occupiedHouse owners and renters - American Indian / Alaska Native residents 321 45.5% Owner occupied384 54.5% Renter occupiedHouse owners and renters - Asian residents 7,660 68.0% Owner occupied3,608 32.0% Renter occupiedHouse owners and renters - Native Hawaiian / Pacific Islander residents 51 36.8% Owner occupied88 63.2% Renter occupiedHouse owners and renters - Other race residents 1,322 46.2% Owner occupied1,541 53.8% Renter occupiedHouse owners and renters - Two or more races residents 6,700 55.5% Owner occupied5,369 44.5% Renter occupiedHouse owners and renters - White alone residents 81,013 70.1% Owner occupied34,550 29.9% Renter occupiedHouse owners and renters - Hispanic or Latino residents 5,627 48.7% Owner occupied5,917 51.3% Renter occupied
Language usage in Virginia Beach
English speakers - Total 87.9% of residents of Virginia Beach speak English at home.
3.9% of residents speak Spanish at home 11,772 70.0% Speak English very well5,036 30.0% Speak English less than very well8.2% of residents speak other language at home 24,054 68.2% Speak English very well11,196 31.8% Speak English less than very well
English speakers - Born in the United States 94.7% of residents of Virginia Beach speak English at home.
3.4% of residents speak Spanish at home 5,756 82.7% Speak English very well1,207 17.3% Speak English less than very well1.9% of residents speak other language at home 3,426 88.2% Speak English very well457 11.8% Speak English less than very well
English speakers - Native, born elsewhere 69.1% of residents of Virginia Beach speak English at home.
26.0% of residents speak Spanish at home 1,306 43.1% Speak English very well1,724 56.9% Speak English less than very well5.0% of residents speak other language at home 465 80.2% Speak English very well115 19.8% Speak English less than very well
English speakers - Foreign-born 24.5% of residents of Virginia Beach speak English at home.
9.8% of residents speak Spanish at home 2,858 68.1% Speak English very well1,338 31.9% Speak English less than very well65.7% of residents speak other language at home 17,981 63.9% Speak English very well10,141 36.1% Speak English less than very well
White (Caucasian) - Speak only English Native:
98.0% (246,429)Foreign-born:
46.2% (4,359)
White (Caucasian) - Speak another language Native:
2.0% (5,114)Foreign-born:
53.8% (5,076)
Black or African American - Speak only English Native:
96.9% (73,385)Foreign-born:
44.0% (1,848)
Black or African American - Speak another language Native:
3.1% (2,358)Foreign-born:
56.0% (2,349)
American Indian / Alaska Native - Speak only English Native:
77.2% (737)Foreign-born:
28.8% (36)
American Indian / Alaska Native - Speak another language Native:
22.9% (219)Foreign-born:
18.4% (23)
Asian - Speak only English Native:
61.8% (5,766)Foreign-born:
13.5% (3,023)
Asian - Speak another language Native:
38.2% (3,567)Foreign-born:
86.5% (19,371)
Native Hawaiian / Pacific Islander - Speak another language Native:
27.7% (158)Foreign-born:
49.7% (71)
Other race - Speak only English Native:
63.2% (5,956)Foreign-born:
26.9% (687)
Other race - Speak another language Native:
36.8% (3,472)Foreign-born:
73.1% (1,870)
Two or more races - Speak only English Native:
88.1% (33,330)Foreign-born:
15.0% (561)
Two or more races - Speak another language Native:
11.9% (4,495)Foreign-born:
85.0% (3,184)
White alone - Speak only English Native:
98.4% (241,521)Foreign-born:
47.3% (4,313)
White alone - Speak another language Native:
1.6% (4,044)Foreign-born:
52.7% (4,813)
Hispanic or Latino - Speak only English Native:
72.2% (23,169)Foreign-born:
21.7% (1,184)
Hispanic or Latino - Speak another language Native:
27.8% (8,915)Foreign-born:
78.3% (4,277)
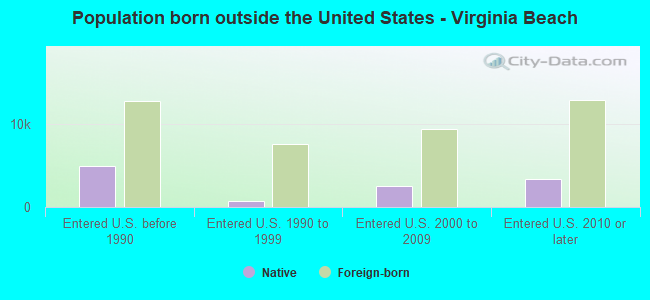
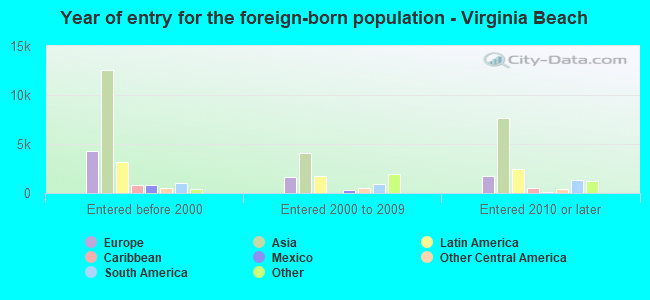
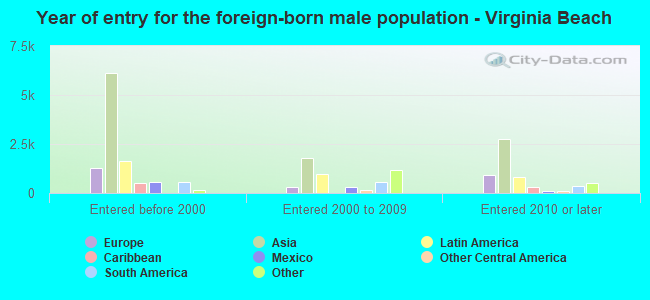
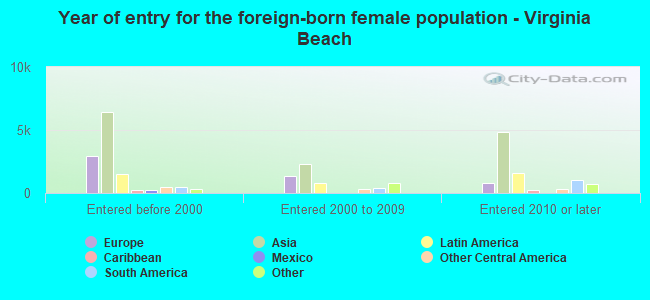
Foreign-born residents in Virginia Beach 43,102 residents are foreign born (5.0% Asia , 2.2% Latin America , 1.4% Europe ).
This city:
9.5%Virginia:
12.6%
Marital status for residents in Virginia Beach Marital status - White (Caucasian) population 15 years and over
Males 32.3% Never married54.6% Now married2.4% Separated2.8% Widowed7.8% DivorcedFemales 24.3% Never married50.1% Now married2.3% Separated8.6% Widowed14.8% DivorcedWomen who gave birth in the past 12 months Now married:
79.4% (2,369)Unmarried:
20.6% (615)
Women who did not give birth in the past 12 months Now married:
47.3% (27,786)Unmarried:
52.7% (31,016)
Marital status - Black or African American population 15 years and over
Males 47.0% Never married36.5% Now married4.1% Separated2.5% Widowed9.9% DivorcedFemales 43.0% Never married32.3% Now married3.8% Separated7.3% Widowed13.5% DivorcedWomen who gave birth in the past 12 months Now married:
56.6% (676)Unmarried:
43.4% (518)
Women who did not give birth in the past 12 months Now married:
31.0% (7,159)Unmarried:
69.0% (15,939)
Marital status - American Indian / Alaska Native population 15 years and over
Males 37.4% Never married45.2% Now married0.0% Separated0.0% Widowed17.4% DivorcedFemales 27.2% Never married41.8% Now married0.0% Separated3.7% Widowed27.4% DivorcedWomen who gave birth in the past 12 months Now married:
100.0% (33)Unmarried:
0.0% (0)
Women who did not give birth in the past 12 months Now married:
25.8% (69)Unmarried:
74.2% (199)
Marital status - Asian population 15 years and over
Males 27.2% Never married67.6% Now married1.3% Separated0.4% Widowed3.6% DivorcedFemales 19.7% Never married66.8% Now married0.9% Separated6.9% Widowed5.6% DivorcedWomen who gave birth in the past 12 months Now married:
100.0% (721)Unmarried:
0.0% (0)
Women who did not give birth in the past 12 months Now married:
62.4% (5,134)Unmarried:
37.6% (3,093)
Marital status - Native Hawaiian / Pacific Islander population 15 years and over
Males 12.1% Never married67.3% Now married12.6% Separated0.0% Widowed7.9% DivorcedFemales 23.5% Never married64.3% Now married12.2% Separated0.0% Widowed0.0% DivorcedWomen who did not give birth in the past 12 months Now married:
73.0% (170)Unmarried:
27.0% (63)
Marital status - Other race population 15 years and over
Males 46.8% Never married47.2% Now married0.0% Separated0.6% Widowed5.3% DivorcedFemales 29.6% Never married52.7% Now married2.6% Separated7.3% Widowed7.9% DivorcedWomen who gave birth in the past 12 months Now married:
100.0% (226)Unmarried:
0.0% (0)
Women who did not give birth in the past 12 months Now married:
55.2% (2,116)Unmarried:
44.8% (1,718)
Marital status - Two or more races population 15 years and over
Males 50.2% Never married36.1% Now married3.4% Separated3.2% Widowed7.1% DivorcedFemales 34.9% Never married43.4% Now married0.6% Separated3.1% Widowed18.0% DivorcedWomen who gave birth in the past 12 months Now married:
100.0% (770)Unmarried:
0.0% (0)
Women who did not give birth in the past 12 months Now married:
35.3% (3,238)Unmarried:
64.7% (5,928)
Marital status - White alone, not Hispanic / Latino population 15 years and over
Males 32.1% Never married54.6% Now married2.5% Separated2.9% Widowed8.0% DivorcedFemales 24.0% Never married49.9% Now married2.3% Separated8.8% Widowed15.0% DivorcedWomen who gave birth in the past 12 months Now married:
78.3% (2,225)Unmarried:
21.7% (615)
Women who did not give birth in the past 12 months Now married:
47.0% (26,578)Unmarried:
53.0% (29,957)
Marital status - Hispanic or Latino population 15 years and over
Males 49.4% Never married40.3% Now married3.7% Separated1.7% Widowed4.9% DivorcedFemales 32.7% Never married49.5% Now married3.7% Separated3.5% Widowed10.6% DivorcedWomen who gave birth in the past 12 months Now married:
100.0% (803)Unmarried:
0.0% (0)
Women who did not give birth in the past 12 months Now married:
48.8% (5,375)Unmarried:
51.2% (5,635)
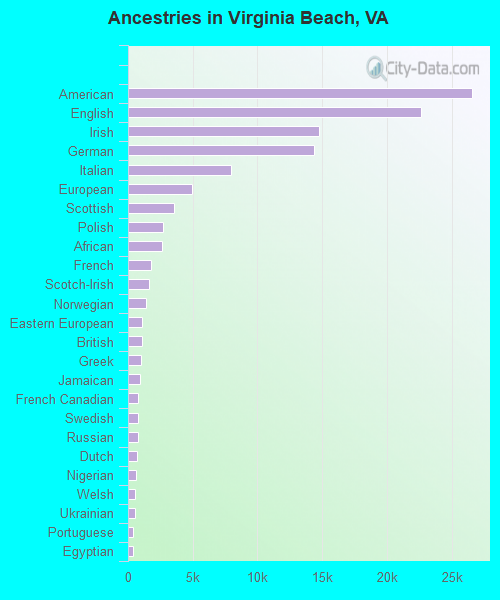
Ancestries in Virginia Beach
26,550 11.8% American22,632 10.0% English14,727 6.5% Irish14,337 6.4% German7,982 3.5% Italian4,930 2.2% European3,566 1.6% Scottish2,694 1.2% Polish2,646 1.2% African1,738 0.8% French1,647 0.7% Scotch-Irish1,367 0.6% Norwegian1,068 0.5% Eastern European1,044 0.5% British1,023 0.5% Greek949 0.4% Jamaican810 0.4% French Canadian769 0.3% Swedish762 0.3% Russian669 0.3% Dutch649 0.3% Nigerian540 0.2% Welsh535 0.2% Ukrainian393 0.2% Portuguese369 0.2% Egyptian365 0.2% Scandinavian362 0.2% Lithuanian355 0.2% Albanian342 0.2% Northern European326 0.1% Czech324 0.1% Slovak318 0.1% Ghanaian313 0.1% Canadian266 0.1% Haitian257 0.1% Turkish243 0.1% Romanian237 0.1% Lebanese235 0.1% Austrian220 0.10% West Indian218 0.10% Hungarian201 0.09% Brazilian189 0.08% Danish145 0.06% Armenian133 0.06% Israeli132 0.06% Bulgarian132 0.06% Trinidadian and Tobagonian128 0.06% Swiss128 0.06% British West Indian116 0.05% Ethiopian102 0.05% Palestinian101 0.04% Cypriot99 0.04% Liberian95 0.04% Finnish94 0.04% Afghan93 0.04% Guyanese90 0.04% South African89 0.04% Iranian87 0.04% Czechoslovakian84 0.04% Belgian67 0.03% Icelander65 0.03% Moroccan60 0.03% Syrian56 0.02% Serbian44 0.02% Pennsylvania German44 0.02% Australian41 0.02% Sudanese37 0.02% Slavic37 0.02% Celtic27 0.01% Cape Verdean27 0.01% Dutch West Indian25 0.01% Slovene22 0.01% Estonian22 0.01% Croatian19 0.01% Barbadian18 0.01% Senegalese18 0.01% Kenyan16 0.01% Belizean12 0.01% Latvian
Geographical mobility in Virginia Beach Same house 1 year ago 237,861 87.5% White (Caucasian)64,450 76.7% Black or African American876 74.4% American Indian / Alaska Native26,338 80.8% Asian550 71.6% Native Hawaiian / Pacific Islander9,932 78.6% Other race37,800 82.7% Two or more races231,949 87.5% White alone, not Hispanic / Latino31,946 80.1% Hispanic or LatinoMoved within same county 13,722 5.0% White / Caucasian5,390 6.4% Black or African American356 30.2% American Indian / Alaska Native2,315 7.1% Asian203 26.4% Native Hawaiian / Pacific Islander770 6.1% Other race2,156 4.7% Two or more races13,118 4.9% White alone, not Hispanic / Latino2,233 5.6% Hispanic or LatinoMoved within same state 8,184 3.0% White / Caucasian8,050 9.6% Black or African American46 3.9% American Indian / Alaska Native796 2.4% Asian29 3.8% Native Hawaiian / Pacific Islander884 7.0% Other race2,513 5.5% Two or more races8,063 3.0% White alone, not Hispanic / Latino2,980 7.5% Hispanic or LatinoMoved from different state 10,608 3.9% White / Caucasian5,610 6.7% Black or African American26 2.2% American Indian / Alaska Native1,096 3.4% Asian23 3.0% Native Hawaiian / Pacific Islander805 6.4% Other race2,823 6.2% Two or more races10,419 3.9% White alone, not Hispanic / Latino1,829 4.6% Hispanic or LatinoMoved from abroad 1,525 0.6% White569 0.7% Black or African American2,034 6.2% Asian240 1.9% Other race398 0.9% Two or more races1,525 0.6% White alone, not Hispanic / Latino888 2.2% Hispanic or Latino
Children Nativity (place of birth) in Virginia Beach
Children under 6 years - Living with two parents Both parents native 17,879 100.0% NativeBoth parents foreign-born 1,459 100.0% NativeOne native, one foreign-born parent 2,902 100.0% NativeChildren under 6 years - Living with one parent Native parent 7,981 100.0% NativeForeign-born parent 75 100.0% NativeChildren 6 to 17 years - Living with two parents Both parents native 31,777 99.9% Native47 0.1% Foreign-bornBoth parents foreign-born 3,427 83.0% Native703 17.0% Foreign-bornOne native, one foreign-born parent 2,978 94.9% Native160 5.1% Foreign-bornChildren 6 to 17 years - Living with one parent Native parent 24,662 100.0% NativeForeign-born parent 1,451 52.2% Native1,329 47.8% Foreign-born
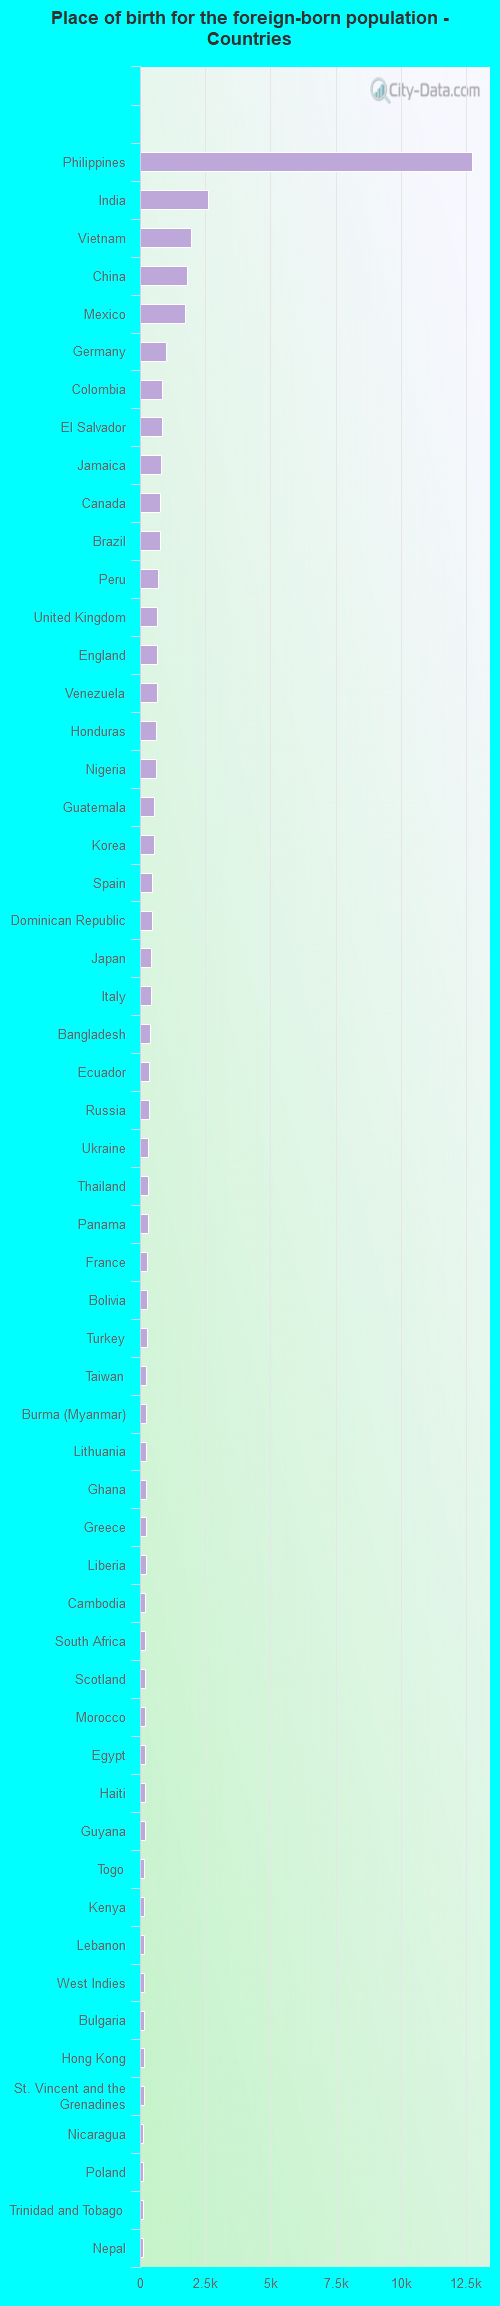
Place of birth for residents in Virginia Beach 23,109 Asia15,630 South Eastern Asia11,133 Americas10,290 Latin America6,282 Europe4,211 Central America3,891 South America3,662 South Central Asia3,137 Eastern Asia2,452 Africa2,187 Caribbean2,185 China1,823 Northern Europe1,811 Eastern Europe1,463 Western Europe1,241 Western Africa1,184 Southern Europe842 Northern America679 Western Asia516 Northern Africa352 Eastern Africa209 Southern Africa123 Oceania115 Australia and New Zealand Subregion67 Middle Africa12,745 Philippines2,626 India1,955 Vietnam1,786 China1,728 Mexico1,006 Germany849 Colombia826 El Salvador806 Jamaica771 Canada754 Brazil690 Peru636 United Kingdom635 England634 Venezuela623 Honduras606 Nigeria533 Guatemala533 Korea450 Spain446 Dominican Republic418 Japan405 Italy402 Bangladesh361 Ecuador342 Russia325 Ukraine298 Thailand292 Panama283 France267 Bolivia254 Turkey248 Taiwan243 Burma (Myanmar)235 Lithuania235 Ghana227 Greece211 Liberia209 Cambodia209 South Africa200 Scotland196 Morocco182 Egypt178 Haiti173 Guyana172 Togo168 Kenya166 Lebanon163 West Indies160 Bulgaria150 Hong Kong139 St. Vincent and the Grenadines132 Nicaragua131 Poland126 Trinidad and Tobago122 Nepal115 Cuba115 Czechoslovakia114 Pakistan102 Australia101 Portugal98 Iran93 Ethiopia93 Romania88 Hungary88 Afghanistan86 Indonesia82 Israel81 Sri Lanka78 Ireland76 Chile75 Algeria74 Norway65 Cameroon65 Belarus64 Netherlands64 Costa Rica58 Sweden55 Albania53 Switzerland53 Moldova52 Denmark51 Kazakhstan49 Grenada44 Belgium38 Malaysia38 Sudan36 Singapore35 Uzbekistan26 Serbia25 Argentina25 United Arab Emirates25 Barbados23 Bosnia and Herzegovina22 Saudi Arabia19 St. Lucia18 Syria17 Laos15 Bahamas15 Senegal15 Tanzania13 New Zealand11 Jordan10 Austria10 Belize7 Uruguay5 Eritrea2 Congo
Grandparents responsible for own grandchildren in Virginia Beach
Grandparents (30 to 59 years) White / Caucasian 313 30.0% Responsible for grandchildren732 70.0% Not responsible for grandchildrenBlack or African American 65 7.2% Responsible for grandchildren833 92.8% Not responsible for grandchildrenAsian 15 5.3% Responsible for grandchildren271 94.7% Not responsible for grandchildrenNative Hawaiian / Pacific Islander 26 100.0% Responsible for grandchildrenOther race 59 49.6% Responsible for grandchildren60 50.4% Not responsible for grandchildrenTwo or more races 35 43.1% Responsible for grandchildren46 56.9% Not responsible for grandchildrenWhite alone, not Hispanic / Latino 313 32.1% Responsible for grandchildren662 67.9% Not responsible for grandchildrenHispanic or Latino 79 41.3% Responsible for grandchildren113 58.7% Not responsible for grandchildrenGrandparents (60 years and over) White / Caucasian 874 30.0% Responsible for grandchildren2,036 70.0% Not responsible for grandchildrenBlack or African American 822 34.5% Responsible for grandchildren1,561 65.5% Not responsible for grandchildrenAsian 77 10.0% Responsible for grandchildren695 90.0% Not responsible for grandchildrenOther race 153 100.0% Not responsible for grandchildrenTwo or more races 37 35.4% Responsible for grandchildren68 64.6% Not responsible for grandchildrenWhite alone, not Hispanic / Latino 874 30.0% Responsible for grandchildren2,036 70.0% Not responsible for grandchildrenHispanic or Latino 52 15.5% Responsible for grandchildren284 84.5% Not responsible for grandchildren
Zip codes: 23451 , 23452 , 23453 , 23454 , 23455 , 23456 , 23457 , 23459 , 23460 , 23461 , 23462 , 23464 .