Races in Village of Lake Isabella, Michigan (MI) Detailed Stats
Ancestries, Foreign-born residents, place of birth

Discuss Village of Lake Isabella, Michigan races on our local forum with over 2,400,000 registered users
0.4% of Village of Lake Isabella, MI residents are foreign-born , which is 1391.6% less than the foreign-born rate of 6.0% across the entire state of Michigan.
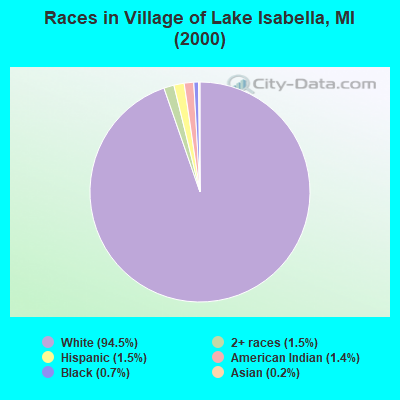
Race distribution in Village of Lake Isabella

- 1,17594.5%White alone
- 191.5%Hispanic
- 191.5%Two or more races
- 171.4%American Indian alone
- 90.7%Black alone
- 30.2%Asian alone
- 10.08%Other race alone
2000
2022
-
- 7,806,69178.6%White alone
- 1,402,04714.1%Black alone
- 323,8773.3%Hispanic
- 175,3111.8%Asian alone
- 163,4871.6%Two or more races
- 53,4210.5%American Indian alone
- 11,4650.1%Other race alone
- 2,1450.02%Native Hawaiian and Other
Pacific Islander alone

-
- 7,289,05172.6%White alone
- 1,310,46413.1%Black alone
- 572,4055.7%Hispanic
- 450,0314.5%Two or more races
- 335,7323.3%Asian alone
- 45,2170.5%Other race alone
- 29,0110.3%American Indian alone
- 2,2070.02%Native Hawaiian and Other
Pacific Islander alone

Income and house value in Village of Lake Isabella
- Median household income in 2022
- $63,262White non-Hispanic householders
- $63,318American Indian and Alaska Native householders
- $76,212Some other race householders
- $87,370Two or more races householders
- $81,508Hispanic or Latino race householders
- Median 2022 house value
- $230,125White Non-Hispanic householders
- $171,134Some other race householders
- $239,185Hispanic or Latino householders
Household income for White non-Hispanic householders

Household income for American Indian and Alaska Native householders

Household income for Two or more races householders

Household income for Hispanic or Latino race householders

Foreign-born residents in Village of Lake Isabella
5 residents are foreign born
| This city: | 0.4% |
| Michigan: | 5.3% |
Ancestries in Village of Lake Isabella

- 42528.9%German
- 20413.9%English
- 18612.7%Irish
- 1228.3%United States
- 1198.1%Other
- 775.2%French
- 704.8%Polish
- 503.4%Dutch
- 503.4%Italian
- 382.6%Scottish
- 292.0%French Canadian
- 292.0%Scotch-Irish
- 161.1%Norwegian
- 161.1%Welsh
- 110.7%Swedish
- 80.5%Hungarian
- 40.3%Danish
- 40.3%Greek
- 40.3%Russian
- 20.1%Czech
- 20.1%Lithuanian
- 20.1%Ukrainian
- 10.07%Portuguese
- 10.07%Slovak

Zip codes: 48893.