Races in Valparaiso, Florida (FL) Detailed Stats
Ancestries, Foreign-born residents, place of birth
Settings
X


Recent posts about races in Valparaiso, Florida on our local forum with over 2,400,000 registered users:
 | Affordable Housing Near Niceville/Valparaiso (1 reply) |
| Help with Neighborhoods Within an Hour of Tampa Airport but Close to the Water (17 replies) |
| Suggestions for move to Eglin Area, Homeowners Ins?? (10 replies) |
| Recommendations on renting near Eglin. (4 replies) |
| New housing developments in Niceville? (43 replies) |
| Relocation to Northwest Florida (25 replies) |
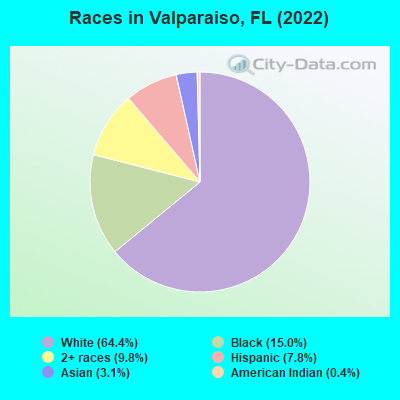
According to 2022 data, the most numerous races in Valparaiso, FL are White alone (3,216 residents), Hispanic (389 residents), and Black alone (747 residents). 94.6% of Valparaiso residents speak English at home. 4.6% of Valparaiso, FL residents are foreign-born (2.1% born in Asia, 1.3% born in Latin America, 0.6% born in Oceania, 0.5% born in Europe), which is 351.9% less than the foreign-born rate of 21.0% across the entire state of Florida.
Race distribution in Valparaiso
2000
2022

- 4,84875.7%White alone
- 6159.6%Black alone
- 5889.2%Hispanic
- 1692.6%Asian alone
- 1362.1%Two or more races
- 370.6%American Indian alone
- 80.1%Other race alone
- 70.1%Native Hawaiian and Other
Pacific Islander alone

-
- 3,21664.4%White alone
- 74715.0%Black alone
- 4899.8%Two or more races
- 3897.8%Hispanic
- 1573.1%Asian alone
- 220.4%American Indian alone
- 20.04%Native Hawaiian and Other
Pacific Islander alone
2000
2022
-
- 10,458,50965.4%White alone
- 2,682,71516.8%Hispanic
- 2,264,26814.2%Black alone
- 261,6931.6%Asian alone
- 236,9541.5%Two or more races
- 42,3580.3%American Indian alone
- 28,9940.2%Other race alone
- 6,8870.04%Native Hawaiian and Other
Pacific Islander alone

-
- 11,309,40350.8%White alone
- 6,025,03927.1%Hispanic
- 3,241,01514.6%Black alone
- 861,6303.9%Two or more races
- 623,6922.8%Asian alone
- 152,0540.7%Other race alone
- 22,5040.1%American Indian alone
- 9,4860.04%Native Hawaiian and Other
Pacific Islander alone

Income and house value in Valparaiso
- Median household income in 2022
- $88,748White non-Hispanic householders
- $74,577Black householders
- $37,714Hispanic or Latino race householders
- Median 2022 house value
- $444,236White Non-Hispanic householders
- $378,115Black or African American householders
- $318,361American Indian or Alaska Native householders
- $373,707Asian householders
- over $1,000,000Some other race householders
- $318,361Hispanic or Latino householders
Household income for White non-Hispanic householders

Household income for Black householders

Household income for Asian householders

Household income for Two or more races householders

Household income for Hispanic or Latino race householders

Median age by race in Valparaiso
- 29.3Median age for White residents
- 28.8Males
- 34.6Females
- 19.9Median age for Black or African American residents
- 20.0Males
- 19.4Females
- -598,566,307.6Median age for American Indian / Alaska Native residents
- -611,418,047.3Males
- -594,925,633.7Females
- 53.4Median age for Asian residents
- 21.4Males
- 61.5Females
- -570,491,802.7Median age for Native Hawaiian / Pacific Islander residents
- -588,888,888.3Males
- -402,088,772.4Females
- 26.0Median age for Other race residents
- 27.3Males
- -613,154,960.4Females
- 21.1Median age for Two or more races residents
- 22.3Males
- 12.4Females
- 29.3Median age for White alone residents
- 29.2Males
- 29.8Females
- 26.5Median age for Hispanic or Latino residents
- 25.3Males
- 36.8Females
Owner/renter occupied households by race in Valparaiso
- House owners and renters - White residents
- 89868.2%Owner occupied
- 41931.8%Renter occupied
- House owners and renters - Black or African American residents
- 5325.8%Owner occupied
- 15474.2%Renter occupied
- House owners and renters - Asian residents
- 4052.0%Owner occupied
- 3748.0%Renter occupied
- House owners and renters - Two or more races residents
- 7343.1%Owner occupied
- 9656.9%Renter occupied
- House owners and renters - White alone residents
- 91172.5%Owner occupied
- 34727.5%Renter occupied
- House owners and renters - Hispanic or Latino residents
- 1816.1%Owner occupied
- 9383.9%Renter occupied
Language usage in Valparaiso
- English speakers - Total
- 94.6% of residents of Valparaiso speak English at home.
- 3.7% of residents speak Spanish at home
- 16491.1%Speak English very well
- 168.9%Speak English less than very well
- 1.8% of residents speak other language at home
- 7382.0%Speak English very well
- 1618.0%Speak English less than very well
- English speakers - Born in the United States
- 97.8% of residents of Valparaiso speak English at home.
- 1.5% of residents speak Spanish at home
- 4489.8%Speak English very well
- 510.2%Speak English less than very well
- 0.9% of residents speak other language at home
- 2275.9%Speak English very well
- 724.1%Speak English less than very well
- English speakers - Native, born elsewhere
- 89.5% of residents of Valparaiso speak English at home.
- 6.8% of residents speak other language at home
- 15100.0%Speak English very well
- English speakers - Foreign-born
- 87.6% of residents of Valparaiso speak English at home.
- 4.1% of residents speak Spanish at home
- 9100.0%Speak English very well
- 15.6% of residents speak other language at home
- 2161.8%Speak English very well
- 1338.2%Speak English less than very well
White (Caucasian) - Speak only English
| Native: | 96.6% (3,159) |
| Foreign-born: | 75.4% (37) |
White (Caucasian) - Speak another language
| Native: | 2.7% (88) |
| Foreign-born: | 20.9% (10) |
Black or African American - Speak only English
| Native: | 99.2% (676) |
| Foreign-born: | 97.0% (46) |
Asian - Speak only English
| Native: | 40.9% (29) |
| Foreign-born: | 78.1% (78) |
Asian - Speak another language
| Native: | 76.5% (54) |
| Foreign-born: | 28.7% (29) |
Other race - Speak another language
| Native: | 9.3% (6) |
| Foreign-born: | 97.3% (21) |
White alone - Speak only English
| Native: | 96.0% (2,961) |
| Foreign-born: | 91.9% (38) |
White alone - Speak another language
| Native: | 3.1% (94) |
| Foreign-born: | 16.7% (7) |
Hispanic or Latino - Speak another language
| Native: | 12.2% (46) |
| Foreign-born: | 94.8% (18) |
Foreign-born residents in Valparaiso
232 residents are foreign born (2.1% Asia, 1.3% Latin America, 0.6% Oceania, 0.5% Europe).
| This city: | 4.6% |
| Florida: | 21.1% |


Marital status for residents in Valparaiso
Marital status - White (Caucasian) population 15 years and over
- Males
- 39.6%Never married
- 47.2%Now married
- 0.8%Separated
- 1.9%Widowed
- 10.6%Divorced
- Females
- 27.2%Never married
- 56.8%Now married
- 0.0%Separated
- 5.9%Widowed
- 10.1%Divorced
Women who gave birth in the past 12 months
| Now married: | 100.0% (12) |
| Unmarried: | 0.0% (0) |
Women who did not give birth in the past 12 months
| Now married: | 43.1% (317) |
| Unmarried: | 56.9% (419) |
Marital status - Black or African American population 15 years and over
- Males
- 77.1%Never married
- 12.2%Now married
- 0.0%Separated
- 0.0%Widowed
- 10.8%Divorced
- Females
- 55.8%Never married
- 17.5%Now married
- 0.0%Separated
- 0.0%Widowed
- 26.6%Divorced
Women who did not give birth in the past 12 months
| Now married: | 17.5% (31) |
| Unmarried: | 82.5% (144) |
Marital status - Asian population 15 years and over
- Males
- 65.5%Never married
- 0.0%Now married
- 0.0%Separated
- 0.0%Widowed
- 34.5%Divorced
- Females
- 4.4%Never married
- 48.9%Now married
- 0.0%Separated
- 25.6%Widowed
- 21.1%Divorced
Women who did not give birth in the past 12 months
| Now married: | 77.8% (14) |
| Unmarried: | 22.2% (4) |
Marital status - Two or more races population 15 years and over
- Males
- 80.7%Never married
- 19.3%Now married
- 0.0%Separated
- 0.0%Widowed
- 0.0%Divorced
- Females
- 36.8%Never married
- 63.2%Now married
- 0.0%Separated
- 0.0%Widowed
- 0.0%Divorced
Women who did not give birth in the past 12 months
| Now married: | 45.3% (31) |
| Unmarried: | 54.7% (37) |
Marital status - White alone, not Hispanic / Latino population 15 years and over
- Males
- 38.0%Never married
- 48.1%Now married
- 0.8%Separated
- 1.9%Widowed
- 11.1%Divorced
- Females
- 29.4%Never married
- 60.5%Now married
- 0.0%Separated
- 2.6%Widowed
- 7.6%Divorced
Women who gave birth in the past 12 months
| Now married: | 100.0% (12) |
| Unmarried: | 0.0% (0) |
Women who did not give birth in the past 12 months
| Now married: | 48.8% (319) |
| Unmarried: | 51.2% (335) |
Marital status - Hispanic or Latino population 15 years and over
- Males
- 80.4%Never married
- 19.6%Now married
- 0.0%Separated
- 0.0%Widowed
- 0.0%Divorced
- Females
- 21.0%Never married
- 9.7%Now married
- 0.0%Separated
- 37.1%Widowed
- 32.3%Divorced
Women who did not give birth in the past 12 months
| Now married: | 0.0% (0) |
| Unmarried: | 100.0% (118) |
Ancestries in Valparaiso

- 2139.0%American
- 1928.1%English
- 1657.0%Polish
- 1596.7%Irish
- 1134.8%European
- 1114.7%German
- 883.7%French
- 713.0%Swedish
- 482.0%Scandinavian
- 371.6%British
- 331.4%Jamaican
- 331.4%West Indian
- 311.3%Eastern European
- 231.0%Norwegian
- 160.7%Finnish
- 140.6%Scotch-Irish
- 20.08%Albanian

Geographical mobility in Valparaiso

- Same house 1 year ago
- 2,71479.2%White (Caucasian)
- 57774.9%Black or African American
- 936.4%American Indian / Alaska Native
- 15985.8%Asian
- 88.2%Other race
- 16631.4%Two or more races
- 2,51677.9%White alone, not Hispanic / Latino
- 31381.3%Hispanic or Latino

-
- Moved within same county
- 1444.2%White / Caucasian
- 243.2%Black or African American
- 22743.1%Two or more races
- 1474.5%White alone, not Hispanic / Latino

-
- Moved within same state
- 1715.0%White / Caucasian
- 17622.9%Black or African American
- 6865.6%Other race
- 10920.7%Two or more races
- 1755.4%White alone, not Hispanic / Latino
- 5815.2%Hispanic or Latino

-
- Moved from different state
- 38411.2%White / Caucasian
- 1350.7%American Indian / Alaska Native
- 2815.2%Asian
- 2726.2%Other race
- 6512.4%Two or more races
- 37611.7%White alone, not Hispanic / Latino
- 215.3%Hispanic or Latino

-
- Moved from abroad
- 30.1%White
- 9100.0%Native Hawaiian / Pacific Islander
- 20.6%Hispanic or Latino

Children Nativity (place of birth) in Valparaiso
Place of birth for residents in Valparaiso
![Place of birth for the foreign-born population - Regions]()
- 107Asia
- 67Americas
- 67Latin America
- 55South Central Asia
- 48Caribbean
- 36South Eastern Asia
- 32Oceania
- 32Australia and New Zealand Subregion
- 25Europe
- 18South America
- 14Eastern Asia
- 13Northern Europe
- 11Western Europe

![Place of birth for the foreign-born population - Countries]()
- 55India
- 32Australia
- 20Vietnam
- 16Philippines
- 15Jamaica
- 14Korea
- 13England
- 12Ecuador
- 11Germany
- 6Colombia

Zip codes: 32580.