Races in Upland, California (CA) Detailed Stats
Data:
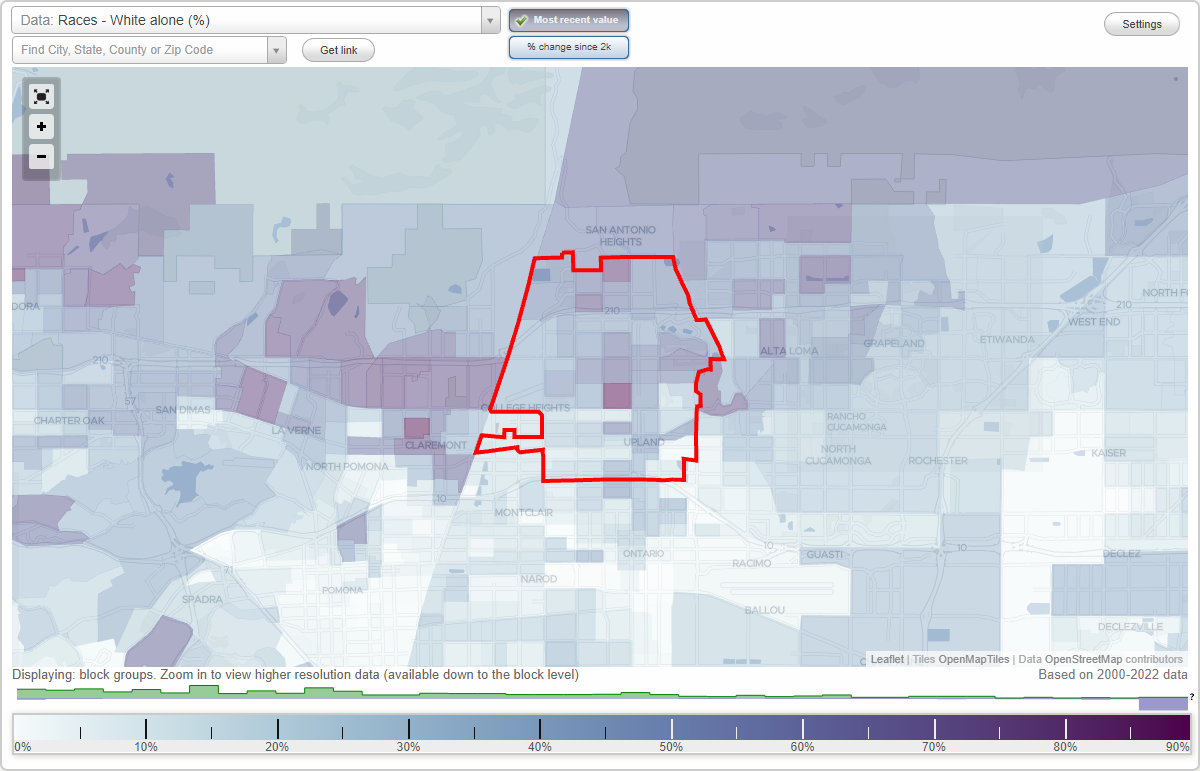
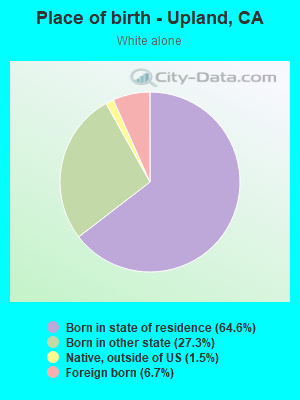
Races - White alone (%)
Races - White alone (% change since 2000)
Races - Black alone (%)
Races - Black alone (% change since 2000)
Races - American Indian alone (%)
Races - American Indian alone (% change since 2000)
Races - Asian alone (%)
Races - Asian alone (% change since 2000)
Races - Hispanic (%)
Races - Hispanic (% change since 2000)
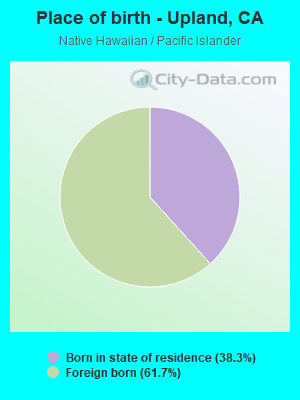
Races - Native Hawaiian and Other Pacific Islander alone (%)
Races - Native Hawaiian and Other Pacific Islander alone (% change since 2000)
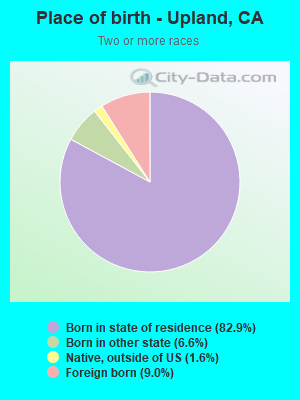
Races - Two or more races(%)
Races - Two or more races(% change since 2000)
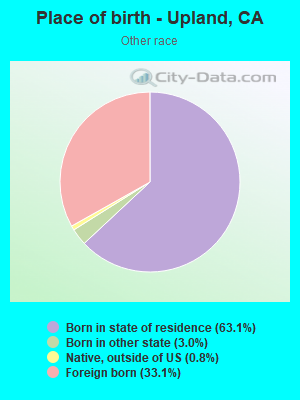
Races - Other race alone (%)
Races - Other race alone (% change since 2000)
Racial diversity
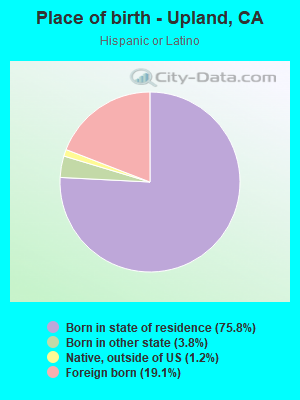
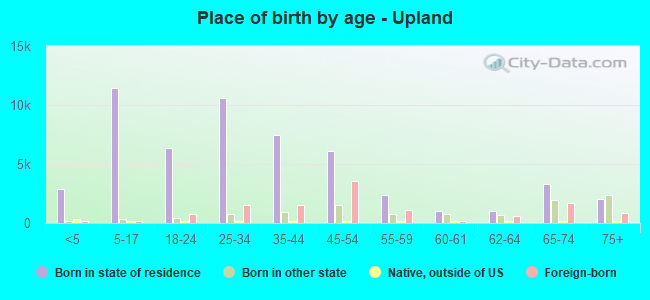
Place of birth - Born in state of residence (%)
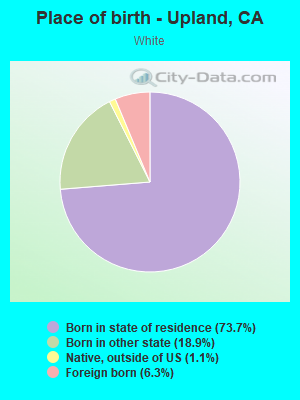
Place of birth - Born in state of residence (%) - White
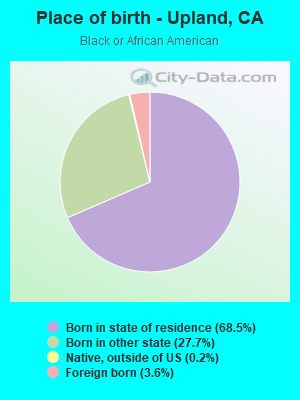
Place of birth - Born in state of residence (%) - Black or African American
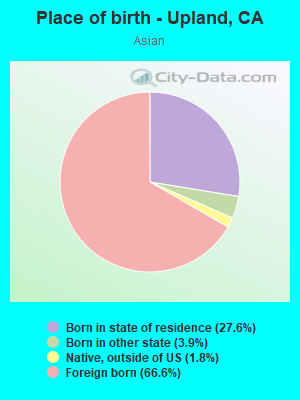
Place of birth - Born in state of residence (%) - Asian
Place of birth - Born in state of residence (%) - Hispanic or Latino
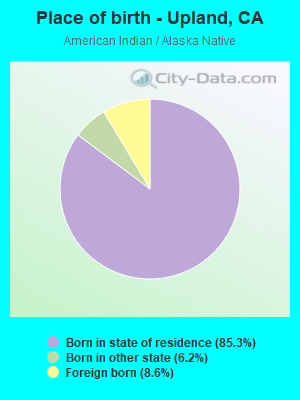
Place of birth - Born in state of residence (%) - American Indian and Alaska Native
Place of birth - Born in state of residence (%) - Multirace
Place of birth - Born in state of residence (%) - Other Race
Place of birth - Born in other state (%)
Place of birth - Born in other state (%) - White
Place of birth - Born in other state (%) - Black or African American
Place of birth - Born in other state (%) - Asian
Place of birth - Born in other state (%) - Hispanic or Latino
Place of birth - Born in other state (%) - American Indian and Alaska Native
Place of birth - Born in other state (%) - Multirace
Place of birth - Born in other state (%) - Other Race
Place of birth - Native, outside of US (%)
Place of birth - Native, outside of US (%) - White
Place of birth - Native, outside of US (%) - Black or African American
Place of birth - Native, outside of US (%) - Asian
Place of birth - Native, outside of US (%) - Hispanic or Latino
Place of birth - Native, outside of US (%) - American Indian and Alaska Native
Place of birth - Native, outside of US (%) - Multirace
Place of birth - Native, outside of US (%) - Other Race
Place of birth - Foreign born (%)
Place of birth - Foreign born (%) - White
Place of birth - Foreign born (%) - Black or African American
Place of birth - Foreign born (%) - Asian
Place of birth - Foreign born (%) - Hispanic or Latino
Place of birth - Foreign born (%) - American Indian and Alaska Native
Place of birth - Foreign born (%) - Multirace
Place of birth - Foreign born (%) - Other Race
Residents speaking English at home (%)
Residents speaking English at home - Born in the United States (%)
Residents speaking English at home - Native, born elsewhere (%)
Residents speaking English at home - Foreign born (%)
Residents speaking Spanish at home (%)
Residents speaking Spanish at home - Born in the United States (%)
Residents speaking Spanish at home - Native, born elsewhere (%)
Residents speaking Spanish at home - Foreign born (%)
Residents speaking other language at home (%)
Residents speaking other language at home - Born in the United States (%)
Residents speaking other language at home - Native, born elsewhere (%)
Residents speaking other language at home - Foreign born (%)
Marital status - Never married (%)
Marital status - Now married (%)
Marital status - Separated (%)
Marital status - Widowed (%)
Marital status - Divorced (%)
Ancestries Reported - Arab (%)
Ancestries Reported - Czech (%)
Ancestries Reported - Danish (%)
Ancestries Reported - Dutch (%)
Ancestries Reported - English (%)
Ancestries Reported - French (%)
Ancestries Reported - French Canadian (%)
Ancestries Reported - German (%)
Ancestries Reported - Greek (%)
Ancestries Reported - Hungarian (%)
Ancestries Reported - Irish (%)
Ancestries Reported - Italian (%)
Ancestries Reported - Lithuanian (%)
Ancestries Reported - Norwegian (%)
Ancestries Reported - Polish (%)
Ancestries Reported - Portuguese (%)
Ancestries Reported - Russian (%)
Ancestries Reported - Scotch-Irish (%)
Ancestries Reported - Scottish (%)
Ancestries Reported - Slovak (%)
Ancestries Reported - Subsaharan African (%)
Ancestries Reported - Swedish (%)
Ancestries Reported - Swiss (%)
Ancestries Reported - Ukrainian (%)
Ancestries Reported - United States (%)
Ancestries Reported - Welsh (%)
Ancestries Reported - West Indian (%)
Ancestries Reported - Other (%)
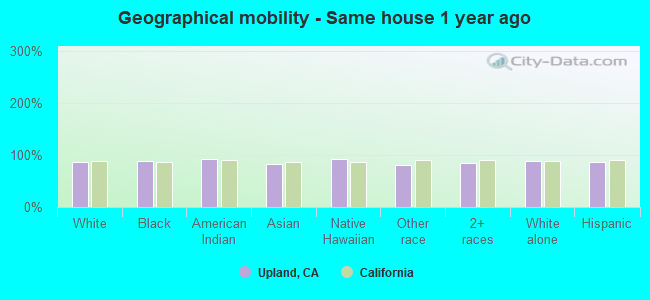
Geographical mobility - Same house 1 year ago (%)
Geographical mobility - Same house 1 year ago (%) - White
Geographical mobility - Same house 1 year ago (%) - Black or African American
Geographical mobility - Same house 1 year ago (%) - Asian
Geographical mobility - Same house 1 year ago (%) - Hispanic or Latino
Geographical mobility - Same house 1 year ago (%) - American Indian and Alaska Native
Geographical mobility - Same house 1 year ago (%) - Multirace
Geographical mobility - Same house 1 year ago (%) - Other Race
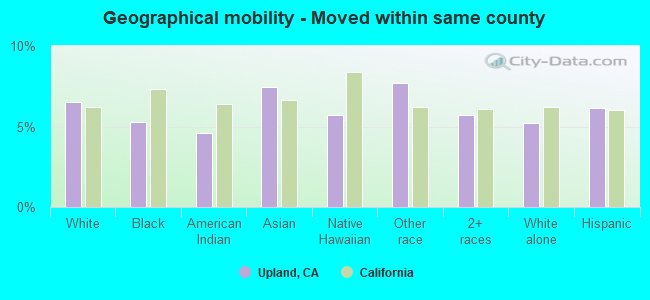
Geographical mobility - Moved within same county (%)
Geographical mobility - Moved within same county (%) - White
Geographical mobility - Moved within same county (%) - Black or African American
Geographical mobility - Moved within same county (%) - Asian
Geographical mobility - Moved within same county (%) - Hispanic or Latino
Geographical mobility - Moved within same county (%) - American Indian and Alaska Native
Geographical mobility - Moved within same county (%) - Multirace
Geographical mobility - Moved within same county (%) - Other Race
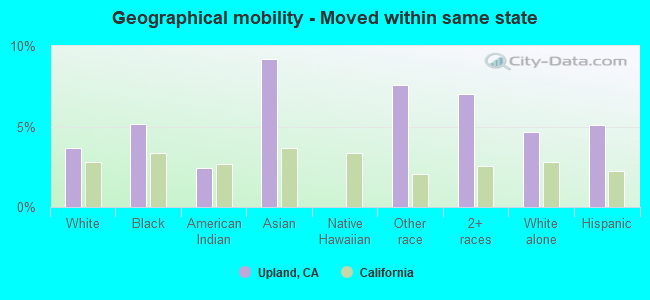
Geographical mobility - Moved from different county within same state (%)
Geographical mobility - Moved from different county within same state (%) - White
Geographical mobility - Moved from different county within same state (%) - Black or African American
Geographical mobility - Moved from different county within same state (%) - Asian
Geographical mobility - Moved from different county within same state (%) - Hispanic or Latino
Geographical mobility - Moved from different county within same state (%) - American Indian and Alaska Native
Geographical mobility - Moved from different county within same state (%) - Multirace
Geographical mobility - Moved from different county within same state (%) - Other Race
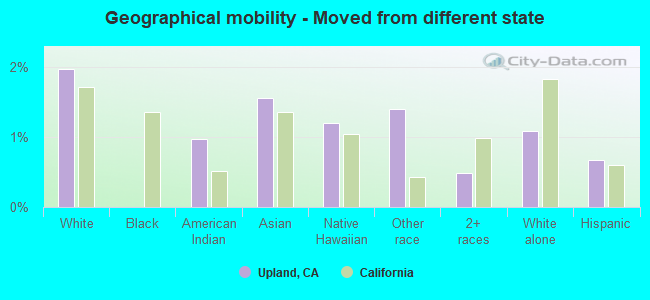
Geographical mobility - Moved from different state (%)
Geographical mobility - Moved from different state (%) - White
Geographical mobility - Moved from different state (%) - Black or African American
Geographical mobility - Moved from different state (%) - Asian
Geographical mobility - Moved from different state (%) - Hispanic or Latino
Geographical mobility - Moved from different state (%) - American Indian and Alaska Native
Geographical mobility - Moved from different state (%) - Multirace
Geographical mobility - Moved from different state (%) - Other Race
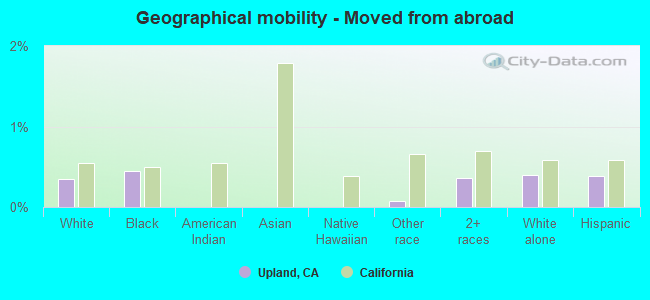
Geographical mobility - Moved from abroad (%)
Geographical mobility - Moved from abroad (%) - White
Geographical mobility - Moved from abroad (%) - Black or African American
Geographical mobility - Moved from abroad (%) - Asian
Geographical mobility - Moved from abroad (%) - Hispanic or Latino
Geographical mobility - Moved from abroad (%) - American Indian and Alaska Native
Geographical mobility - Moved from abroad (%) - Multirace
Geographical mobility - Moved from abroad (%) - Other Race
Place of birth for the foreign-born population - Ireland (%)
Place of birth for the foreign-born population - Denmark (%)
Place of birth for the foreign-born population - Norway (%)
Place of birth for the foreign-born population - Sweden (%)
Place of birth for the foreign-born population - United Kingdom (%)
Place of birth for the foreign-born population - England (%)
Place of birth for the foreign-born population - Scotland (%)
Place of birth for the foreign-born population - Other Northern Europe (%)
Place of birth for the foreign-born population - Austria (%)
Place of birth for the foreign-born population - Belgium (%)
Place of birth for the foreign-born population - France (%)
Place of birth for the foreign-born population - Germany (%)
Place of birth for the foreign-born population - Netherlands (%)
Place of birth for the foreign-born population - Switzerland (%)
Place of birth for the foreign-born population - Other Western Europe (%)
Place of birth for the foreign-born population - Greece (%)
Place of birth for the foreign-born population - Italy (%)
Place of birth for the foreign-born population - Portugal (%)
Place of birth for the foreign-born population - Spain (%)
Place of birth for the foreign-born population - Other Southern Europe (%)
Place of birth for the foreign-born population - Albania (%)
Place of birth for the foreign-born population - Belarus (%)
Place of birth for the foreign-born population - Bosnia and Herzegovina (%)
Place of birth for the foreign-born population - Bulgaria (%)
Place of birth for the foreign-born population - Croatia (%)
Place of birth for the foreign-born population - Czechoslovakia (%)
Place of birth for the foreign-born population - Hungary (%)
Place of birth for the foreign-born population - Latvia (%)
Place of birth for the foreign-born population - Lithuania (%)
Place of birth for the foreign-born population - North Macedonia (Macedonia) (%)
Place of birth for the foreign-born population - Moldova (%)
Place of birth for the foreign-born population - Poland (%)
Place of birth for the foreign-born population - Romania (%)
Place of birth for the foreign-born population - Russia (%)
Place of birth for the foreign-born population - Serbia (%)
Place of birth for the foreign-born population - Ukraine (%)
Place of birth for the foreign-born population - Other Eastern Europe (%)
Place of birth for the foreign-born population - China (%)
Place of birth for the foreign-born population - Hong Kong (%)
Place of birth for the foreign-born population - Taiwan (%)
Place of birth for the foreign-born population - Japan (%)
Place of birth for the foreign-born population - Korea (%)
Place of birth for the foreign-born population - Other Eastern Asia (%)
Place of birth for the foreign-born population - Afghanistan (%)
Place of birth for the foreign-born population - Bangladesh (%)
Place of birth for the foreign-born population - India (%)
Place of birth for the foreign-born population - Iran (%)
Place of birth for the foreign-born population - Kazakhstan (%)
Place of birth for the foreign-born population - Nepal (%)
Place of birth for the foreign-born population - Pakistan (%)
Place of birth for the foreign-born population - Sri Lanka (%)
Place of birth for the foreign-born population - Uzbekistan (%)
Place of birth for the foreign-born population - Other South Central Asia (%)
Place of birth for the foreign-born population - Burma (%)
Place of birth for the foreign-born population - Cambodia (%)
Place of birth for the foreign-born population - Indonesia (%)
Place of birth for the foreign-born population - Laos (%)
Place of birth for the foreign-born population - Malaysia (%)
Place of birth for the foreign-born population - Philippines (%)
Place of birth for the foreign-born population - Singapore (%)
Place of birth for the foreign-born population - Thailand (%)
Place of birth for the foreign-born population - Vietnam (%)
Place of birth for the foreign-born population - Other South Eastern Asia (%)
Place of birth for the foreign-born population - Armenia (%)
Place of birth for the foreign-born population - Iraq (%)
Place of birth for the foreign-born population - Israel (%)
Place of birth for the foreign-born population - Jordan (%)
Place of birth for the foreign-born population - Kuwait (%)
Place of birth for the foreign-born population - Lebanon (%)
Place of birth for the foreign-born population - Saudi Arabia (%)
Place of birth for the foreign-born population - Syria (%)
Place of birth for the foreign-born population - Turkey (%)
Place of birth for the foreign-born population - Yemen (%)
Place of birth for the foreign-born population - Other Western Asia (%)
Place of birth for the foreign-born population - Eritrea (%)
Place of birth for the foreign-born population - Ethiopia (%)
Place of birth for the foreign-born population - Kenya (%)
Place of birth for the foreign-born population - Somalia (%)
Place of birth for the foreign-born population - Uganda (%)
Place of birth for the foreign-born population - Zimbabwe (%)
Place of birth for the foreign-born population - Other Eastern Africa (%)
Place of birth for the foreign-born population - Cameroon (%)
Place of birth for the foreign-born population - Congo (%)
Place of birth for the foreign-born population - Democratic Republic of Congo (Zaire) (%)
Place of birth for the foreign-born population - Other Middle Africa (%)
Place of birth for the foreign-born population - Egypt (%)
Place of birth for the foreign-born population - Morocco (%)
Place of birth for the foreign-born population - Sudan (%)
Place of birth for the foreign-born population - Other Northern Africa (%)
Place of birth for the foreign-born population - South Africa (%)
Place of birth for the foreign-born population - Other Southern Africa (%)
Place of birth for the foreign-born population - Cabo Verde (%)
Place of birth for the foreign-born population - Ghana (%)
Place of birth for the foreign-born population - Liberia (%)
Place of birth for the foreign-born population - Nigeria (%)
Place of birth for the foreign-born population - Senegal (%)
Place of birth for the foreign-born population - Sierra Leone (%)
Place of birth for the foreign-born population - Other Western Africa (%)
Place of birth for the foreign-born population - Australia (%)
Place of birth for the foreign-born population - New Zealand (%)
Place of birth for the foreign-born population - Fiji (%)
Place of birth for the foreign-born population - Micronesia (%)
Place of birth for the foreign-born population - Bahamas (%)
Place of birth for the foreign-born population - Barbados (%)
Place of birth for the foreign-born population - Cuba (%)
Place of birth for the foreign-born population - Dominica (%)
Place of birth for the foreign-born population - Dominican Republic (%)
Place of birth for the foreign-born population - Grenada (%)
Place of birth for the foreign-born population - Haiti (%)
Place of birth for the foreign-born population - Jamaica (%)
Place of birth for the foreign-born population - St. Vincent and the Grenadines (%)
Place of birth for the foreign-born population - Trinidad and Tobago (%)
Place of birth for the foreign-born population - West Indies (%)
Place of birth for the foreign-born population - Other Caribbean (%)
Place of birth for the foreign-born population - Belize (%)
Place of birth for the foreign-born population - Costa Rica (%)
Place of birth for the foreign-born population - El Salvador (%)
Place of birth for the foreign-born population - Guatemala (%)
Place of birth for the foreign-born population - Honduras (%)
Place of birth for the foreign-born population - Mexico (%)
Place of birth for the foreign-born population - Nicaragua (%)
Place of birth for the foreign-born population - Panama (%)
Place of birth for the foreign-born population - Other Central America (%)
Place of birth for the foreign-born population - Argentina (%)
Place of birth for the foreign-born population - Bolivia (%)
Place of birth for the foreign-born population - Brazil (%)
Place of birth for the foreign-born population - Chile (%)
Place of birth for the foreign-born population - Colombia (%)
Place of birth for the foreign-born population - Ecuador (%)
Place of birth for the foreign-born population - Guyana (%)
Place of birth for the foreign-born population - Peru (%)
Place of birth for the foreign-born population - Uruguay (%)
Place of birth for the foreign-born population - Venezuela (%)
Place of birth for the foreign-born population - Other South America (%)
Place of birth for the foreign-born population - Canada (%)
Place of birth for the foreign-born population - Other Northern America (%)
Place of birth for the foreign-born population - Other (%)
Latest news about races in Upland, CA collected exclusively by city-data.com from local newspapers, TV, and radio stations
According to 2022 data, the most numerous races in Upland, CA are Hispanic (35,135 residents), White alone (25,902 residents), and Asian alone (7,084 residents). 67.7% of Upland residents speak English at home. 18.1% of Upland, CA residents are foreign-born (9.0% born in Latin America, 7.2% born in Asia), which is 43.7% less than the foreign-born rate of 26.0% across the entire state of California.
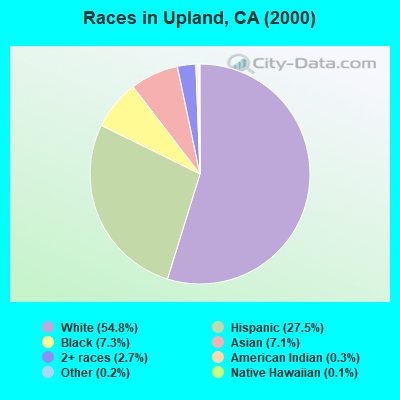
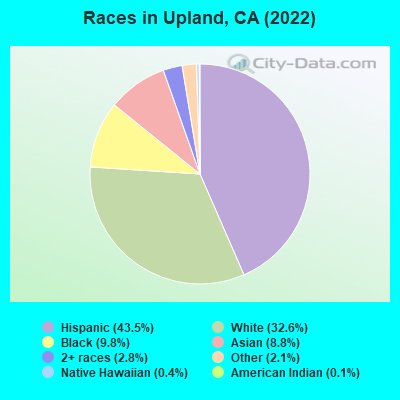
Race distribution in Upland
2000 2022
37,456 54.8% White alone 18,830 27.5% Hispanic 4,990 7.3% Black alone 4,866 7.1% Asian alone 1,826 2.7% Two or more races 238 0.3% American Indian alone 104 0.2% Other race alone 83 0.1% Native Hawaiian and Other
35,135 45.5% Hispanic 25,902 33.5% White alone 7,084 9.2% Asian alone 5,426 7.0% Black alone 2,928 3.8% Two or more races 603 0.8% Other race alone 178 0.2% American Indian alone 55 0.07% Native Hawaiian and Other
2000 2022
15,816,790 46.7% White alone 10,966,556 32.4% Hispanic 3,648,860 10.8% Asian alone 2,181,926 6.4% Black alone 903,115 2.7% Two or more races 178,984 0.5% American Indian alone 103,736 0.3% Native Hawaiian and Other 71,681 0.2% Other race alone
15,732,184 40.3% Hispanic 13,160,426 33.7% White alone 5,957,867 15.3% Asian alone 2,025,218 5.2% Black alone 1,663,222 4.3% Two or more races 251,618 0.6% Other race alone 135,777 0.3% Native Hawaiian and Other 103,030 0.3% American Indian alone
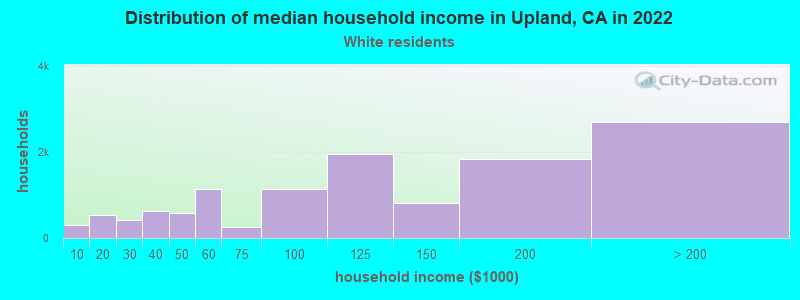
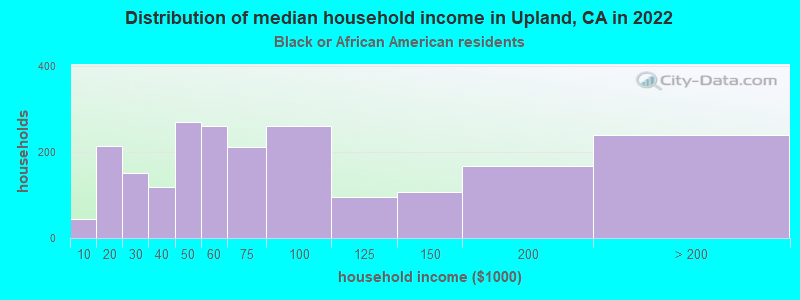
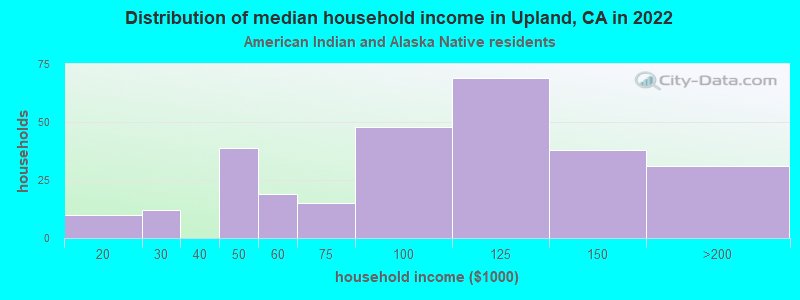
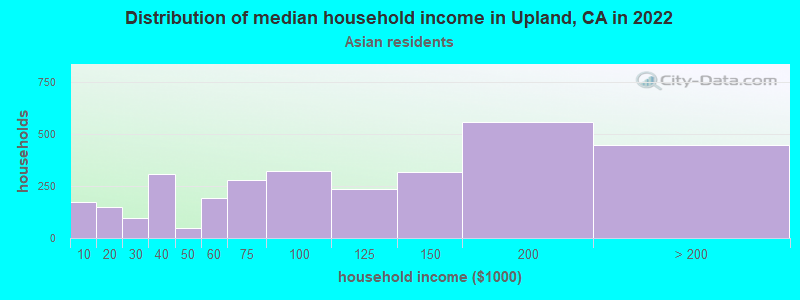
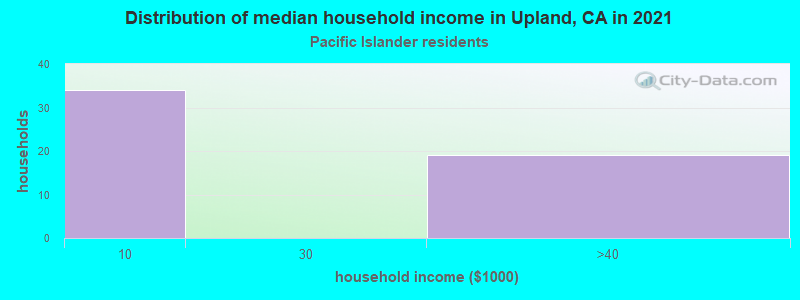
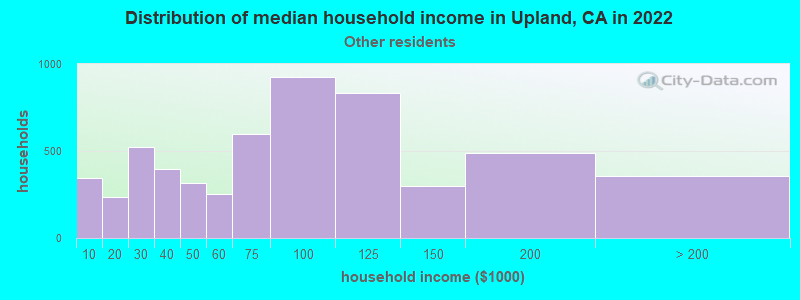
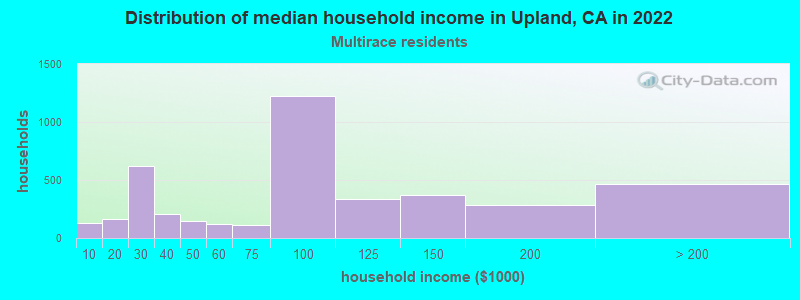
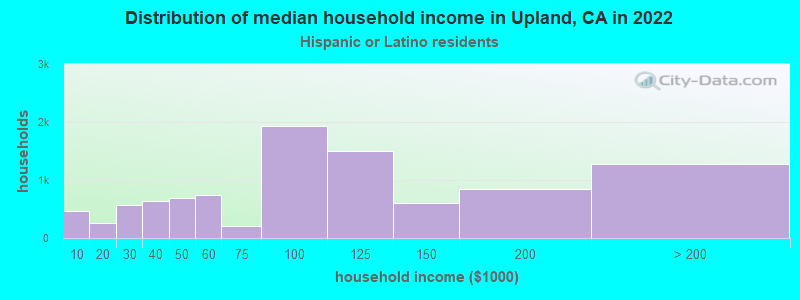
Income and house value in Upland Median household income in 2022 $112,833 White non-Hispanic householders$69,875 Black householders$115,407 American Indian and Alaska Native householders$87,408 Asian householdersover $200,000 Native Hawaiian and other Pacific Islander householders$105,086 Some other race householders$73,240 Two or more races householders$104,868 Hispanic or Latino race householdersMedian 2022 house value $783,206 White Non-Hispanic householders$741,814 Black or African American householders$750,813 American Indian or Alaska Native householders $862,751 Asian householders$637,435 Native Hawaiian and other Pacific Islander householders$557,530 Some other race householders$614,039 Two or more races householders$625,197 Hispanic or Latino householders
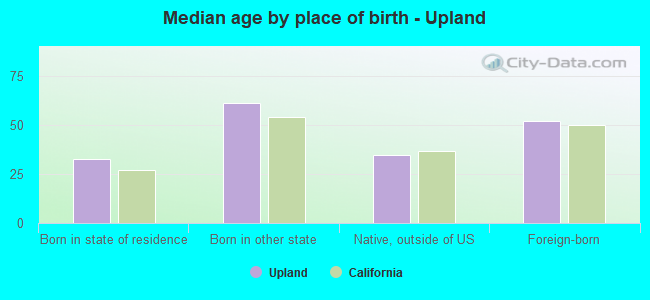
Median age by race in Upland
41.9 Median age for White residents40.0 43.6 49.1 Median age for Black or African American residents45.0 53.1 53.0 Median age for American Indian / Alaska Native residents39.2 Median age for Asian residents35.3 40.2 54.1 Median age for Native Hawaiian / Pacific Islander residents33.8 Median age for Other race residents33.6 34.0 26.6 Median age for Two or more races residents26.8 25.8 46.7 Median age for White alone residents43.1 50.1 32.6 Median age for Hispanic or Latino residents30.1 32.8
Owner/renter occupied households by race in Upland
House owners and renters - White residents 9,580 66.6% Owner occupied4,807 33.4% Renter occupiedHouse owners and renters - Black or African American residents 897 31.2% Owner occupied1,975 68.8% Renter occupiedHouse owners and renters - American Indian / Alaska Native residents 132 39.8% Owner occupied201 60.2% Renter occupiedHouse owners and renters - Asian residents 1,550 59.1% Owner occupied1,071 40.9% Renter occupiedHouse owners and renters - Native Hawaiian / Pacific Islander residents 6 18.3% Owner occupied27 81.7% Renter occupiedHouse owners and renters - Other race residents 1,165 29.5% Owner occupied2,783 70.5% Renter occupiedHouse owners and renters - Two or more races residents 1,464 61.9% Owner occupied900 38.1% Renter occupiedHouse owners and renters - White alone residents 7,667 70.6% Owner occupied3,197 29.4% Renter occupiedHouse owners and renters - Hispanic or Latino residents 4,208 43.1% Owner occupied5,559 56.9% Renter occupied
Language usage in Upland
English speakers - Total 67.7% of residents of Upland speak English at home.
22.2% of residents speak Spanish at home 11,116 69.0% Speak English very well5,002 31.0% Speak English less than very well10.3% of residents speak other language at home 4,275 57.2% Speak English very well3,199 42.8% Speak English less than very well
English speakers - Born in the United States 91.2% of residents of Upland speak English at home.
6.0% of residents speak Spanish at home 486 74.1% Speak English very well170 25.9% Speak English less than very well2.6% of residents speak other language at home 265 92.3% Speak English very well22 7.7% Speak English less than very well
English speakers - Native, born elsewhere 50.6% of residents of Upland speak English at home.
27.0% of residents speak Spanish at home 186 76.2% Speak English very well58 23.8% Speak English less than very well22.0% of residents speak other language at home 199 100.0% Speak English very well
English speakers - Foreign-born 15.0% of residents of Upland speak English at home.
42.9% of residents speak Spanish at home 2,113 35.9% Speak English very well3,775 64.1% Speak English less than very well42.6% of residents speak other language at home 2,732 46.7% Speak English very well3,114 53.3% Speak English less than very well
White (Caucasian) - Speak only English Native:
93.5% (31,525)Foreign-born:
41.5% (966)
White (Caucasian) - Speak another language Native:
9.1% (3,068)Foreign-born:
65.6% (1,529)
Black or African American - Speak only English Native:
96.4% (3,947)Foreign-born:
36.2% (58)
Black or African American - Speak another language Native:
3.4% (137)Foreign-born:
59.7% (96)
American Indian / Alaska Native - Speak another language Native:
62.2% (339)Foreign-born:
98.2% (57)
Asian - Speak only English Native:
70.7% (1,696)Foreign-born:
8.9% (397)
Asian - Speak another language Native:
30.2% (725)Foreign-born:
90.9% (4,065)
Native Hawaiian / Pacific Islander - Speak only English Native:
90.6% (38)Foreign-born:
38.6% (38)
Native Hawaiian / Pacific Islander - Speak another language Native:
13.3% (6)Foreign-born:
51.9% (51)
Other race - Speak only English Native:
73.6% (7,698)Foreign-born:
27.7% (1,056)
Other race - Speak another language Native:
32.0% (3,348)Foreign-born:
78.9% (3,015)
Two or more races - Speak only English Native:
65.3% (6,573)Foreign-born:
35.8% (461)
Two or more races - Speak another language Native:
32.2% (3,245)Foreign-born:
47.1% (605)
White alone - Speak only English Native:
96.2% (23,304)Foreign-born:
73.7% (828)
White alone - Speak another language Native:
3.7% (899)Foreign-born:
25.4% (286)
Hispanic or Latino - Speak only English Native:
74.2% (21,035)Foreign-born:
21.1% (1,163)
Hispanic or Latino - Speak another language Native:
28.4% (8,044)Foreign-born:
83.0% (4,580)
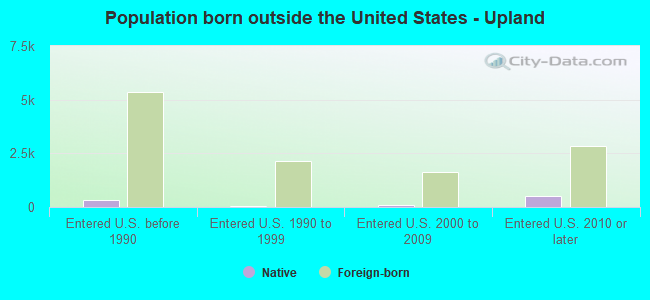
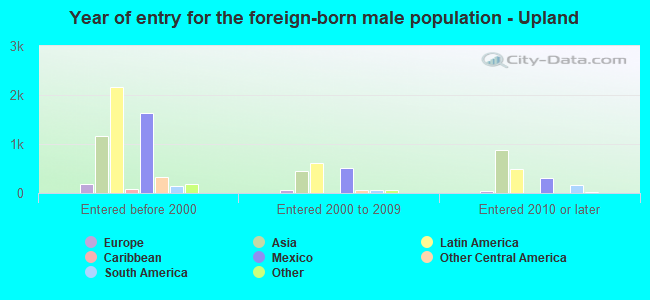
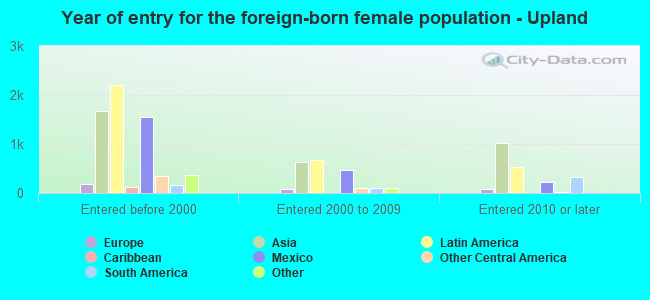
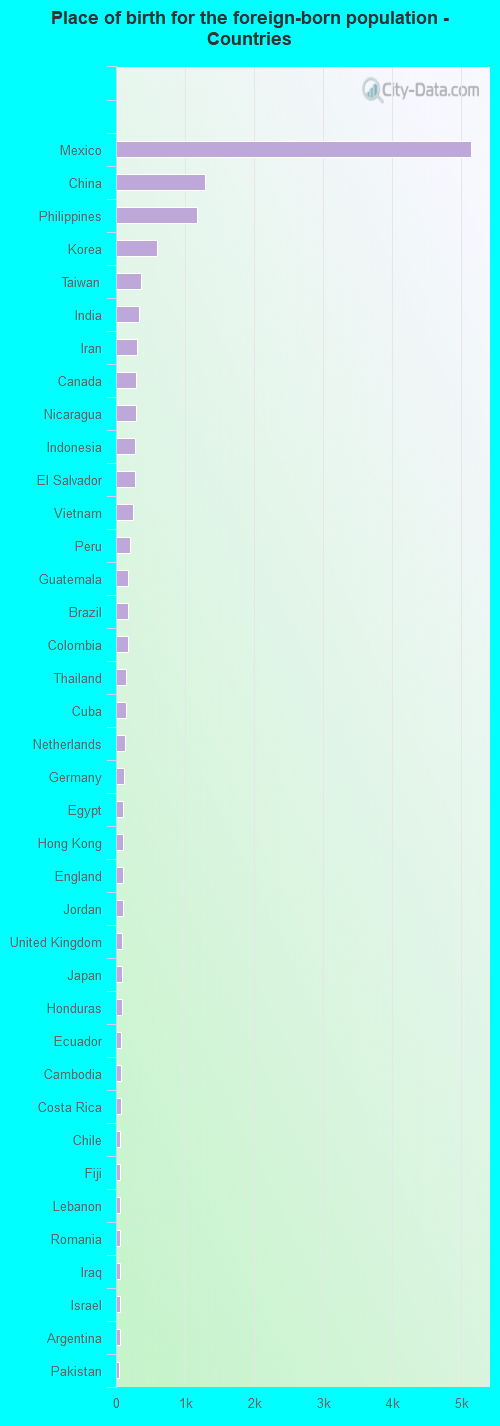
Foreign-born residents in Upland 14,080 residents are foreign born (9.0% Latin America , 7.2% Asia ).
This city:
18.1%California:
100.0%
Marital status for residents in Upland Marital status - White (Caucasian) population 15 years and over
Males 37.5% Never married51.3% Now married0.3% Separated3.3% Widowed7.8% DivorcedFemales 36.0% Never married40.5% Now married1.8% Separated7.2% Widowed14.5% DivorcedWomen who gave birth in the past 12 months Now married:
75.7% (151)Unmarried:
24.3% (48)
Women who did not give birth in the past 12 months Now married:
29.8% (2,701)Unmarried:
70.2% (6,349)
Marital status - Black or African American population 15 years and over
Males 54.0% Never married33.8% Now married5.2% Separated1.0% Widowed6.1% DivorcedFemales 44.2% Never married30.4% Now married2.2% Separated3.0% Widowed20.2% DivorcedWomen who gave birth in the past 12 months Now married:
100.0% (24)Unmarried:
0.0% (0)
Women who did not give birth in the past 12 months Now married:
29.4% (250)Unmarried:
70.6% (600)
Marital status - American Indian / Alaska Native population 15 years and over
Males 43.5% Never married56.5% Now married0.0% Separated0.0% Widowed0.0% DivorcedFemales 28.2% Never married50.2% Now married0.0% Separated3.1% Widowed18.5% DivorcedWomen who gave birth in the past 12 months Now married:
0.0% (0)Unmarried:
100.0% (41)
Women who did not give birth in the past 12 months Now married:
59.4% (142)Unmarried:
40.6% (97)
Marital status - Asian population 15 years and over
Males 39.5% Never married53.3% Now married2.5% Separated2.8% Widowed1.9% DivorcedFemales 29.7% Never married51.7% Now married0.0% Separated5.4% Widowed13.1% DivorcedWomen who gave birth in the past 12 months Now married:
64.9% (39)Unmarried:
35.1% (21)
Women who did not give birth in the past 12 months Now married:
45.6% (979)Unmarried:
54.4% (1,167)
Marital status - Native Hawaiian / Pacific Islander population 15 years and over
Males 83.8% Never married16.2% Now married0.0% Separated0.0% Widowed0.0% DivorcedFemales 100.0% Never married0.0% Now married0.0% Separated0.0% Widowed0.0% DivorcedWomen who did not give birth in the past 12 months Now married:
0.0% (0)Unmarried:
100.0% (57)
Marital status - Other race population 15 years and over
Males 30.2% Never married52.3% Now married7.7% Separated1.2% Widowed8.6% DivorcedFemales 39.5% Never married52.2% Now married0.0% Separated1.4% Widowed6.9% DivorcedWomen who gave birth in the past 12 months Now married:
31.1% (46)Unmarried:
68.9% (101)
Women who did not give birth in the past 12 months Now married:
47.0% (1,472)Unmarried:
53.0% (1,662)
Marital status - Two or more races population 15 years and over
Males 56.4% Never married36.5% Now married0.0% Separated1.6% Widowed5.5% DivorcedFemales 42.8% Never married31.9% Now married1.7% Separated10.5% Widowed13.0% DivorcedWomen who gave birth in the past 12 months Now married:
76.0% (60)Unmarried:
24.0% (19)
Women who did not give birth in the past 12 months Now married:
33.6% (951)Unmarried:
66.4% (1,884)
Marital status - White alone, not Hispanic / Latino population 15 years and over
Males 34.2% Never married52.0% Now married0.0% Separated3.9% Widowed9.8% DivorcedFemales 29.0% Never married45.2% Now married3.0% Separated9.5% Widowed13.3% DivorcedWomen who gave birth in the past 12 months Now married:
69.3% (130)Unmarried:
30.7% (58)
Women who did not give birth in the past 12 months Now married:
35.3% (1,926)Unmarried:
64.7% (3,524)
Marital status - Hispanic or Latino population 15 years and over
Males 42.3% Never married46.9% Now married3.8% Separated1.4% Widowed5.5% DivorcedFemales 45.7% Never married37.4% Now married0.0% Separated2.6% Widowed14.3% DivorcedWomen who gave birth in the past 12 months Now married:
41.1% (54)Unmarried:
58.9% (77)
Women who did not give birth in the past 12 months Now married:
28.5% (3,075)Unmarried:
71.5% (7,699)
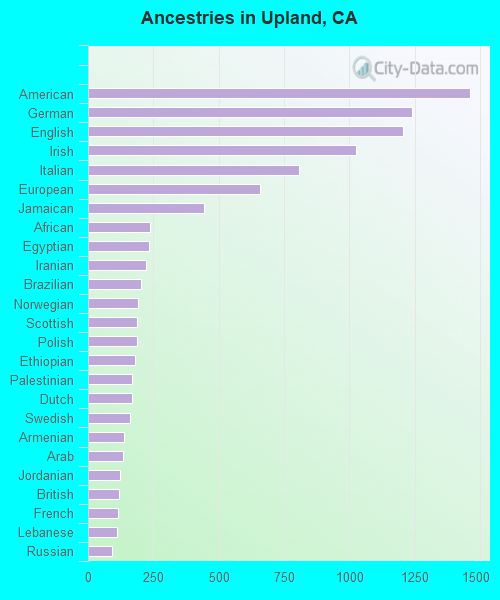
Ancestries in Upland
3,510 8.2% American1,592 3.7% English1,327 3.1% German937 2.2% Italian831 1.9% European733 1.7% Irish289 0.7% Iranian275 0.6% Norwegian249 0.6% British235 0.5% Scottish219 0.5% Polish186 0.4% Armenian179 0.4% Swedish175 0.4% Dutch172 0.4% Brazilian168 0.4% Eastern European164 0.4% Lebanese155 0.4% Jordanian148 0.3% Egyptian142 0.3% African135 0.3% French Canadian133 0.3% Greek108 0.3% Northern European107 0.2% Russian103 0.2% Jamaican100 0.2% French84 0.2% Iraqi81 0.2% Scandinavian75 0.2% Syrian67 0.2% Portuguese62 0.1% Canadian57 0.1% Arab52 0.1% Romanian49 0.1% Palestinian49 0.1% Liberian46 0.1% Scotch-Irish45 0.1% Sierra Leonean42 0.10% Ethiopian37 0.09% South African35 0.08% Swiss33 0.08% Celtic33 0.08% Welsh32 0.07% Trinidadian and Tobagonian30 0.07% Hungarian30 0.07% Turkish28 0.07% Moroccan27 0.06% Ukrainian23 0.05% Czech23 0.05% Kenyan21 0.05% Australian19 0.04% Serbian17 0.04% Lithuanian16 0.04% Croatian11 0.03% Icelander11 0.03% Danish10 0.02% Nigerian9 0.02% Israeli8 0.02% Austrian8 0.02% Basque6 0.01% Czechoslovakian5 0.01% New Zealander5 0.01% Yugoslavian4 0.01% Latvian
Geographical mobility in Upland Same house 1 year ago 31,772 87.6% White (Caucasian)3,883 88.1% Black or African American702 92.2% American Indian / Alaska Native5,876 82.9% Asian90 92.7% Native Hawaiian / Pacific Islander10,077 81.9% Other race10,834 85.2% Two or more races24,836 89.0% White alone, not Hispanic / Latino29,140 87.7% Hispanic or LatinoMoved within same county 2,373 6.5% White / Caucasian231 5.3% Black or African American35 4.6% American Indian / Alaska Native529 7.5% Asian6 5.7% Native Hawaiian / Pacific Islander951 7.7% Other race725 5.7% Two or more races1,459 5.2% White alone, not Hispanic / Latino2,047 6.2% Hispanic or LatinoMoved within same state 1,336 3.7% White / Caucasian227 5.1% Black or African American18 2.4% American Indian / Alaska Native652 9.2% Asian929 7.5% Other race890 7.0% Two or more races1,301 4.7% White alone, not Hispanic / Latino1,700 5.1% Hispanic or LatinoMoved from different state 716 2.0% White / Caucasian7 1.0% American Indian / Alaska Native111 1.6% Asian1 1.2% Native Hawaiian / Pacific Islander173 1.4% Other race62 0.5% Two or more races302 1.1% White alone, not Hispanic / Latino225 0.7% Hispanic or LatinoMoved from abroad 126 0.3% White19 0.4% Black or African American9 0.1% Other race46 0.4% Two or more races112 0.4% White alone, not Hispanic / Latino130 0.4% Hispanic or Latino
Children Nativity (place of birth) in Upland
Children under 6 years - Living with two parents Both parents native 1,799 100.0% NativeBoth parents foreign-born 349 100.0% NativeOne native, one foreign-born parent 761 100.0% NativeChildren under 6 years - Living with one parent Native parent 893 99.8% Native1 0.2% Foreign-bornForeign-born parent 381 80.3% Native93 19.7% Foreign-bornChildren 6 to 17 years - Living with two parents Both parents native 4,702 100.0% Native0 0.0% Foreign-bornBoth parents foreign-born 292 84.7% Native53 15.3% Foreign-bornOne native, one foreign-born parent 1,802 95.4% Native88 4.6% Foreign-bornChildren 6 to 17 years - Living with one parent Native parent 3,145 100.0% NativeForeign-born parent 390 54.2% Native329 45.8% Foreign-born
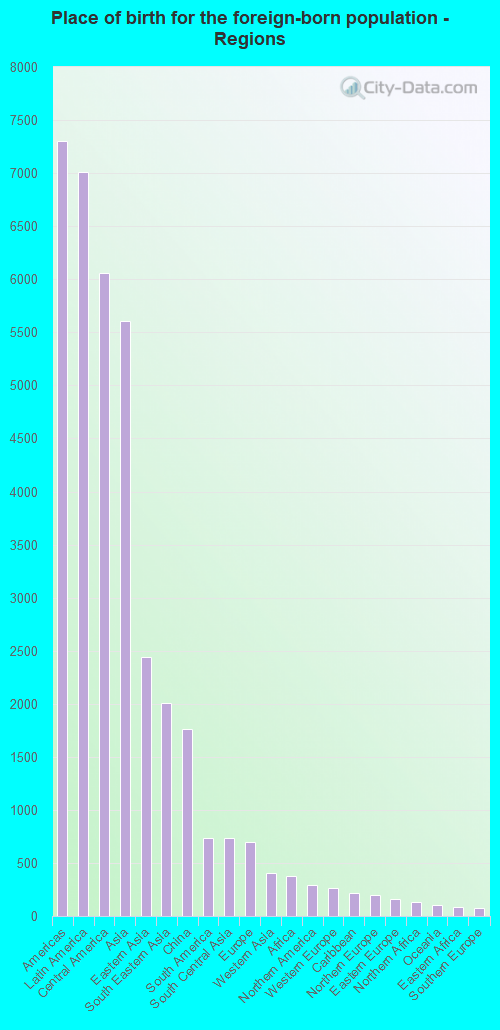
Place of birth for residents in Upland 7,305 Americas7,012 Latin America6,055 Central America5,605 Asia2,442 Eastern Asia2,011 South Eastern Asia1,759 China737 South America732 South Central Asia695 Europe405 Western Asia374 Africa293 Northern America263 Western Europe218 Caribbean202 Northern Europe156 Eastern Europe134 Northern Africa99 Oceania82 Eastern Africa72 Southern Europe63 Western Africa50 Southern Africa33 Middle Africa18 Australia and New Zealand Subregion5,144 Mexico1,290 China1,176 Philippines592 Korea364 Taiwan331 India308 Iran293 Canada283 Nicaragua282 Indonesia271 El Salvador244 Vietnam198 Peru179 Guatemala175 Brazil172 Colombia143 Thailand138 Cuba131 Netherlands123 Germany107 Egypt104 Hong Kong103 England103 Jordan92 United Kingdom90 Japan83 Honduras75 Ecuador70 Cambodia66 Costa Rica61 Chile59 Fiji59 Lebanon55 Romania54 Iraq54 Israel53 Argentina50 Pakistan46 Burma46 Laos41 Italy40 Syria39 Russia39 South Africa38 Trinidad and Tobago37 Ethiopia34 Turkey33 Democratic Republic of Congo (Zaire)32 Sierra Leone28 Jamaica27 Morocco24 Armenia24 Ghana24 Spain18 Kenya18 New Zealand18 Ukraine17 Hungary17 Zimbabwe13 Dominican Republic10 Croatia10 Moldova9 Sri Lanka8 France7 Greece7 Nigeria7 Scotland6 Latvia
Grandparents responsible for own grandchildren in Upland
Grandparents (30 to 59 years) White / Caucasian 59 39.8% Responsible for grandchildren89 60.2% Not responsible for grandchildrenBlack or African American 22 100.0% Not responsible for grandchildrenAmerican Indian / Alaska Native 19 100.0% Responsible for grandchildrenAsian 14 100.0% Not responsible for grandchildrenOther race 66 55.4% Responsible for grandchildren53 44.6% Not responsible for grandchildrenTwo or more races 132 100.0% Responsible for grandchildrenWhite alone, not Hispanic / Latino 26 35.9% Responsible for grandchildren46 64.1% Not responsible for grandchildrenHispanic or Latino 119 47.2% Responsible for grandchildren134 52.8% Not responsible for grandchildrenGrandparents (60 years and over) White / Caucasian 160 20.2% Responsible for grandchildren631 79.8% Not responsible for grandchildrenBlack or African American 24 65.1% Responsible for grandchildren13 34.9% Not responsible for grandchildrenAmerican Indian / Alaska Native 13 100.0% Not responsible for grandchildrenAsian 17 21.3% Responsible for grandchildren61 78.7% Not responsible for grandchildrenOther race 12 4.5% Responsible for grandchildren253 95.5% Not responsible for grandchildrenTwo or more races 250 100.0% Not responsible for grandchildrenWhite alone, not Hispanic / Latino 141 30.1% Responsible for grandchildren327 69.9% Not responsible for grandchildrenHispanic or Latino 53 6.3% Responsible for grandchildren800 93.7% Not responsible for grandchildren