Races in Tyler Run-Queens Gate, Pennsylvania (PA) Detailed Stats
Ancestries, Foreign-born residents, place of birth

Discuss Tyler Run-Queens Gate, Pennsylvania races on our local forum with over 2,400,000 registered users
0.2% of Tyler Run-Queens Gate, PA residents are foreign-born , which is 3313.7% less than the foreign-born rate of 7.0% across the entire state of Pennsylvania.
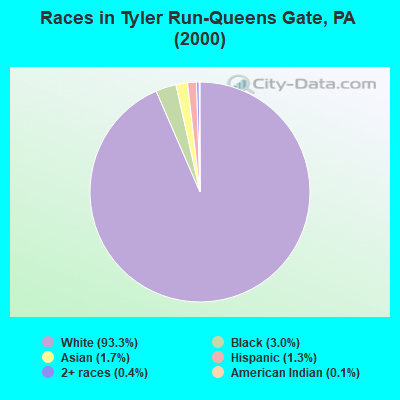
Race distribution in Tyler Run-Queens Gate

- 2,73193.3%White alone
- 873.0%Black alone
- 501.7%Asian alone
- 381.3%Hispanic
- 130.4%Two or more races
- 30.1%American Indian alone
- 20.07%Other race alone
- 20.07%Native Hawaiian and Other
Pacific Islander alone
2000
2022
-
- 10,322,45584.1%White alone
- 1,202,4379.8%Black alone
- 394,0883.2%Hispanic
- 218,2961.8%Asian alone
- 113,0970.9%Two or more races
- 13,0860.1%Other race alone
- 14,9040.1%American Indian alone
- 2,6910.02%Native Hawaiian and Other
Pacific Islander alone

-
- 9,487,22873.1%White alone
- 1,311,58110.1%Black alone
- 1,115,9978.6%Hispanic
- 493,9423.8%Two or more races
- 487,1243.8%Asian alone
- 63,5820.5%Other race alone
- 10,1300.08%American Indian alone
- 2,4240.02%Native Hawaiian and Other
Pacific Islander alone

Income and house value in Tyler Run-Queens Gate
- Median household income in 2022
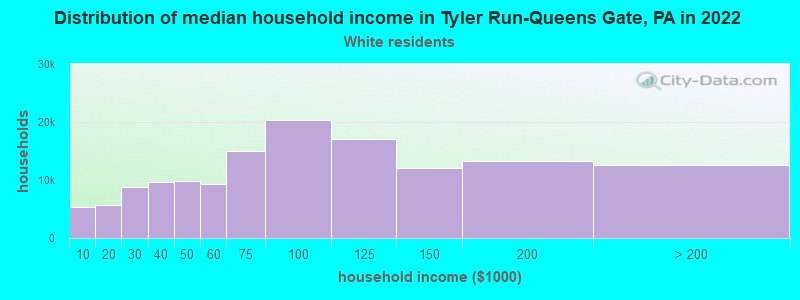
- $71,711White non-Hispanic householders
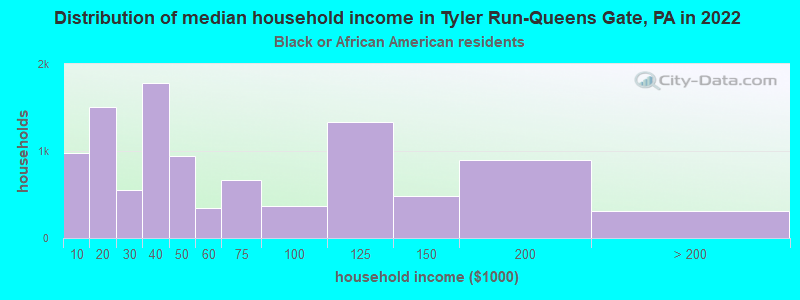
- $45,443Black householders
- $38,366Some other race householders
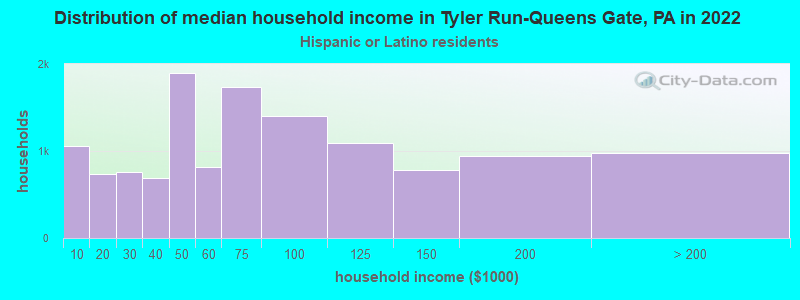
- $65,041Hispanic or Latino race householders
- Median 2022 house value
- $256,229White Non-Hispanic householders
Household income for White non-Hispanic householders
Household income for Black householders
Household income for Hispanic or Latino race householders
Foreign-born residents in Tyler Run-Queens Gate
6 residents are foreign born
| This city: | 0.2% |
| Pennsylvania: | 4.1% |
Ancestries in Tyler Run-Queens Gate

- 1,24540.7%German
- 44814.6%Irish
- 38612.6%Other
- 2738.9%English
- 1846.0%Italian
- 1795.9%United States
- 712.3%French
- 411.3%Polish
- 391.3%Scottish
- 250.8%Norwegian
- 250.8%Scotch-Irish
- 250.8%Swedish
- 220.7%Hungarian
- 210.7%Welsh
- 180.6%Greek
- 130.4%Czech
- 130.4%Subsaharan African
- 120.4%Swiss
- 110.4%Dutch
- 80.3%French Canadian

Zip codes: 17403.