Races in Twinsburg, Ohio (OH) Detailed Stats
Data:
Races - White alone (%)
Races - White alone (% change since 2000)
Races - Black alone (%)
Races - Black alone (% change since 2000)
Races - American Indian alone (%)
Races - American Indian alone (% change since 2000)
Races - Asian alone (%)
Races - Asian alone (% change since 2000)
Races - Hispanic (%)
Races - Hispanic (% change since 2000)
Races - Native Hawaiian and Other Pacific Islander alone (%)
Races - Native Hawaiian and Other Pacific Islander alone (% change since 2000)
Races - Two or more races(%)
Races - Two or more races(% change since 2000)
Races - Other race alone (%)
Races - Other race alone (% change since 2000)
Racial diversity
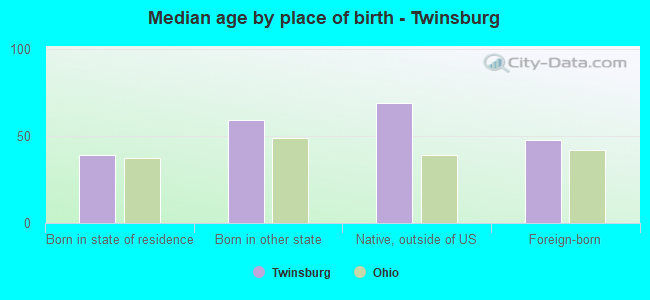
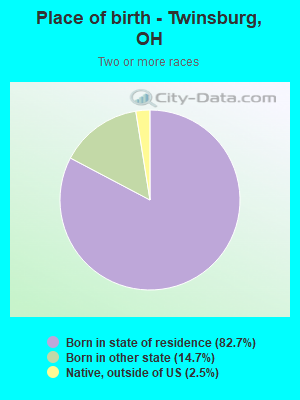
Place of birth - Born in state of residence (%)
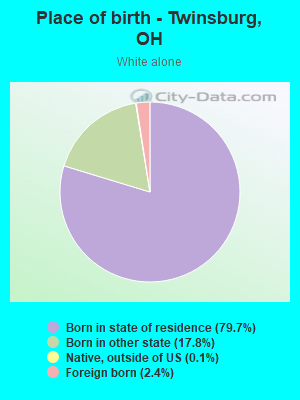
Place of birth - Born in state of residence (%) - White
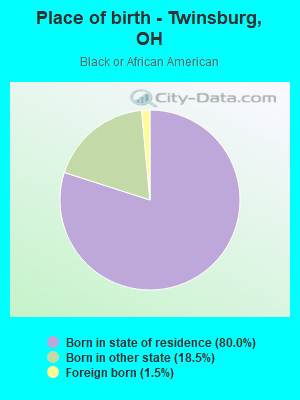
Place of birth - Born in state of residence (%) - Black or African American
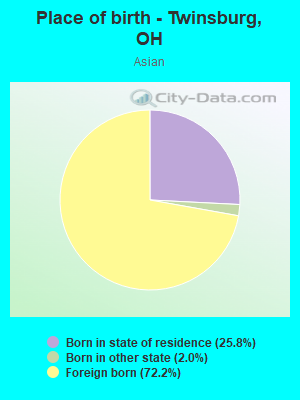
Place of birth - Born in state of residence (%) - Asian
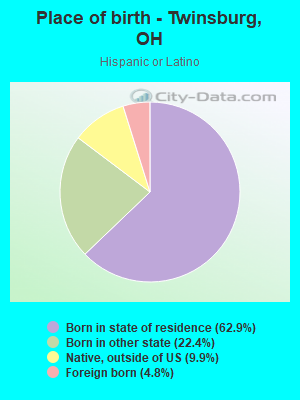
Place of birth - Born in state of residence (%) - Hispanic or Latino
Place of birth - Born in state of residence (%) - American Indian and Alaska Native
Place of birth - Born in state of residence (%) - Multirace
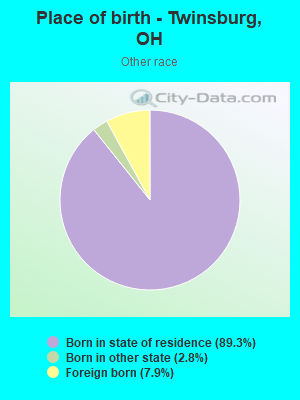
Place of birth - Born in state of residence (%) - Other Race
Place of birth - Born in other state (%)
Place of birth - Born in other state (%) - White
Place of birth - Born in other state (%) - Black or African American
Place of birth - Born in other state (%) - Asian
Place of birth - Born in other state (%) - Hispanic or Latino
Place of birth - Born in other state (%) - American Indian and Alaska Native
Place of birth - Born in other state (%) - Multirace
Place of birth - Born in other state (%) - Other Race
Place of birth - Native, outside of US (%)
Place of birth - Native, outside of US (%) - White
Place of birth - Native, outside of US (%) - Black or African American
Place of birth - Native, outside of US (%) - Asian
Place of birth - Native, outside of US (%) - Hispanic or Latino
Place of birth - Native, outside of US (%) - American Indian and Alaska Native
Place of birth - Native, outside of US (%) - Multirace
Place of birth - Native, outside of US (%) - Other Race
Place of birth - Foreign born (%)
Place of birth - Foreign born (%) - White
Place of birth - Foreign born (%) - Black or African American
Place of birth - Foreign born (%) - Asian
Place of birth - Foreign born (%) - Hispanic or Latino
Place of birth - Foreign born (%) - American Indian and Alaska Native
Place of birth - Foreign born (%) - Multirace
Place of birth - Foreign born (%) - Other Race
Residents speaking English at home (%)
Residents speaking English at home - Born in the United States (%)
Residents speaking English at home - Native, born elsewhere (%)
Residents speaking English at home - Foreign born (%)
Residents speaking Spanish at home (%)
Residents speaking Spanish at home - Born in the United States (%)
Residents speaking Spanish at home - Native, born elsewhere (%)
Residents speaking Spanish at home - Foreign born (%)
Residents speaking other language at home (%)
Residents speaking other language at home - Born in the United States (%)
Residents speaking other language at home - Native, born elsewhere (%)
Residents speaking other language at home - Foreign born (%)
Marital status - Never married (%)
Marital status - Now married (%)
Marital status - Separated (%)
Marital status - Widowed (%)
Marital status - Divorced (%)
Ancestries Reported - Arab (%)
Ancestries Reported - Czech (%)
Ancestries Reported - Danish (%)
Ancestries Reported - Dutch (%)
Ancestries Reported - English (%)
Ancestries Reported - French (%)
Ancestries Reported - French Canadian (%)
Ancestries Reported - German (%)
Ancestries Reported - Greek (%)
Ancestries Reported - Hungarian (%)
Ancestries Reported - Irish (%)
Ancestries Reported - Italian (%)
Ancestries Reported - Lithuanian (%)
Ancestries Reported - Norwegian (%)
Ancestries Reported - Polish (%)
Ancestries Reported - Portuguese (%)
Ancestries Reported - Russian (%)
Ancestries Reported - Scotch-Irish (%)
Ancestries Reported - Scottish (%)
Ancestries Reported - Slovak (%)
Ancestries Reported - Subsaharan African (%)
Ancestries Reported - Swedish (%)
Ancestries Reported - Swiss (%)
Ancestries Reported - Ukrainian (%)
Ancestries Reported - United States (%)
Ancestries Reported - Welsh (%)
Ancestries Reported - West Indian (%)
Ancestries Reported - Other (%)
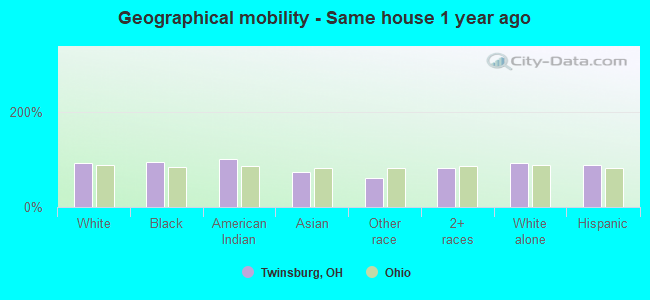
Geographical mobility - Same house 1 year ago (%)
Geographical mobility - Same house 1 year ago (%) - White
Geographical mobility - Same house 1 year ago (%) - Black or African American
Geographical mobility - Same house 1 year ago (%) - Asian
Geographical mobility - Same house 1 year ago (%) - Hispanic or Latino
Geographical mobility - Same house 1 year ago (%) - American Indian and Alaska Native
Geographical mobility - Same house 1 year ago (%) - Multirace
Geographical mobility - Same house 1 year ago (%) - Other Race
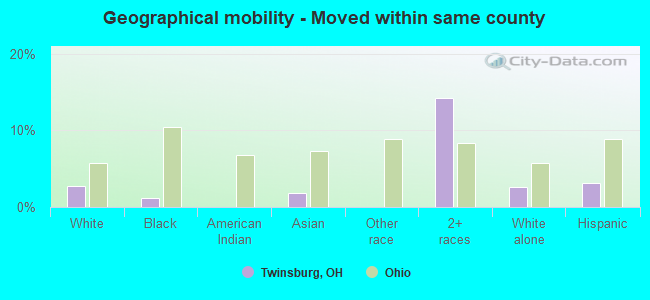
Geographical mobility - Moved within same county (%)
Geographical mobility - Moved within same county (%) - White
Geographical mobility - Moved within same county (%) - Black or African American
Geographical mobility - Moved within same county (%) - Asian
Geographical mobility - Moved within same county (%) - Hispanic or Latino
Geographical mobility - Moved within same county (%) - American Indian and Alaska Native
Geographical mobility - Moved within same county (%) - Multirace
Geographical mobility - Moved within same county (%) - Other Race
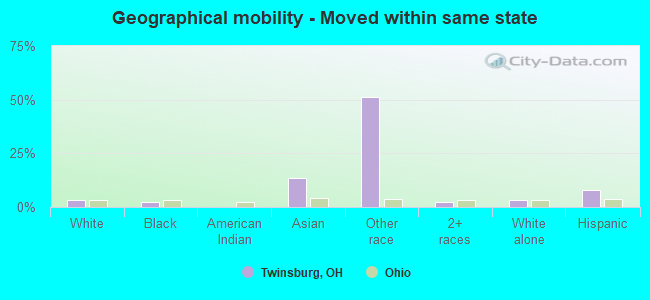
Geographical mobility - Moved from different county within same state (%)
Geographical mobility - Moved from different county within same state (%) - White
Geographical mobility - Moved from different county within same state (%) - Black or African American
Geographical mobility - Moved from different county within same state (%) - Asian
Geographical mobility - Moved from different county within same state (%) - Hispanic or Latino
Geographical mobility - Moved from different county within same state (%) - American Indian and Alaska Native
Geographical mobility - Moved from different county within same state (%) - Multirace
Geographical mobility - Moved from different county within same state (%) - Other Race
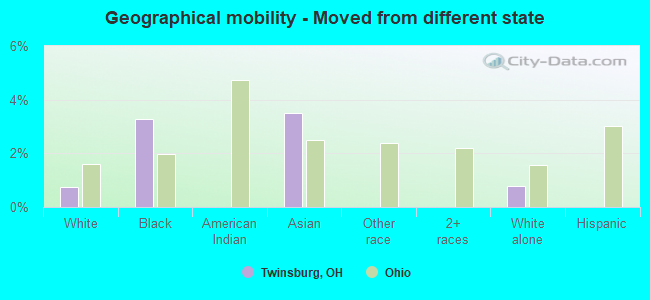
Geographical mobility - Moved from different state (%)
Geographical mobility - Moved from different state (%) - White
Geographical mobility - Moved from different state (%) - Black or African American
Geographical mobility - Moved from different state (%) - Asian
Geographical mobility - Moved from different state (%) - Hispanic or Latino
Geographical mobility - Moved from different state (%) - American Indian and Alaska Native
Geographical mobility - Moved from different state (%) - Multirace
Geographical mobility - Moved from different state (%) - Other Race
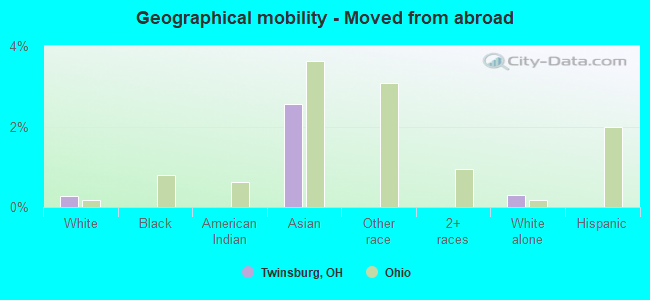
Geographical mobility - Moved from abroad (%)
Geographical mobility - Moved from abroad (%) - White
Geographical mobility - Moved from abroad (%) - Black or African American
Geographical mobility - Moved from abroad (%) - Asian
Geographical mobility - Moved from abroad (%) - Hispanic or Latino
Geographical mobility - Moved from abroad (%) - American Indian and Alaska Native
Geographical mobility - Moved from abroad (%) - Multirace
Geographical mobility - Moved from abroad (%) - Other Race
Place of birth for the foreign-born population - Ireland (%)
Place of birth for the foreign-born population - Denmark (%)
Place of birth for the foreign-born population - Norway (%)
Place of birth for the foreign-born population - Sweden (%)
Place of birth for the foreign-born population - United Kingdom (%)
Place of birth for the foreign-born population - England (%)
Place of birth for the foreign-born population - Scotland (%)
Place of birth for the foreign-born population - Other Northern Europe (%)
Place of birth for the foreign-born population - Austria (%)
Place of birth for the foreign-born population - Belgium (%)
Place of birth for the foreign-born population - France (%)
Place of birth for the foreign-born population - Germany (%)
Place of birth for the foreign-born population - Netherlands (%)
Place of birth for the foreign-born population - Switzerland (%)
Place of birth for the foreign-born population - Other Western Europe (%)
Place of birth for the foreign-born population - Greece (%)
Place of birth for the foreign-born population - Italy (%)
Place of birth for the foreign-born population - Portugal (%)
Place of birth for the foreign-born population - Spain (%)
Place of birth for the foreign-born population - Other Southern Europe (%)
Place of birth for the foreign-born population - Albania (%)
Place of birth for the foreign-born population - Belarus (%)
Place of birth for the foreign-born population - Bosnia and Herzegovina (%)
Place of birth for the foreign-born population - Bulgaria (%)
Place of birth for the foreign-born population - Croatia (%)
Place of birth for the foreign-born population - Czechoslovakia (%)
Place of birth for the foreign-born population - Hungary (%)
Place of birth for the foreign-born population - Latvia (%)
Place of birth for the foreign-born population - Lithuania (%)
Place of birth for the foreign-born population - North Macedonia (Macedonia) (%)
Place of birth for the foreign-born population - Moldova (%)
Place of birth for the foreign-born population - Poland (%)
Place of birth for the foreign-born population - Romania (%)
Place of birth for the foreign-born population - Russia (%)
Place of birth for the foreign-born population - Serbia (%)
Place of birth for the foreign-born population - Ukraine (%)
Place of birth for the foreign-born population - Other Eastern Europe (%)
Place of birth for the foreign-born population - China (%)
Place of birth for the foreign-born population - Hong Kong (%)
Place of birth for the foreign-born population - Taiwan (%)
Place of birth for the foreign-born population - Japan (%)
Place of birth for the foreign-born population - Korea (%)
Place of birth for the foreign-born population - Other Eastern Asia (%)
Place of birth for the foreign-born population - Afghanistan (%)
Place of birth for the foreign-born population - Bangladesh (%)
Place of birth for the foreign-born population - India (%)
Place of birth for the foreign-born population - Iran (%)
Place of birth for the foreign-born population - Kazakhstan (%)
Place of birth for the foreign-born population - Nepal (%)
Place of birth for the foreign-born population - Pakistan (%)
Place of birth for the foreign-born population - Sri Lanka (%)
Place of birth for the foreign-born population - Uzbekistan (%)
Place of birth for the foreign-born population - Other South Central Asia (%)
Place of birth for the foreign-born population - Burma (%)
Place of birth for the foreign-born population - Cambodia (%)
Place of birth for the foreign-born population - Indonesia (%)
Place of birth for the foreign-born population - Laos (%)
Place of birth for the foreign-born population - Malaysia (%)
Place of birth for the foreign-born population - Philippines (%)
Place of birth for the foreign-born population - Singapore (%)
Place of birth for the foreign-born population - Thailand (%)
Place of birth for the foreign-born population - Vietnam (%)
Place of birth for the foreign-born population - Other South Eastern Asia (%)
Place of birth for the foreign-born population - Armenia (%)
Place of birth for the foreign-born population - Iraq (%)
Place of birth for the foreign-born population - Israel (%)
Place of birth for the foreign-born population - Jordan (%)
Place of birth for the foreign-born population - Kuwait (%)
Place of birth for the foreign-born population - Lebanon (%)
Place of birth for the foreign-born population - Saudi Arabia (%)
Place of birth for the foreign-born population - Syria (%)
Place of birth for the foreign-born population - Turkey (%)
Place of birth for the foreign-born population - Yemen (%)
Place of birth for the foreign-born population - Other Western Asia (%)
Place of birth for the foreign-born population - Eritrea (%)
Place of birth for the foreign-born population - Ethiopia (%)
Place of birth for the foreign-born population - Kenya (%)
Place of birth for the foreign-born population - Somalia (%)
Place of birth for the foreign-born population - Uganda (%)
Place of birth for the foreign-born population - Zimbabwe (%)
Place of birth for the foreign-born population - Other Eastern Africa (%)
Place of birth for the foreign-born population - Cameroon (%)
Place of birth for the foreign-born population - Congo (%)
Place of birth for the foreign-born population - Democratic Republic of Congo (Zaire) (%)
Place of birth for the foreign-born population - Other Middle Africa (%)
Place of birth for the foreign-born population - Egypt (%)
Place of birth for the foreign-born population - Morocco (%)
Place of birth for the foreign-born population - Sudan (%)
Place of birth for the foreign-born population - Other Northern Africa (%)
Place of birth for the foreign-born population - South Africa (%)
Place of birth for the foreign-born population - Other Southern Africa (%)
Place of birth for the foreign-born population - Cabo Verde (%)
Place of birth for the foreign-born population - Ghana (%)
Place of birth for the foreign-born population - Liberia (%)
Place of birth for the foreign-born population - Nigeria (%)
Place of birth for the foreign-born population - Senegal (%)
Place of birth for the foreign-born population - Sierra Leone (%)
Place of birth for the foreign-born population - Other Western Africa (%)
Place of birth for the foreign-born population - Australia (%)
Place of birth for the foreign-born population - New Zealand (%)
Place of birth for the foreign-born population - Fiji (%)
Place of birth for the foreign-born population - Micronesia (%)
Place of birth for the foreign-born population - Bahamas (%)
Place of birth for the foreign-born population - Barbados (%)
Place of birth for the foreign-born population - Cuba (%)
Place of birth for the foreign-born population - Dominica (%)
Place of birth for the foreign-born population - Dominican Republic (%)
Place of birth for the foreign-born population - Grenada (%)
Place of birth for the foreign-born population - Haiti (%)
Place of birth for the foreign-born population - Jamaica (%)
Place of birth for the foreign-born population - St. Vincent and the Grenadines (%)
Place of birth for the foreign-born population - Trinidad and Tobago (%)
Place of birth for the foreign-born population - West Indies (%)
Place of birth for the foreign-born population - Other Caribbean (%)
Place of birth for the foreign-born population - Belize (%)
Place of birth for the foreign-born population - Costa Rica (%)
Place of birth for the foreign-born population - El Salvador (%)
Place of birth for the foreign-born population - Guatemala (%)
Place of birth for the foreign-born population - Honduras (%)
Place of birth for the foreign-born population - Mexico (%)
Place of birth for the foreign-born population - Nicaragua (%)
Place of birth for the foreign-born population - Panama (%)
Place of birth for the foreign-born population - Other Central America (%)
Place of birth for the foreign-born population - Argentina (%)
Place of birth for the foreign-born population - Bolivia (%)
Place of birth for the foreign-born population - Brazil (%)
Place of birth for the foreign-born population - Chile (%)
Place of birth for the foreign-born population - Colombia (%)
Place of birth for the foreign-born population - Ecuador (%)
Place of birth for the foreign-born population - Guyana (%)
Place of birth for the foreign-born population - Peru (%)
Place of birth for the foreign-born population - Uruguay (%)
Place of birth for the foreign-born population - Venezuela (%)
Place of birth for the foreign-born population - Other South America (%)
Place of birth for the foreign-born population - Canada (%)
Place of birth for the foreign-born population - Other Northern America (%)
Place of birth for the foreign-born population - Other (%)
Latest news about races in Twinsburg, OH collected exclusively by city-data.com from local newspapers, TV, and radio stations
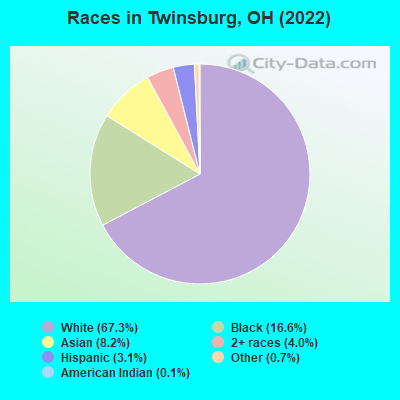
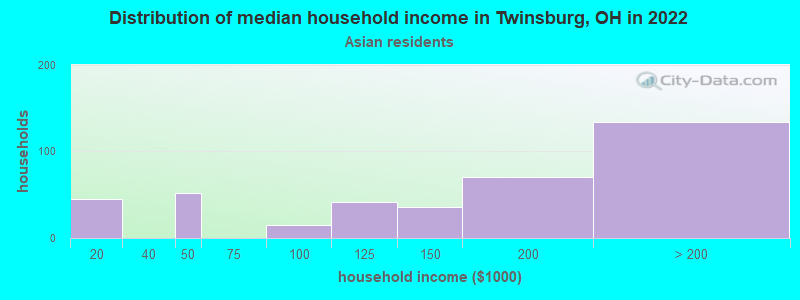
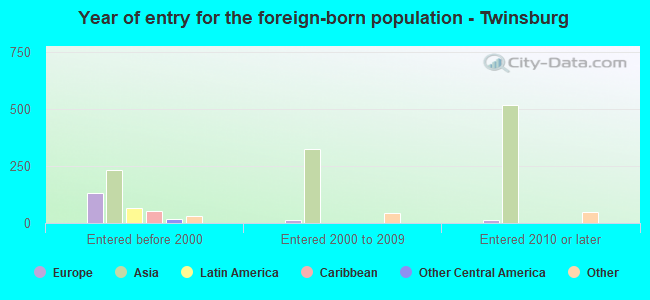
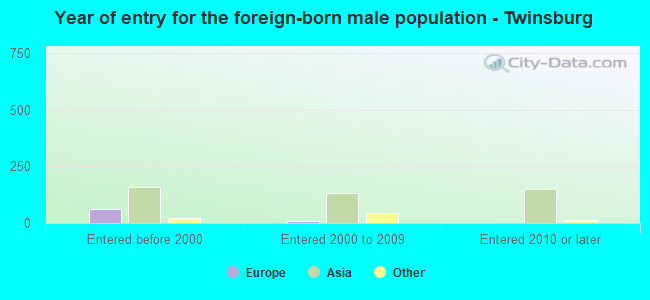
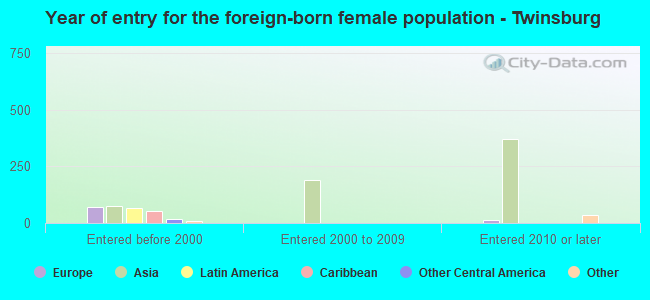
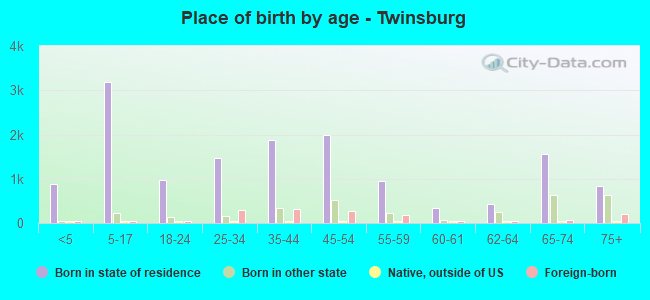
According to 2022 data, the most numerous races in Twinsburg, OH are White alone (12,900 residents), Black alone (3,181 residents), and Two or more races (766 residents). 91.4% of Twinsburg residents speak English at home. 7.7% of Twinsburg, OH residents are foreign-born (5.6% born in Asia, 0.9% born in Europe), which is 47.9% greater than the foreign-born rate of 4.0% across the entire state of Ohio.
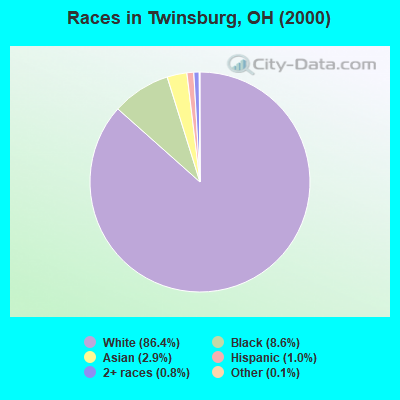
Race distribution in Twinsburg
2000 2022
9,538,111 84.0% White alone 1,290,662 11.4% Black alone 217,123 1.9% Hispanic 137,770 1.2% Two or more races 131,670 1.2% Asian alone 21,985 0.2% American Indian alone 13,483 0.1% Other race alone 2,336 0.02% Native Hawaiian and Other
8,948,793 76.1% White alone 1,401,403 11.9% Black alone 529,291 4.5% Two or more races 517,232 4.4% Hispanic 293,387 2.5% Asian alone 52,805 0.4% Other race alone 9,785 0.08% American Indian alone 3,362 0.03% Native Hawaiian and Other
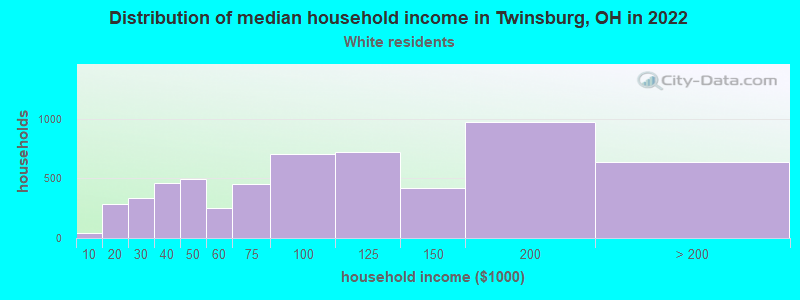
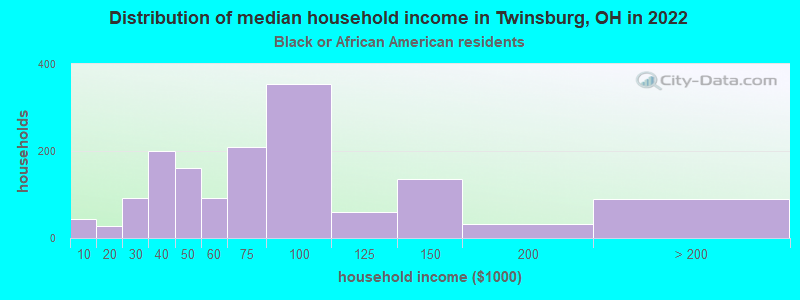
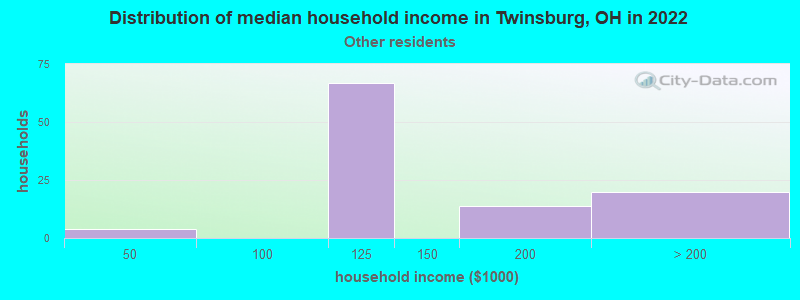
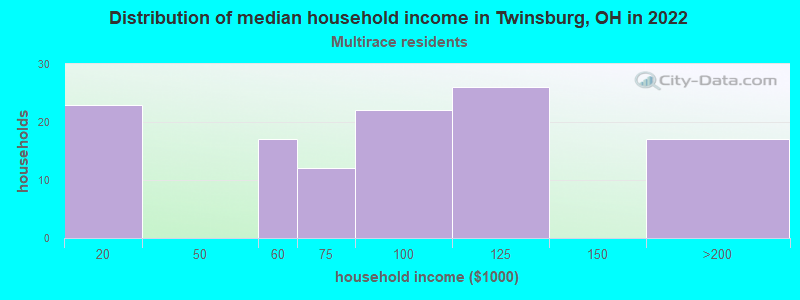
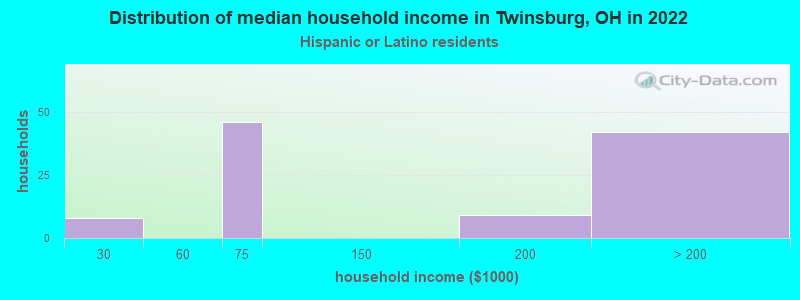
Income and house value in Twinsburg Median household income in 2022 $94,903 White non-Hispanic householders$78,487 Black householders$124,204 Asian householders$113,758 Some other race householders$88,558 Two or more races householdersMedian 2022 house value $290,993 White Non-Hispanic householders$323,268 Black or African American householders $348,775 Asian householders$309,039 Some other race householders$245,878 Hispanic or Latino householders
Median age by race in Twinsburg
47.8 Median age for White residents44.3 51.0 41.5 Median age for Black or African American residents44.3 40.8 -502,953,586.0 Median age for American Indian / Alaska Native residents-668,371,695.8 -390,759,075.5 35.4 Median age for Asian residents38.3 34.1 -800,387,596.1 Median age for Native Hawaiian / Pacific Islander residents-666,666,666.0 -805,394,989.6 38.2 Median age for Other race residents25.9 57.6 16.7 Median age for Two or more races residents17.7 15.9 47.6 Median age for White alone residents44.5 50.7 55.1 Median age for Hispanic or Latino residents24.2 54.5
Owner/renter occupied households by race in Twinsburg
House owners and renters - White residents 4,817 83.0% Owner occupied986 17.0% Renter occupiedHouse owners and renters - Black or African American residents 877 57.5% Owner occupied648 42.5% Renter occupiedHouse owners and renters - Asian residents 253 60.4% Owner occupied166 39.6% Renter occupiedHouse owners and renters - Other race residents 40 58.7% Owner occupied28 41.3% Renter occupiedHouse owners and renters - Two or more races residents 107 91.4% Owner occupied10 8.6% Renter occupiedHouse owners and renters - White alone residents 4,779 83.1% Owner occupied971 16.9% Renter occupiedHouse owners and renters - Hispanic or Latino residents 84 79.2% Owner occupied22 20.8% Renter occupied
Language usage in Twinsburg
English speakers - Total 91.4% of residents of Twinsburg speak English at home.
0.8% of residents speak Spanish at home 101 70.6% Speak English very well42 29.4% Speak English less than very well7.7% of residents speak other language at home 934 66.4% Speak English very well472 33.6% Speak English less than very well
English speakers - Born in the United States 97.3% of residents of Twinsburg speak English at home.
1.0% of residents speak Spanish at home 21 65.6% Speak English very well11 34.4% Speak English less than very well2.5% of residents speak other language at home 21 26.6% Speak English very well58 73.4% Speak English less than very well
English speakers - Native, born elsewhere 8.3% of residents of Twinsburg speak English at home.
71.7% of residents speak Spanish at home 27 62.8% Speak English very well16 37.2% Speak English less than very well18.3% of residents speak other language at home 11 100.0% Speak English less than very well
English speakers - Foreign-born 18.5% of residents of Twinsburg speak English at home.
80.8% of residents speak other language at home 771 64.4% Speak English very well427 35.6% Speak English less than very well
White (Caucasian) - Speak only English Native:
98.6% (12,226)Foreign-born:
15.3% (49)
White (Caucasian) - Speak another language Native:
1.4% (179)Foreign-born:
87.6% (279)
Black or African American - Speak only English Native:
99.7% (3,074)Foreign-born:
100.0% (50)
Asian - Speak only English Native:
51.2% (129)Foreign-born:
11.9% (138)
Asian - Speak another language Native:
47.9% (120)Foreign-born:
87.5% (1,015)
Other race - Speak only English Native:
97.0% (205)Foreign-born:
78.7% (29)
White alone - Speak only English Native:
99.2% (11,945)Foreign-born:
15.6% (49)
White alone - Speak another language Native:
0.7% (80)Foreign-born:
87.5% (274)
Hispanic or Latino - Speak only English Native:
84.6% (487)Foreign-born:
95.3% (29)
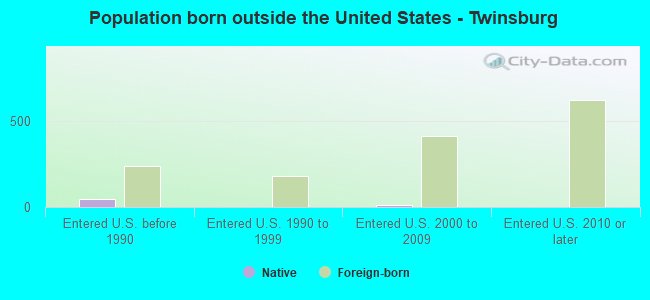
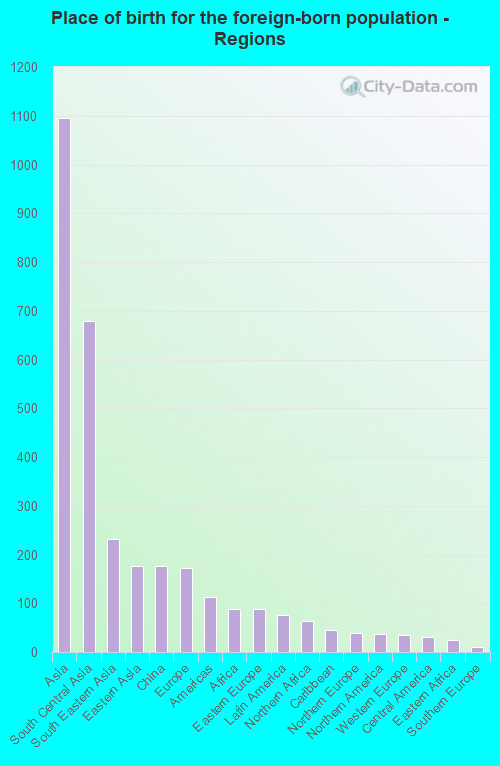
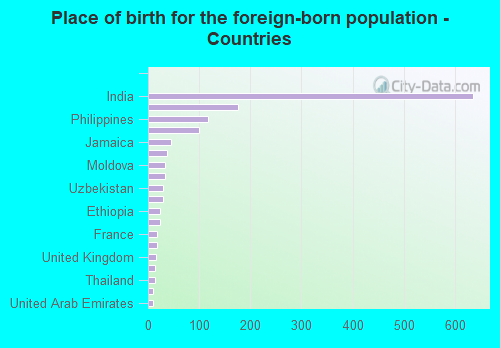
Foreign-born residents in Twinsburg 1,472 residents are foreign born (5.6% Asia , 0.9% Europe ).
Marital status for residents in Twinsburg Marital status - White (Caucasian) population 15 years and over
Males 29.6% Never married59.9% Now married0.4% Separated2.6% Widowed7.5% DivorcedFemales 25.3% Never married48.6% Now married0.6% Separated12.0% Widowed13.5% DivorcedWomen who gave birth in the past 12 months Now married:
100.0% (66)Unmarried:
0.0% (0)
Women who did not give birth in the past 12 months Now married:
41.7% (1,026)Unmarried:
58.3% (1,434)
Marital status - Black or African American population 15 years and over
Males 38.0% Never married47.3% Now married1.6% Separated10.0% Widowed3.0% DivorcedFemales 29.7% Never married31.2% Now married3.3% Separated2.5% Widowed33.4% DivorcedWomen who gave birth in the past 12 months Now married:
0.0% (0)Unmarried:
100.0% (3)
Women who did not give birth in the past 12 months Now married:
33.0% (298)Unmarried:
67.0% (607)
Marital status - Asian population 15 years and over
Males 15.7% Never married81.5% Now married0.0% Separated0.0% Widowed2.8% DivorcedFemales 19.4% Never married74.4% Now married0.0% Separated3.8% Widowed2.4% DivorcedWomen who gave birth in the past 12 months Now married:
100.0% (29)Unmarried:
0.0% (0)
Women who did not give birth in the past 12 months Now married:
75.1% (351)Unmarried:
24.9% (116)
Marital status - Other race population 15 years and over
Males 61.1% Never married38.9% Now married0.0% Separated0.0% Widowed0.0% DivorcedFemales 0.0% Never married61.3% Now married0.0% Separated38.7% Widowed0.0% DivorcedWomen who gave birth in the past 12 months Now married:
100.0% (4)Unmarried:
0.0% (0)
Women who did not give birth in the past 12 months Now married:
100.0% (17)Unmarried:
0.0% (0)
Marital status - Two or more races population 15 years and over
Males 40.3% Never married31.2% Now married27.8% Separated0.0% Widowed0.6% DivorcedFemales 46.1% Never married40.9% Now married0.0% Separated0.0% Widowed13.0% DivorcedWomen who did not give birth in the past 12 months Now married:
32.4% (42)Unmarried:
67.6% (89)
Marital status - White alone, not Hispanic / Latino population 15 years and over
Males 28.9% Never married60.8% Now married0.3% Separated2.7% Widowed7.3% DivorcedFemales 24.2% Never married48.4% Now married0.6% Separated12.6% Widowed14.2% DivorcedWomen who gave birth in the past 12 months Now married:
100.0% (67)Unmarried:
0.0% (0)
Women who did not give birth in the past 12 months Now married:
42.1% (999)Unmarried:
57.9% (1,377)
Marital status - Hispanic or Latino population 15 years and over
Males 56.8% Never married24.7% Now married5.6% Separated0.0% Widowed13.0% DivorcedFemales 42.8% Never married57.2% Now married0.0% Separated0.0% Widowed0.0% DivorcedWomen who did not give birth in the past 12 months Now married:
32.5% (36)Unmarried:
67.5% (76)
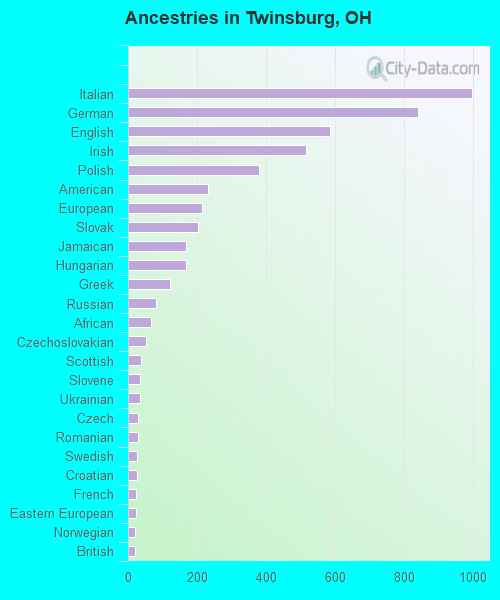
Ancestries in Twinsburg
997 11.4% Italian842 9.6% German587 6.7% English516 5.9% Irish379 4.3% Polish233 2.7% American215 2.5% European202 2.3% Slovak169 1.9% Jamaican168 1.9% Hungarian121 1.4% Greek81 0.9% Russian66 0.8% African51 0.6% Czechoslovakian38 0.4% Scottish35 0.4% Slovene34 0.4% Ukrainian30 0.3% Czech28 0.3% Romanian27 0.3% Swedish26 0.3% Croatian24 0.3% French23 0.3% Eastern European21 0.2% Norwegian19 0.2% British18 0.2% Dutch18 0.2% Ethiopian15 0.2% Welsh13 0.1% Austrian12 0.1% Nigerian12 0.1% Swiss10 0.1% Armenian10 0.1% Brazilian8 0.09% French Canadian5 0.06% Israeli4 0.05% Lithuanian4 0.05% Scotch-Irish4 0.05% Yugoslavian
Children Nativity (place of birth) in Twinsburg
Children under 6 years - Living with two parents Both parents native 402 100.0% NativeBoth parents foreign-born 119 100.0% NativeOne native, one foreign-born parent 110 100.0% NativeChildren under 6 years - Living with one parent Native parent 608 100.0% NativeForeign-born parent 13 100.0% NativeChildren 6 to 17 years - Living with two parents Both parents native 1,769 98.2% Native32 1.8% Foreign-bornBoth parents foreign-born 177 90.0% Native20 10.0% Foreign-bornOne native, one foreign-born parent 103 100.0% NativeChildren 6 to 17 years - Living with one parent Native parent 887 100.0% NativeForeign-born parent 25 43.0% Native33 57.0% Foreign-born
Grandparents responsible for own grandchildren in Twinsburg
Grandparents (30 to 59 years) White / Caucasian 37 100.0% Not responsible for grandchildrenBlack or African American 8 59.1% Responsible for grandchildren6 40.9% Not responsible for grandchildrenAsian 42 100.0% Not responsible for grandchildrenTwo or more races 15 100.0% Responsible for grandchildrenWhite alone, not Hispanic / Latino 37 100.0% Not responsible for grandchildrenGrandparents (60 years and over) White / Caucasian 87 100.0% Not responsible for grandchildrenBlack or African American 36 79.8% Responsible for grandchildren9 20.2% Not responsible for grandchildrenAsian 40 100.0% Not responsible for grandchildrenWhite alone, not Hispanic / Latino 87 100.0% Not responsible for grandchildren