Races in Torrington, Wyoming (WY) Detailed Stats
Data:
Races - White alone (%)
Races - White alone (% change since 2000)
Races - Black alone (%)
Races - Black alone (% change since 2000)
Races - American Indian alone (%)
Races - American Indian alone (% change since 2000)
Races - Asian alone (%)
Races - Asian alone (% change since 2000)
Races - Hispanic (%)
Races - Hispanic (% change since 2000)
Races - Native Hawaiian and Other Pacific Islander alone (%)
Races - Native Hawaiian and Other Pacific Islander alone (% change since 2000)
Races - Two or more races(%)
Races - Two or more races(% change since 2000)
Races - Other race alone (%)
Races - Other race alone (% change since 2000)
Racial diversity
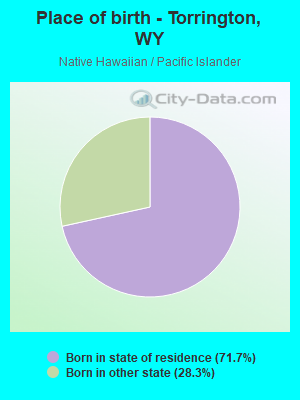
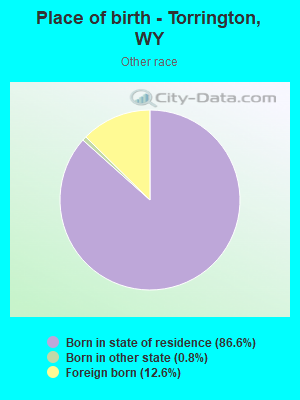
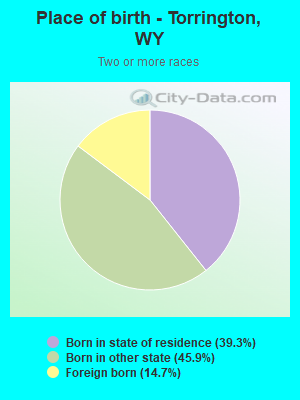
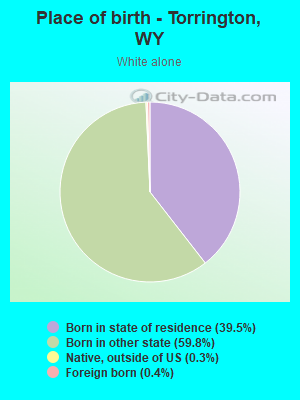
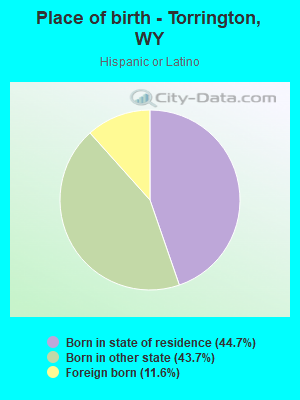
Place of birth - Born in state of residence (%)
Place of birth - Born in state of residence (%) - White
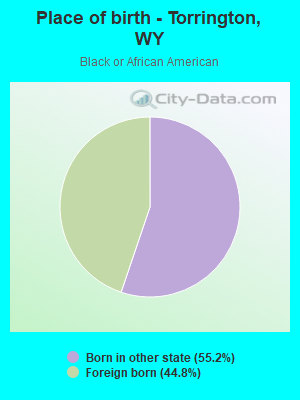
Place of birth - Born in state of residence (%) - Black or African American
Place of birth - Born in state of residence (%) - Asian
Place of birth - Born in state of residence (%) - Hispanic or Latino
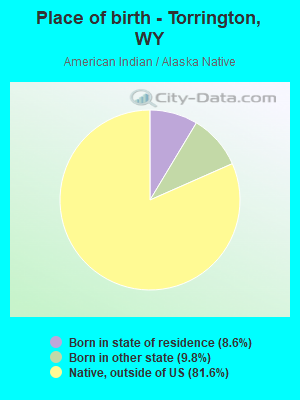
Place of birth - Born in state of residence (%) - American Indian and Alaska Native
Place of birth - Born in state of residence (%) - Multirace
Place of birth - Born in state of residence (%) - Other Race
Place of birth - Born in other state (%)
Place of birth - Born in other state (%) - White
Place of birth - Born in other state (%) - Black or African American
Place of birth - Born in other state (%) - Asian
Place of birth - Born in other state (%) - Hispanic or Latino
Place of birth - Born in other state (%) - American Indian and Alaska Native
Place of birth - Born in other state (%) - Multirace
Place of birth - Born in other state (%) - Other Race
Place of birth - Native, outside of US (%)
Place of birth - Native, outside of US (%) - White
Place of birth - Native, outside of US (%) - Black or African American
Place of birth - Native, outside of US (%) - Asian
Place of birth - Native, outside of US (%) - Hispanic or Latino
Place of birth - Native, outside of US (%) - American Indian and Alaska Native
Place of birth - Native, outside of US (%) - Multirace
Place of birth - Native, outside of US (%) - Other Race
Place of birth - Foreign born (%)
Place of birth - Foreign born (%) - White
Place of birth - Foreign born (%) - Black or African American
Place of birth - Foreign born (%) - Asian
Place of birth - Foreign born (%) - Hispanic or Latino
Place of birth - Foreign born (%) - American Indian and Alaska Native
Place of birth - Foreign born (%) - Multirace
Place of birth - Foreign born (%) - Other Race
Residents speaking English at home (%)
Residents speaking English at home - Born in the United States (%)
Residents speaking English at home - Native, born elsewhere (%)
Residents speaking English at home - Foreign born (%)
Residents speaking Spanish at home (%)
Residents speaking Spanish at home - Born in the United States (%)
Residents speaking Spanish at home - Native, born elsewhere (%)
Residents speaking Spanish at home - Foreign born (%)
Residents speaking other language at home (%)
Residents speaking other language at home - Born in the United States (%)
Residents speaking other language at home - Native, born elsewhere (%)
Residents speaking other language at home - Foreign born (%)
Marital status - Never married (%)
Marital status - Now married (%)
Marital status - Separated (%)
Marital status - Widowed (%)
Marital status - Divorced (%)
Ancestries Reported - Arab (%)
Ancestries Reported - Czech (%)
Ancestries Reported - Danish (%)
Ancestries Reported - Dutch (%)
Ancestries Reported - English (%)
Ancestries Reported - French (%)
Ancestries Reported - French Canadian (%)
Ancestries Reported - German (%)
Ancestries Reported - Greek (%)
Ancestries Reported - Hungarian (%)
Ancestries Reported - Irish (%)
Ancestries Reported - Italian (%)
Ancestries Reported - Lithuanian (%)
Ancestries Reported - Norwegian (%)
Ancestries Reported - Polish (%)
Ancestries Reported - Portuguese (%)
Ancestries Reported - Russian (%)
Ancestries Reported - Scotch-Irish (%)
Ancestries Reported - Scottish (%)
Ancestries Reported - Slovak (%)
Ancestries Reported - Subsaharan African (%)
Ancestries Reported - Swedish (%)
Ancestries Reported - Swiss (%)
Ancestries Reported - Ukrainian (%)
Ancestries Reported - United States (%)
Ancestries Reported - Welsh (%)
Ancestries Reported - West Indian (%)
Ancestries Reported - Other (%)
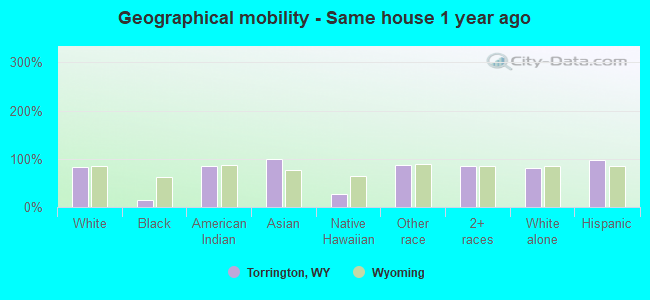
Geographical mobility - Same house 1 year ago (%)
Geographical mobility - Same house 1 year ago (%) - White
Geographical mobility - Same house 1 year ago (%) - Black or African American
Geographical mobility - Same house 1 year ago (%) - Asian
Geographical mobility - Same house 1 year ago (%) - Hispanic or Latino
Geographical mobility - Same house 1 year ago (%) - American Indian and Alaska Native
Geographical mobility - Same house 1 year ago (%) - Multirace
Geographical mobility - Same house 1 year ago (%) - Other Race
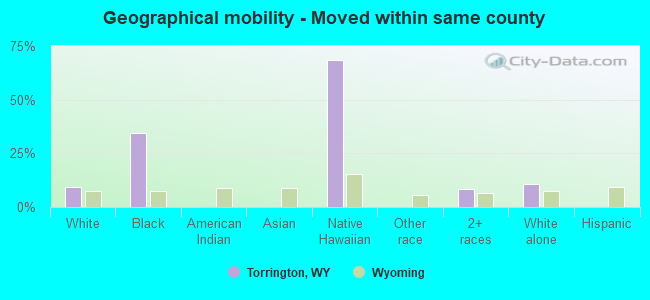
Geographical mobility - Moved within same county (%)
Geographical mobility - Moved within same county (%) - White
Geographical mobility - Moved within same county (%) - Black or African American
Geographical mobility - Moved within same county (%) - Asian
Geographical mobility - Moved within same county (%) - Hispanic or Latino
Geographical mobility - Moved within same county (%) - American Indian and Alaska Native
Geographical mobility - Moved within same county (%) - Multirace
Geographical mobility - Moved within same county (%) - Other Race
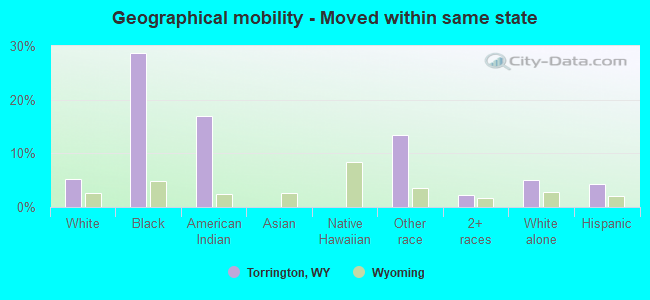
Geographical mobility - Moved from different county within same state (%)
Geographical mobility - Moved from different county within same state (%) - White
Geographical mobility - Moved from different county within same state (%) - Black or African American
Geographical mobility - Moved from different county within same state (%) - Asian
Geographical mobility - Moved from different county within same state (%) - Hispanic or Latino
Geographical mobility - Moved from different county within same state (%) - American Indian and Alaska Native
Geographical mobility - Moved from different county within same state (%) - Multirace
Geographical mobility - Moved from different county within same state (%) - Other Race
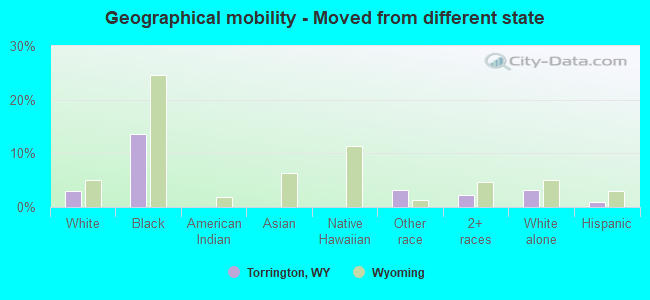
Geographical mobility - Moved from different state (%)
Geographical mobility - Moved from different state (%) - White
Geographical mobility - Moved from different state (%) - Black or African American
Geographical mobility - Moved from different state (%) - Asian
Geographical mobility - Moved from different state (%) - Hispanic or Latino
Geographical mobility - Moved from different state (%) - American Indian and Alaska Native
Geographical mobility - Moved from different state (%) - Multirace
Geographical mobility - Moved from different state (%) - Other Race
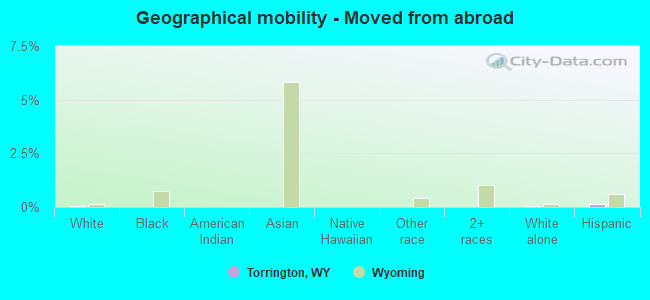
Geographical mobility - Moved from abroad (%)
Geographical mobility - Moved from abroad (%) - White
Geographical mobility - Moved from abroad (%) - Black or African American
Geographical mobility - Moved from abroad (%) - Asian
Geographical mobility - Moved from abroad (%) - Hispanic or Latino
Geographical mobility - Moved from abroad (%) - American Indian and Alaska Native
Geographical mobility - Moved from abroad (%) - Multirace
Geographical mobility - Moved from abroad (%) - Other Race
Place of birth for the foreign-born population - Ireland (%)
Place of birth for the foreign-born population - Denmark (%)
Place of birth for the foreign-born population - Norway (%)
Place of birth for the foreign-born population - Sweden (%)
Place of birth for the foreign-born population - United Kingdom (%)
Place of birth for the foreign-born population - England (%)
Place of birth for the foreign-born population - Scotland (%)
Place of birth for the foreign-born population - Other Northern Europe (%)
Place of birth for the foreign-born population - Austria (%)
Place of birth for the foreign-born population - Belgium (%)
Place of birth for the foreign-born population - France (%)
Place of birth for the foreign-born population - Germany (%)
Place of birth for the foreign-born population - Netherlands (%)
Place of birth for the foreign-born population - Switzerland (%)
Place of birth for the foreign-born population - Other Western Europe (%)
Place of birth for the foreign-born population - Greece (%)
Place of birth for the foreign-born population - Italy (%)
Place of birth for the foreign-born population - Portugal (%)
Place of birth for the foreign-born population - Spain (%)
Place of birth for the foreign-born population - Other Southern Europe (%)
Place of birth for the foreign-born population - Albania (%)
Place of birth for the foreign-born population - Belarus (%)
Place of birth for the foreign-born population - Bosnia and Herzegovina (%)
Place of birth for the foreign-born population - Bulgaria (%)
Place of birth for the foreign-born population - Croatia (%)
Place of birth for the foreign-born population - Czechoslovakia (%)
Place of birth for the foreign-born population - Hungary (%)
Place of birth for the foreign-born population - Latvia (%)
Place of birth for the foreign-born population - Lithuania (%)
Place of birth for the foreign-born population - North Macedonia (Macedonia) (%)
Place of birth for the foreign-born population - Moldova (%)
Place of birth for the foreign-born population - Poland (%)
Place of birth for the foreign-born population - Romania (%)
Place of birth for the foreign-born population - Russia (%)
Place of birth for the foreign-born population - Serbia (%)
Place of birth for the foreign-born population - Ukraine (%)
Place of birth for the foreign-born population - Other Eastern Europe (%)
Place of birth for the foreign-born population - China (%)
Place of birth for the foreign-born population - Hong Kong (%)
Place of birth for the foreign-born population - Taiwan (%)
Place of birth for the foreign-born population - Japan (%)
Place of birth for the foreign-born population - Korea (%)
Place of birth for the foreign-born population - Other Eastern Asia (%)
Place of birth for the foreign-born population - Afghanistan (%)
Place of birth for the foreign-born population - Bangladesh (%)
Place of birth for the foreign-born population - India (%)
Place of birth for the foreign-born population - Iran (%)
Place of birth for the foreign-born population - Kazakhstan (%)
Place of birth for the foreign-born population - Nepal (%)
Place of birth for the foreign-born population - Pakistan (%)
Place of birth for the foreign-born population - Sri Lanka (%)
Place of birth for the foreign-born population - Uzbekistan (%)
Place of birth for the foreign-born population - Other South Central Asia (%)
Place of birth for the foreign-born population - Burma (%)
Place of birth for the foreign-born population - Cambodia (%)
Place of birth for the foreign-born population - Indonesia (%)
Place of birth for the foreign-born population - Laos (%)
Place of birth for the foreign-born population - Malaysia (%)
Place of birth for the foreign-born population - Philippines (%)
Place of birth for the foreign-born population - Singapore (%)
Place of birth for the foreign-born population - Thailand (%)
Place of birth for the foreign-born population - Vietnam (%)
Place of birth for the foreign-born population - Other South Eastern Asia (%)
Place of birth for the foreign-born population - Armenia (%)
Place of birth for the foreign-born population - Iraq (%)
Place of birth for the foreign-born population - Israel (%)
Place of birth for the foreign-born population - Jordan (%)
Place of birth for the foreign-born population - Kuwait (%)
Place of birth for the foreign-born population - Lebanon (%)
Place of birth for the foreign-born population - Saudi Arabia (%)
Place of birth for the foreign-born population - Syria (%)
Place of birth for the foreign-born population - Turkey (%)
Place of birth for the foreign-born population - Yemen (%)
Place of birth for the foreign-born population - Other Western Asia (%)
Place of birth for the foreign-born population - Eritrea (%)
Place of birth for the foreign-born population - Ethiopia (%)
Place of birth for the foreign-born population - Kenya (%)
Place of birth for the foreign-born population - Somalia (%)
Place of birth for the foreign-born population - Uganda (%)
Place of birth for the foreign-born population - Zimbabwe (%)
Place of birth for the foreign-born population - Other Eastern Africa (%)
Place of birth for the foreign-born population - Cameroon (%)
Place of birth for the foreign-born population - Congo (%)
Place of birth for the foreign-born population - Democratic Republic of Congo (Zaire) (%)
Place of birth for the foreign-born population - Other Middle Africa (%)
Place of birth for the foreign-born population - Egypt (%)
Place of birth for the foreign-born population - Morocco (%)
Place of birth for the foreign-born population - Sudan (%)
Place of birth for the foreign-born population - Other Northern Africa (%)
Place of birth for the foreign-born population - South Africa (%)
Place of birth for the foreign-born population - Other Southern Africa (%)
Place of birth for the foreign-born population - Cabo Verde (%)
Place of birth for the foreign-born population - Ghana (%)
Place of birth for the foreign-born population - Liberia (%)
Place of birth for the foreign-born population - Nigeria (%)
Place of birth for the foreign-born population - Senegal (%)
Place of birth for the foreign-born population - Sierra Leone (%)
Place of birth for the foreign-born population - Other Western Africa (%)
Place of birth for the foreign-born population - Australia (%)
Place of birth for the foreign-born population - New Zealand (%)
Place of birth for the foreign-born population - Fiji (%)
Place of birth for the foreign-born population - Micronesia (%)
Place of birth for the foreign-born population - Bahamas (%)
Place of birth for the foreign-born population - Barbados (%)
Place of birth for the foreign-born population - Cuba (%)
Place of birth for the foreign-born population - Dominica (%)
Place of birth for the foreign-born population - Dominican Republic (%)
Place of birth for the foreign-born population - Grenada (%)
Place of birth for the foreign-born population - Haiti (%)
Place of birth for the foreign-born population - Jamaica (%)
Place of birth for the foreign-born population - St. Vincent and the Grenadines (%)
Place of birth for the foreign-born population - Trinidad and Tobago (%)
Place of birth for the foreign-born population - West Indies (%)
Place of birth for the foreign-born population - Other Caribbean (%)
Place of birth for the foreign-born population - Belize (%)
Place of birth for the foreign-born population - Costa Rica (%)
Place of birth for the foreign-born population - El Salvador (%)
Place of birth for the foreign-born population - Guatemala (%)
Place of birth for the foreign-born population - Honduras (%)
Place of birth for the foreign-born population - Mexico (%)
Place of birth for the foreign-born population - Nicaragua (%)
Place of birth for the foreign-born population - Panama (%)
Place of birth for the foreign-born population - Other Central America (%)
Place of birth for the foreign-born population - Argentina (%)
Place of birth for the foreign-born population - Bolivia (%)
Place of birth for the foreign-born population - Brazil (%)
Place of birth for the foreign-born population - Chile (%)
Place of birth for the foreign-born population - Colombia (%)
Place of birth for the foreign-born population - Ecuador (%)
Place of birth for the foreign-born population - Guyana (%)
Place of birth for the foreign-born population - Peru (%)
Place of birth for the foreign-born population - Uruguay (%)
Place of birth for the foreign-born population - Venezuela (%)
Place of birth for the foreign-born population - Other South America (%)
Place of birth for the foreign-born population - Canada (%)
Place of birth for the foreign-born population - Other Northern America (%)
Place of birth for the foreign-born population - Other (%)
Latest news about races in Torrington, WY collected exclusively by city-data.com from local newspapers, TV, and radio stations
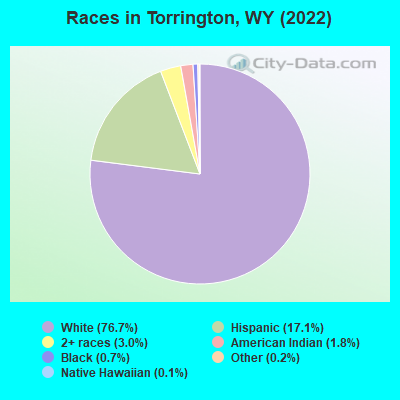
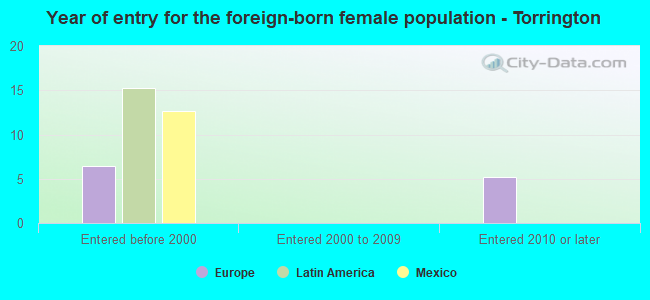
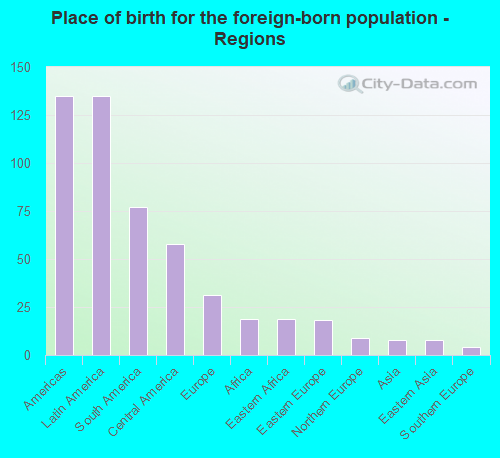
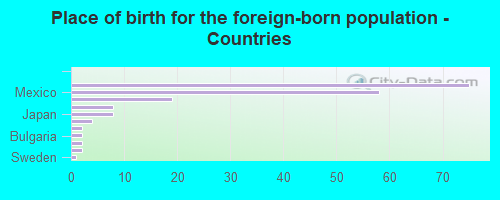
According to 2022 data, the most numerous races in Torrington, WY are White alone (4,753 residents), Hispanic (1,059 residents), and Two or more races (187 residents). 89.1% of Torrington residents speak English at home. 3.1% of Torrington, WY residents are foreign-born (2.1% born in Latin America, 0.5% born in Europe), which is 4.2% greater than the foreign-born rate of 3.0% across the entire state of Wyoming.
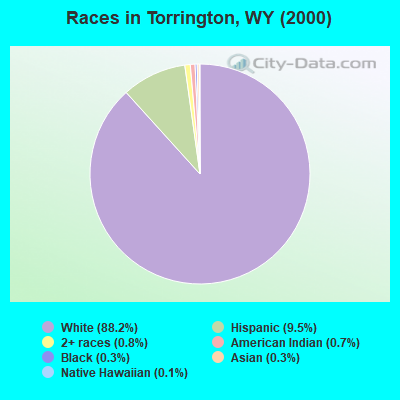
Race distribution in Torrington
2000 2022
438,799 88.9% White alone 31,669 6.4% Hispanic 10,238 2.1% American Indian alone 6,164 1.2% Two or more races 3,504 0.7% Black alone 2,670 0.5% Asian alone 474 0.10% Other race alone 264 0.05% Native Hawaiian and Other
473,220 81.4% White alone 62,803 10.8% Hispanic 22,911 3.9% Two or more races 9,589 1.6% American Indian alone 4,997 0.9% Other race alone 3,990 0.7% Black alone 3,577 0.6% Asian alone 294 0.05% Native Hawaiian and Other
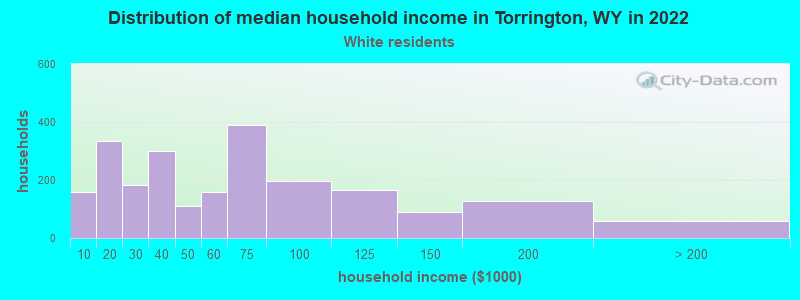
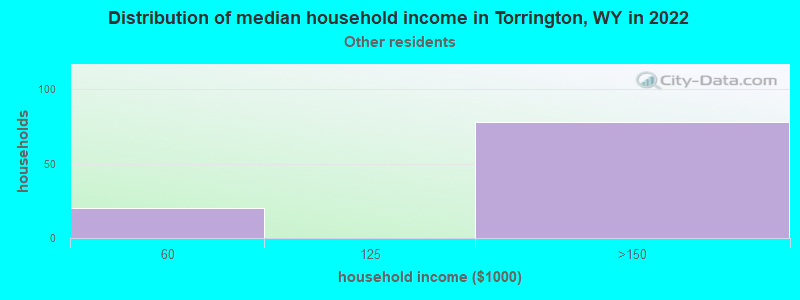
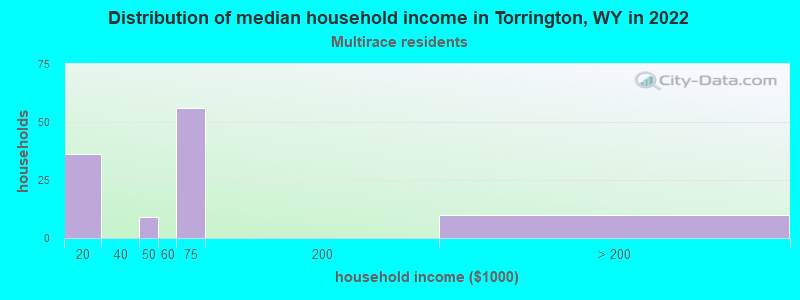
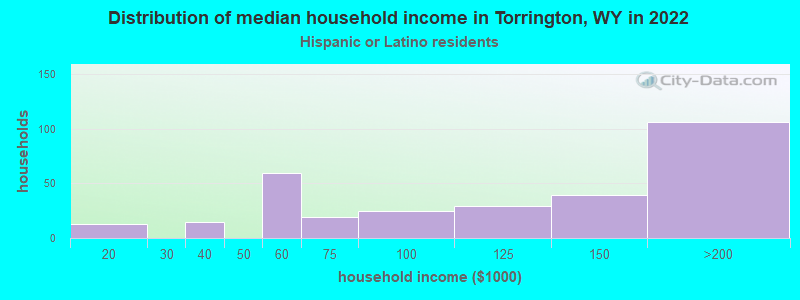
Income and house value in Torrington Median household income in 2022 $50,563 White non-Hispanic householders$132,316 Some other race householders$66,954 Two or more races householders$113,301 Hispanic or Latino race householdersMedian 2022 house value $208,415 White Non-Hispanic householders$46,640 Black or African American householders$215,877 American Indian or Alaska Native householders$159,909 Some other race householders$146,583 Two or more races householders$149,515 Hispanic or Latino householders
Median age by race in Torrington
47.6 Median age for White residents45.5 49.9 25.6 Median age for Black or African American residents27.0 -746,302,615.9 51.1 Median age for American Indian / Alaska Native residents41.9 46.9 -802,845,527.7 Median age for Asian residents-684,684,684.0 -929,503,915.5 -594,708,994.1 Median age for Native Hawaiian / Pacific Islander residents-652,729,383.8 -865,828,091.4 58.5 Median age for Other race residents63.0 33.4 7.0 Median age for Two or more races residents25.4 7.3 47.9 Median age for White alone residents44.1 51.2 41.0 Median age for Hispanic or Latino residents42.0 23.8
Owner/renter occupied households by race in Torrington
House owners and renters - White residents 1,491 67.1% Owner occupied730 32.9% Renter occupiedHouse owners and renters - American Indian / Alaska Native residents 15 100.0% Renter occupiedHouse owners and renters - Asian residents 6 100.0% Owner occupiedHouse owners and renters - Other race residents 72 100.0% Owner occupiedHouse owners and renters - Two or more races residents 25 23.7% Owner occupied80 76.3% Renter occupiedHouse owners and renters - White alone residents 1,361 65.3% Owner occupied725 34.7% Renter occupiedHouse owners and renters - Hispanic or Latino residents 224 86.0% Owner occupied36 14.0% Renter occupied
Language usage in Torrington
English speakers - Total 89.1% of residents of Torrington speak English at home.
10.3% of residents speak Spanish at home 570 94.5% Speak English very well33 5.5% Speak English less than very well0.7% of residents speak other language at home 41 97.6% Speak English very well1 2.4% Speak English less than very well
English speakers - Born in the United States 90.9% of residents of Torrington speak English at home.
8.9% of residents speak Spanish at home 292 97.0% Speak English very well9 3.0% Speak English less than very well0.4% of residents speak other language at home 12 100.0% Speak English very well
All residents speak only English at home
English speakers - Foreign-born 14.5% of residents of Torrington speak English at home.
70.3% of residents speak Spanish at home 117 96.7% Speak English very well4 3.3% Speak English less than very well11.0% of residents speak other language at home 18 94.7% Speak English very well1 5.3% Speak English less than very well
White (Caucasian) - Speak only English Native:
95.1% (4,735)Foreign-born:
3.4% (1)
White (Caucasian) - Speak another language Native:
3.6% (180)Foreign-born:
85.5% (34)
Black or African American - Speak only English Native:
100.0% (28)Foreign-born:
97.4% (19)
Other race - Speak only English Native:
36.9% (60)Foreign-born:
4.0% (1)
Other race - Speak another language Native:
58.2% (95)Foreign-born:
96.8% (23)
Two or more races - Speak another language Native:
47.1% (189)Foreign-born:
100.0% (107)
White alone - Speak only English Native:
98.8% (4,523)Foreign-born:
7.3% (2)
White alone - Speak another language Native:
1.3% (58)Foreign-born:
95.0% (20)
Hispanic or Latino - Speak only English Native:
45.4% (371)Foreign-born:
0.9% (1)
Hispanic or Latino - Speak another language Native:
54.9% (449)Foreign-born:
100.0% (125)
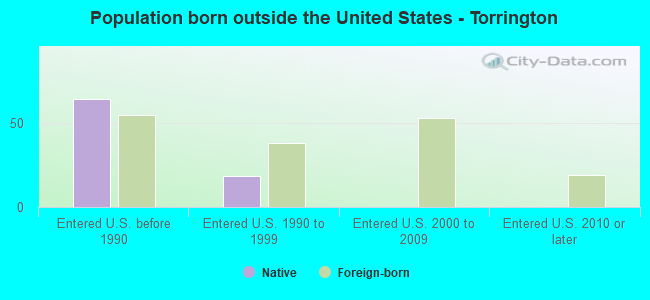
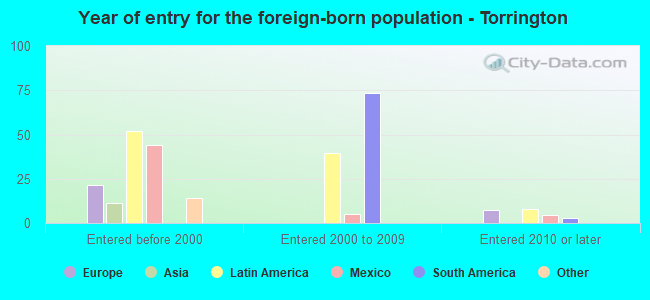
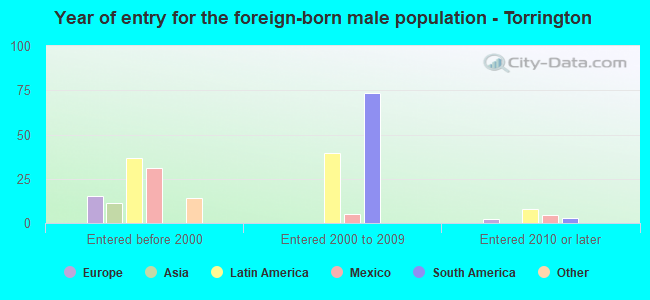
Foreign-born residents in Torrington 194 residents are foreign born (2.1% Latin America , 0.5% Europe ).
This city:
3.1%Wyoming:
3.4%
Marital status for residents in Torrington Marital status - White (Caucasian) population 15 years and over
Males 28.6% Never married46.3% Now married1.4% Separated5.0% Widowed18.7% DivorcedFemales 26.8% Never married46.6% Now married0.0% Separated15.0% Widowed11.6% DivorcedWomen who gave birth in the past 12 months Now married:
53.8% (34)Unmarried:
46.2% (29)
Women who did not give birth in the past 12 months Now married:
41.9% (418)Unmarried:
58.1% (581)
Marital status - American Indian / Alaska Native population 15 years and over
Males 53.3% Never married16.7% Now married0.0% Separated0.0% Widowed30.0% DivorcedFemales 2.0% Never married82.8% Now married0.0% Separated3.0% Widowed12.1% DivorcedWomen who did not give birth in the past 12 months Now married:
97.6% (75)Unmarried:
2.4% (2)
Marital status - Other race population 15 years and over
Males 28.2% Never married19.4% Now married0.0% Separated0.0% Widowed52.4% DivorcedFemales 8.3% Never married91.7% Now married0.0% Separated0.0% Widowed0.0% DivorcedWomen who did not give birth in the past 12 months Now married:
86.4% (23)Unmarried:
13.6% (4)
Marital status - Two or more races population 15 years and over
Males 35.6% Never married46.2% Now married0.0% Separated0.0% Widowed18.1% DivorcedFemales 70.6% Never married14.1% Now married0.0% Separated8.2% Widowed7.1% DivorcedWomen who did not give birth in the past 12 months Now married:
16.7% (18)Unmarried:
83.3% (89)
Marital status - White alone, not Hispanic / Latino population 15 years and over
Males 29.6% Never married45.8% Now married1.6% Separated4.9% Widowed18.0% DivorcedFemales 22.5% Never married47.3% Now married0.0% Separated17.0% Widowed13.1% DivorcedWomen who gave birth in the past 12 months Now married:
53.8% (34)Unmarried:
46.2% (30)
Women who did not give birth in the past 12 months Now married:
45.3% (371)Unmarried:
54.7% (448)
Marital status - Hispanic or Latino population 15 years and over
Males 24.5% Never married45.5% Now married0.0% Separated3.0% Widowed27.0% DivorcedFemales 57.6% Never married42.1% Now married0.0% Separated0.3% Widowed0.0% DivorcedWomen who did not give birth in the past 12 months Now married:
29.0% (76)Unmarried:
71.0% (186)
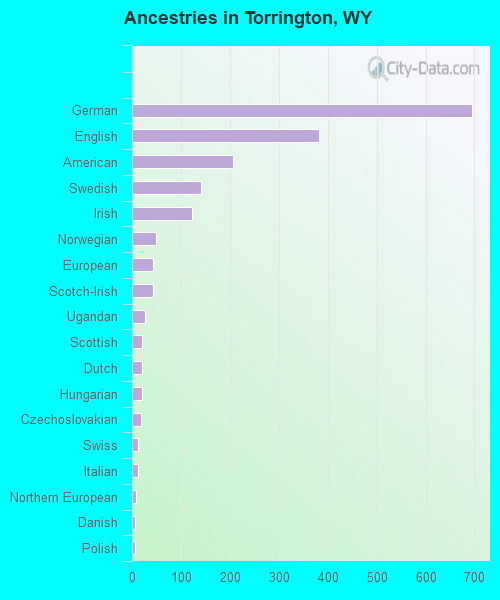
Ancestries in Torrington
695 27.5% German383 15.2% English206 8.2% American142 5.6% Swedish122 4.8% Irish49 1.9% Norwegian42 1.7% European42 1.7% Scotch-Irish27 1.1% Ugandan21 0.8% Scottish20 0.8% Dutch20 0.8% Hungarian18 0.7% Czechoslovakian13 0.5% Swiss12 0.5% Italian9 0.4% Northern European7 0.3% Danish7 0.3% Polish4 0.2% French3 0.1% Eastern European2 0.08% Arab2 0.08% Brazilian1 0.04% Basque1 0.04% Bulgarian
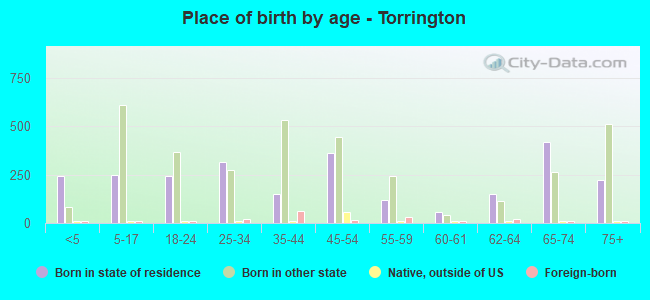
Children Nativity (place of birth) in Torrington
Children under 6 years - Living with two parents Both parents native 232 100.0% NativeOne native, one foreign-born parent 119 100.0% NativeChildren under 6 years - Living with one parent Native parent 123 100.0% Native
Children 6 to 17 years - Living with two parents Both parents native 307 100.0% NativeChildren 6 to 17 years - Living with one parent Native parent 239 100.0% Native
Grandparents responsible for own grandchildren in Torrington
Grandparents (30 to 59 years) White / Caucasian 85 84.9% Responsible for grandchildren15 15.1% Not responsible for grandchildrenWhite alone, not Hispanic / Latino 55 77.9% Responsible for grandchildren16 22.1% Not responsible for grandchildrenHispanic or Latino 58 100.0% Responsible for grandchildrenGrandparents (60 years and over) White / Caucasian 14 69.2% Responsible for grandchildren6 30.8% Not responsible for grandchildrenWhite alone, not Hispanic / Latino 15 70.6% Responsible for grandchildren6 29.4% Not responsible for grandchildren