Races in Tice, Florida (FL) Detailed Stats
Data:
Races - White alone (%)
Races - White alone (% change since 2000)
Races - Black alone (%)
Races - Black alone (% change since 2000)
Races - American Indian alone (%)
Races - American Indian alone (% change since 2000)
Races - Asian alone (%)
Races - Asian alone (% change since 2000)
Races - Hispanic (%)
Races - Hispanic (% change since 2000)
Races - Native Hawaiian and Other Pacific Islander alone (%)
Races - Native Hawaiian and Other Pacific Islander alone (% change since 2000)
Races - Two or more races(%)
Races - Two or more races(% change since 2000)
Races - Other race alone (%)
Races - Other race alone (% change since 2000)
Racial diversity
Place of birth - Born in state of residence (%)
Place of birth - Born in state of residence (%) - White
Place of birth - Born in state of residence (%) - Black or African American
Place of birth - Born in state of residence (%) - Asian
Place of birth - Born in state of residence (%) - Hispanic or Latino
Place of birth - Born in state of residence (%) - American Indian and Alaska Native
Place of birth - Born in state of residence (%) - Multirace
Place of birth - Born in state of residence (%) - Other Race
Place of birth - Born in other state (%)
Place of birth - Born in other state (%) - White
Place of birth - Born in other state (%) - Black or African American
Place of birth - Born in other state (%) - Asian
Place of birth - Born in other state (%) - Hispanic or Latino
Place of birth - Born in other state (%) - American Indian and Alaska Native
Place of birth - Born in other state (%) - Multirace
Place of birth - Born in other state (%) - Other Race
Place of birth - Native, outside of US (%)
Place of birth - Native, outside of US (%) - White
Place of birth - Native, outside of US (%) - Black or African American
Place of birth - Native, outside of US (%) - Asian
Place of birth - Native, outside of US (%) - Hispanic or Latino
Place of birth - Native, outside of US (%) - American Indian and Alaska Native
Place of birth - Native, outside of US (%) - Multirace
Place of birth - Native, outside of US (%) - Other Race
Place of birth - Foreign born (%)
Place of birth - Foreign born (%) - White
Place of birth - Foreign born (%) - Black or African American
Place of birth - Foreign born (%) - Asian
Place of birth - Foreign born (%) - Hispanic or Latino
Place of birth - Foreign born (%) - American Indian and Alaska Native
Place of birth - Foreign born (%) - Multirace
Place of birth - Foreign born (%) - Other Race
Residents speaking English at home (%)
Residents speaking English at home - Born in the United States (%)
Residents speaking English at home - Native, born elsewhere (%)
Residents speaking English at home - Foreign born (%)
Residents speaking Spanish at home (%)
Residents speaking Spanish at home - Born in the United States (%)
Residents speaking Spanish at home - Native, born elsewhere (%)
Residents speaking Spanish at home - Foreign born (%)
Residents speaking other language at home (%)
Residents speaking other language at home - Born in the United States (%)
Residents speaking other language at home - Native, born elsewhere (%)
Residents speaking other language at home - Foreign born (%)
Marital status - Never married (%)
Marital status - Now married (%)
Marital status - Separated (%)
Marital status - Widowed (%)
Marital status - Divorced (%)
Ancestries Reported - Arab (%)
Ancestries Reported - Czech (%)
Ancestries Reported - Danish (%)
Ancestries Reported - Dutch (%)
Ancestries Reported - English (%)
Ancestries Reported - French (%)
Ancestries Reported - French Canadian (%)
Ancestries Reported - German (%)
Ancestries Reported - Greek (%)
Ancestries Reported - Hungarian (%)
Ancestries Reported - Irish (%)
Ancestries Reported - Italian (%)
Ancestries Reported - Lithuanian (%)
Ancestries Reported - Norwegian (%)
Ancestries Reported - Polish (%)
Ancestries Reported - Portuguese (%)
Ancestries Reported - Russian (%)
Ancestries Reported - Scotch-Irish (%)
Ancestries Reported - Scottish (%)
Ancestries Reported - Slovak (%)
Ancestries Reported - Subsaharan African (%)
Ancestries Reported - Swedish (%)
Ancestries Reported - Swiss (%)
Ancestries Reported - Ukrainian (%)
Ancestries Reported - United States (%)
Ancestries Reported - Welsh (%)
Ancestries Reported - West Indian (%)
Ancestries Reported - Other (%)
Geographical mobility - Same house 1 year ago (%)
Geographical mobility - Same house 1 year ago (%) - White
Geographical mobility - Same house 1 year ago (%) - Black or African American
Geographical mobility - Same house 1 year ago (%) - Asian
Geographical mobility - Same house 1 year ago (%) - Hispanic or Latino
Geographical mobility - Same house 1 year ago (%) - American Indian and Alaska Native
Geographical mobility - Same house 1 year ago (%) - Multirace
Geographical mobility - Same house 1 year ago (%) - Other Race
Geographical mobility - Moved within same county (%)
Geographical mobility - Moved within same county (%) - White
Geographical mobility - Moved within same county (%) - Black or African American
Geographical mobility - Moved within same county (%) - Asian
Geographical mobility - Moved within same county (%) - Hispanic or Latino
Geographical mobility - Moved within same county (%) - American Indian and Alaska Native
Geographical mobility - Moved within same county (%) - Multirace
Geographical mobility - Moved within same county (%) - Other Race
Geographical mobility - Moved from different county within same state (%)
Geographical mobility - Moved from different county within same state (%) - White
Geographical mobility - Moved from different county within same state (%) - Black or African American
Geographical mobility - Moved from different county within same state (%) - Asian
Geographical mobility - Moved from different county within same state (%) - Hispanic or Latino
Geographical mobility - Moved from different county within same state (%) - American Indian and Alaska Native
Geographical mobility - Moved from different county within same state (%) - Multirace
Geographical mobility - Moved from different county within same state (%) - Other Race
Geographical mobility - Moved from different state (%)
Geographical mobility - Moved from different state (%) - White
Geographical mobility - Moved from different state (%) - Black or African American
Geographical mobility - Moved from different state (%) - Asian
Geographical mobility - Moved from different state (%) - Hispanic or Latino
Geographical mobility - Moved from different state (%) - American Indian and Alaska Native
Geographical mobility - Moved from different state (%) - Multirace
Geographical mobility - Moved from different state (%) - Other Race
Geographical mobility - Moved from abroad (%)
Geographical mobility - Moved from abroad (%) - White
Geographical mobility - Moved from abroad (%) - Black or African American
Geographical mobility - Moved from abroad (%) - Asian
Geographical mobility - Moved from abroad (%) - Hispanic or Latino
Geographical mobility - Moved from abroad (%) - American Indian and Alaska Native
Geographical mobility - Moved from abroad (%) - Multirace
Geographical mobility - Moved from abroad (%) - Other Race
Place of birth for the foreign-born population - Ireland (%)
Place of birth for the foreign-born population - Denmark (%)
Place of birth for the foreign-born population - Norway (%)
Place of birth for the foreign-born population - Sweden (%)
Place of birth for the foreign-born population - United Kingdom (%)
Place of birth for the foreign-born population - England (%)
Place of birth for the foreign-born population - Scotland (%)
Place of birth for the foreign-born population - Other Northern Europe (%)
Place of birth for the foreign-born population - Austria (%)
Place of birth for the foreign-born population - Belgium (%)
Place of birth for the foreign-born population - France (%)
Place of birth for the foreign-born population - Germany (%)
Place of birth for the foreign-born population - Netherlands (%)
Place of birth for the foreign-born population - Switzerland (%)
Place of birth for the foreign-born population - Other Western Europe (%)
Place of birth for the foreign-born population - Greece (%)
Place of birth for the foreign-born population - Italy (%)
Place of birth for the foreign-born population - Portugal (%)
Place of birth for the foreign-born population - Spain (%)
Place of birth for the foreign-born population - Other Southern Europe (%)
Place of birth for the foreign-born population - Albania (%)
Place of birth for the foreign-born population - Belarus (%)
Place of birth for the foreign-born population - Bosnia and Herzegovina (%)
Place of birth for the foreign-born population - Bulgaria (%)
Place of birth for the foreign-born population - Croatia (%)
Place of birth for the foreign-born population - Czechoslovakia (%)
Place of birth for the foreign-born population - Hungary (%)
Place of birth for the foreign-born population - Latvia (%)
Place of birth for the foreign-born population - Lithuania (%)
Place of birth for the foreign-born population - North Macedonia (Macedonia) (%)
Place of birth for the foreign-born population - Moldova (%)
Place of birth for the foreign-born population - Poland (%)
Place of birth for the foreign-born population - Romania (%)
Place of birth for the foreign-born population - Russia (%)
Place of birth for the foreign-born population - Serbia (%)
Place of birth for the foreign-born population - Ukraine (%)
Place of birth for the foreign-born population - Other Eastern Europe (%)
Place of birth for the foreign-born population - China (%)
Place of birth for the foreign-born population - Hong Kong (%)
Place of birth for the foreign-born population - Taiwan (%)
Place of birth for the foreign-born population - Japan (%)
Place of birth for the foreign-born population - Korea (%)
Place of birth for the foreign-born population - Other Eastern Asia (%)
Place of birth for the foreign-born population - Afghanistan (%)
Place of birth for the foreign-born population - Bangladesh (%)
Place of birth for the foreign-born population - India (%)
Place of birth for the foreign-born population - Iran (%)
Place of birth for the foreign-born population - Kazakhstan (%)
Place of birth for the foreign-born population - Nepal (%)
Place of birth for the foreign-born population - Pakistan (%)
Place of birth for the foreign-born population - Sri Lanka (%)
Place of birth for the foreign-born population - Uzbekistan (%)
Place of birth for the foreign-born population - Other South Central Asia (%)
Place of birth for the foreign-born population - Burma (%)
Place of birth for the foreign-born population - Cambodia (%)
Place of birth for the foreign-born population - Indonesia (%)
Place of birth for the foreign-born population - Laos (%)
Place of birth for the foreign-born population - Malaysia (%)
Place of birth for the foreign-born population - Philippines (%)
Place of birth for the foreign-born population - Singapore (%)
Place of birth for the foreign-born population - Thailand (%)
Place of birth for the foreign-born population - Vietnam (%)
Place of birth for the foreign-born population - Other South Eastern Asia (%)
Place of birth for the foreign-born population - Armenia (%)
Place of birth for the foreign-born population - Iraq (%)
Place of birth for the foreign-born population - Israel (%)
Place of birth for the foreign-born population - Jordan (%)
Place of birth for the foreign-born population - Kuwait (%)
Place of birth for the foreign-born population - Lebanon (%)
Place of birth for the foreign-born population - Saudi Arabia (%)
Place of birth for the foreign-born population - Syria (%)
Place of birth for the foreign-born population - Turkey (%)
Place of birth for the foreign-born population - Yemen (%)
Place of birth for the foreign-born population - Other Western Asia (%)
Place of birth for the foreign-born population - Eritrea (%)
Place of birth for the foreign-born population - Ethiopia (%)
Place of birth for the foreign-born population - Kenya (%)
Place of birth for the foreign-born population - Somalia (%)
Place of birth for the foreign-born population - Uganda (%)
Place of birth for the foreign-born population - Zimbabwe (%)
Place of birth for the foreign-born population - Other Eastern Africa (%)
Place of birth for the foreign-born population - Cameroon (%)
Place of birth for the foreign-born population - Congo (%)
Place of birth for the foreign-born population - Democratic Republic of Congo (Zaire) (%)
Place of birth for the foreign-born population - Other Middle Africa (%)
Place of birth for the foreign-born population - Egypt (%)
Place of birth for the foreign-born population - Morocco (%)
Place of birth for the foreign-born population - Sudan (%)
Place of birth for the foreign-born population - Other Northern Africa (%)
Place of birth for the foreign-born population - South Africa (%)
Place of birth for the foreign-born population - Other Southern Africa (%)
Place of birth for the foreign-born population - Cabo Verde (%)
Place of birth for the foreign-born population - Ghana (%)
Place of birth for the foreign-born population - Liberia (%)
Place of birth for the foreign-born population - Nigeria (%)
Place of birth for the foreign-born population - Senegal (%)
Place of birth for the foreign-born population - Sierra Leone (%)
Place of birth for the foreign-born population - Other Western Africa (%)
Place of birth for the foreign-born population - Australia (%)
Place of birth for the foreign-born population - New Zealand (%)
Place of birth for the foreign-born population - Fiji (%)
Place of birth for the foreign-born population - Micronesia (%)
Place of birth for the foreign-born population - Bahamas (%)
Place of birth for the foreign-born population - Barbados (%)
Place of birth for the foreign-born population - Cuba (%)
Place of birth for the foreign-born population - Dominica (%)
Place of birth for the foreign-born population - Dominican Republic (%)
Place of birth for the foreign-born population - Grenada (%)
Place of birth for the foreign-born population - Haiti (%)
Place of birth for the foreign-born population - Jamaica (%)
Place of birth for the foreign-born population - St. Vincent and the Grenadines (%)
Place of birth for the foreign-born population - Trinidad and Tobago (%)
Place of birth for the foreign-born population - West Indies (%)
Place of birth for the foreign-born population - Other Caribbean (%)
Place of birth for the foreign-born population - Belize (%)
Place of birth for the foreign-born population - Costa Rica (%)
Place of birth for the foreign-born population - El Salvador (%)
Place of birth for the foreign-born population - Guatemala (%)
Place of birth for the foreign-born population - Honduras (%)
Place of birth for the foreign-born population - Mexico (%)
Place of birth for the foreign-born population - Nicaragua (%)
Place of birth for the foreign-born population - Panama (%)
Place of birth for the foreign-born population - Other Central America (%)
Place of birth for the foreign-born population - Argentina (%)
Place of birth for the foreign-born population - Bolivia (%)
Place of birth for the foreign-born population - Brazil (%)
Place of birth for the foreign-born population - Chile (%)
Place of birth for the foreign-born population - Colombia (%)
Place of birth for the foreign-born population - Ecuador (%)
Place of birth for the foreign-born population - Guyana (%)
Place of birth for the foreign-born population - Peru (%)
Place of birth for the foreign-born population - Uruguay (%)
Place of birth for the foreign-born population - Venezuela (%)
Place of birth for the foreign-born population - Other South America (%)
Place of birth for the foreign-born population - Canada (%)
Place of birth for the foreign-born population - Other Northern America (%)
Place of birth for the foreign-born population - Other (%)
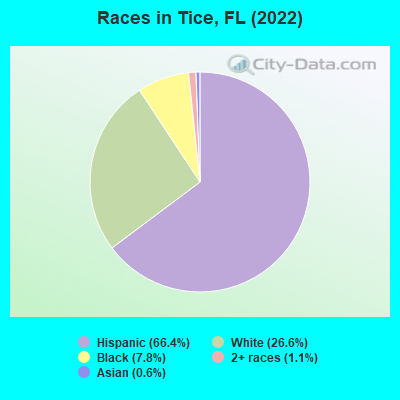
According to 2022 data, the most numerous races in Tice, FL are White alone (1,549 residents), Hispanic (3,861 residents), and Black alone (452 residents). 38.1% of Tice residents speak English at home. 34.2% of Tice, FL residents are foreign-born (33.0% born in Latin America), which is 38.7% greater than the foreign-born rate of 21.0% across the entire state of Florida.
Race distribution in Tice
2000 2022
10,458,509 65.4% White alone 2,682,715 16.8% Hispanic 2,264,268 14.2% Black alone 261,693 1.6% Asian alone 236,954 1.5% Two or more races 42,358 0.3% American Indian alone 28,994 0.2% Other race alone 6,887 0.04% Native Hawaiian and Other
11,309,403 50.8% White alone 6,025,039 27.1% Hispanic 3,241,015 14.6% Black alone 861,630 3.9% Two or more races 623,692 2.8% Asian alone 152,054 0.7% Other race alone 22,504 0.1% American Indian alone 9,486 0.04% Native Hawaiian and Other
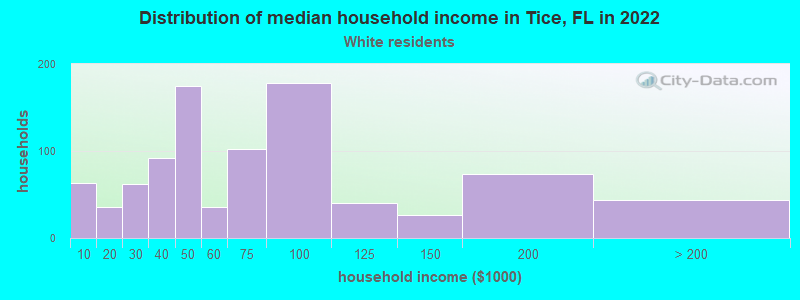
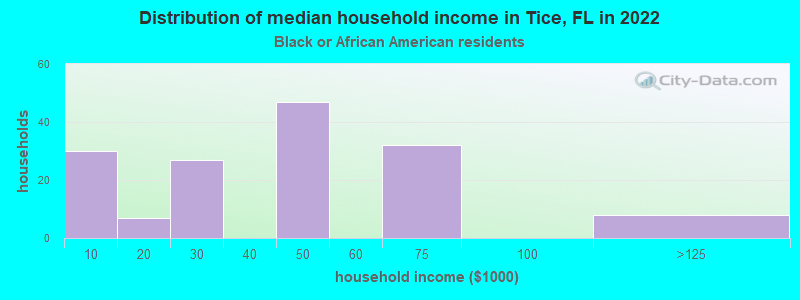
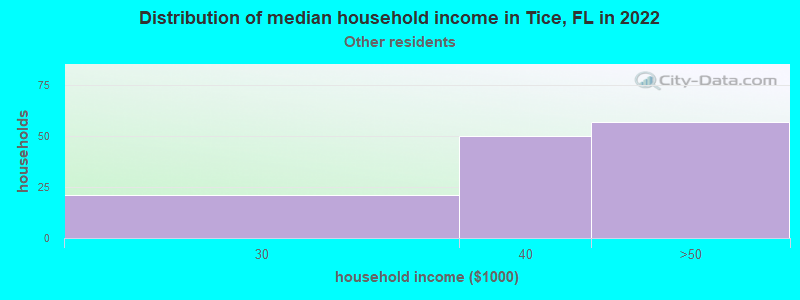
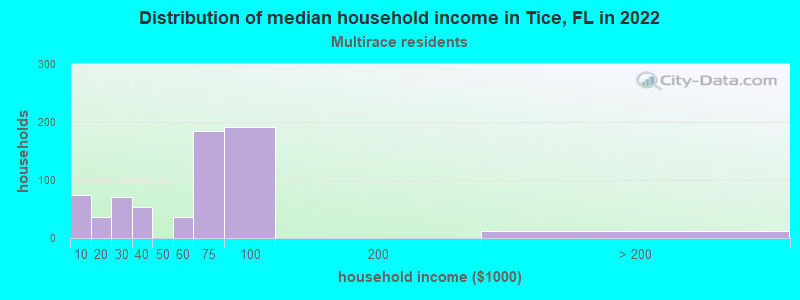
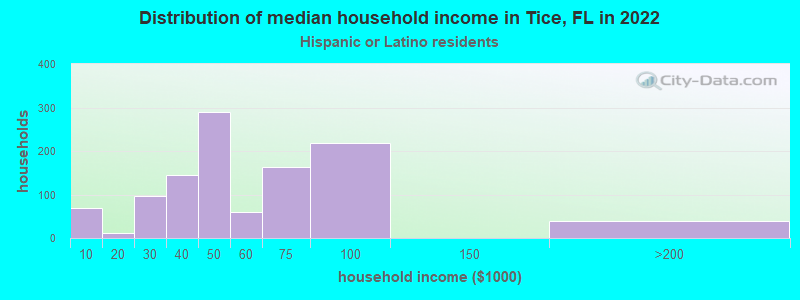
Income and house value in Tice Median household income in 2022 $66,682 White non-Hispanic householders$35,503 Some other race householders$65,486 Two or more races householders$47,426 Hispanic or Latino race householdersMedian 2022 house value $230,559 White Non-Hispanic householders$231,661 Black or African American householders$187,605 Some other race householders$242,308 Two or more races householders$227,622 Hispanic or Latino householders
Median age by race in Tice
30.5 Median age for White residents31.6 29.7 47.1 Median age for Black or African American residents45.8 66.3 -562,189,054.2 Median age for American Indian / Alaska Native residents-558,080,807.5 -402,449,693.4 -631,031,922.2 Median age for Asian residents-664,939,550.3 -628,178,693.5 -1,092,290,987.0 Median age for Native Hawaiian / Pacific Islander residents-858,307,848.3 -800,880,087.2 40.4 Median age for Other race residents19.2 41.5 31.3 Median age for Two or more races residents31.0 33.7 45.8 Median age for White alone residents48.4 44.2 22.9 Median age for Hispanic or Latino residents22.7 25.8
Owner/renter occupied households by race in Tice
House owners and renters - White residents 508 55.9% Owner occupied401 44.1% Renter occupiedHouse owners and renters - Black or African American residents 69 50.6% Owner occupied67 49.4% Renter occupiedHouse owners and renters - Asian residents 23 100.0% Renter occupiedHouse owners and renters - Other race residents 118 100.0% Renter occupiedHouse owners and renters - Two or more races residents 322 45.5% Owner occupied385 54.5% Renter occupiedHouse owners and renters - White alone residents 428 74.4% Owner occupied147 25.6% Renter occupiedHouse owners and renters - Hispanic or Latino residents 321 31.4% Owner occupied702 68.6% Renter occupied
Language usage in Tice
English speakers - Total 38.1% of residents of Tice speak English at home.
63.2% of residents speak Spanish at home 1,537 44.2% Speak English very well1,937 55.8% Speak English less than very well2.5% of residents speak other language at home 125 91.2% Speak English very well12 8.8% Speak English less than very well
English speakers - Born in the United States 74.9% of residents of Tice speak English at home.
26.2% of residents speak Spanish at home 365 86.3% Speak English very well58 13.7% Speak English less than very well1.1% of residents speak other language at home 18 100.0% Speak English very well
English speakers - Native, born elsewhere 7.0% of residents of Tice speak English at home.
90.8% of residents speak Spanish at home 153 61.9% Speak English very well94 38.1% Speak English less than very well4.0% of residents speak other language at home 11 100.0% Speak English very well
English speakers - Foreign-born 15.3% of residents of Tice speak English at home.
84.7% of residents speak Spanish at home 166 9.0% Speak English very well1,678 91.0% Speak English less than very well3.6% of residents speak other language at home 66 83.5% Speak English very well13 16.5% Speak English less than very well
White (Caucasian) - Speak only English Native:
57.8% (1,194)Foreign-born:
18.2% (104)
White (Caucasian) - Speak another language Native:
28.3% (585)Foreign-born:
70.9% (407)
Black or African American - Speak only English Native:
97.8% (388)Foreign-born:
100.0% (10)
Other race - Speak only English Native:
33.2% (47)Foreign-born:
30.1% (41)
Other race - Speak another language Native:
66.6% (94)Foreign-born:
69.9% (96)
Two or more races - Speak only English Native:
8.5% (90)Foreign-born:
15.3% (228)
Two or more races - Speak another language Native:
100.0% (1,059)Foreign-born:
84.8% (1,265)
White alone - Speak only English Native:
87.5% (1,064)Foreign-born:
24.4% (60)
White alone - Speak another language Native:
12.3% (150)Foreign-born:
73.1% (178)
Hispanic or Latino - Speak only English Native:
13.3% (240)Foreign-born:
11.6% (210)
Hispanic or Latino - Speak another language Native:
90.6% (1,636)Foreign-born:
87.8% (1,584)
Foreign-born residents in Tice 1,993 residents are foreign born (33.0% Latin America ).
This city:
34.2%Florida:
21.1%
Marital status for residents in Tice Marital status - White (Caucasian) population 15 years and over
Males 55.2% Never married33.4% Now married2.7% Separated1.9% Widowed6.8% DivorcedFemales 41.1% Never married45.7% Now married0.0% Separated6.4% Widowed6.8% DivorcedWomen who did not give birth in the past 12 months Now married:
46.0% (279)Unmarried:
54.0% (329)
Marital status - Black or African American population 15 years and over
Males 56.1% Never married33.4% Now married10.5% Separated0.0% Widowed0.0% DivorcedFemales 77.3% Never married8.3% Now married0.0% Separated6.1% Widowed8.3% DivorcedWomen who did not give birth in the past 12 months Now married:
11.9% (5)Unmarried:
88.1% (39)
Marital status - Asian population 15 years and over
Males 0.0% Never married100.0% Now married0.0% Separated0.0% Widowed0.0% DivorcedFemales 0.0% Never married100.0% Now married0.0% Separated0.0% Widowed0.0% DivorcedWomen who did not give birth in the past 12 months Now married:
100.0% (10)Unmarried:
0.0% (0)
Marital status - Other race population 15 years and over
Males 65.3% Never married18.6% Now married0.0% Separated0.0% Widowed16.1% DivorcedFemales 51.2% Never married48.8% Now married0.0% Separated0.0% Widowed0.0% DivorcedWomen who gave birth in the past 12 months Now married:
100.0% (16)Unmarried:
0.0% (0)
Women who did not give birth in the past 12 months Now married:
42.0% (50)Unmarried:
58.0% (69)
Marital status - Two or more races population 15 years and over
Males 57.8% Never married31.2% Now married0.0% Separated4.8% Widowed6.1% DivorcedFemales 42.4% Never married32.1% Now married0.0% Separated15.6% Widowed9.9% DivorcedWomen who gave birth in the past 12 months Now married:
30.0% (43)Unmarried:
70.0% (99)
Women who did not give birth in the past 12 months Now married:
33.3% (165)Unmarried:
66.7% (330)
Marital status - White alone, not Hispanic / Latino population 15 years and over
Males 42.4% Never married34.7% Now married5.4% Separated3.9% Widowed13.7% DivorcedFemales 39.3% Never married42.4% Now married0.0% Separated7.6% Widowed10.7% DivorcedWomen who did not give birth in the past 12 months Now married:
37.8% (126)Unmarried:
62.2% (207)
Marital status - Hispanic or Latino population 15 years and over
Males 62.8% Never married31.0% Now married0.0% Separated2.1% Widowed4.1% DivorcedFemales 45.5% Never married41.5% Now married0.0% Separated7.8% Widowed5.1% DivorcedWomen who gave birth in the past 12 months Now married:
43.4% (48)Unmarried:
56.6% (62)
Women who did not give birth in the past 12 months Now married:
44.2% (376)Unmarried:
55.8% (476)
Ancestries in Tice
97 2.6% American75 2.0% German71 1.9% English32 0.9% Scotch-Irish30 0.8% Italian29 0.8% Polish26 0.7% Dutch15 0.4% Irish15 0.4% Norwegian5 0.1% Romanian
Children Nativity (place of birth) in Tice
Children under 6 years - Living with two parents Both parents foreign-born 208 83.4% Native41 16.6% Foreign-bornChildren under 6 years - Living with one parent Native parent 124 100.0% NativeForeign-born parent 61 100.0% NativeChildren 6 to 17 years - Living with two parents Both parents native 42 100.0% NativeBoth parents foreign-born 755 96.0% Native31 4.0% Foreign-bornChildren 6 to 17 years - Living with one parent Native parent 112 100.0% NativeForeign-born parent 126 60.3% Native83 39.7% Foreign-born
Grandparents responsible for own grandchildren in Tice
Grandparents (30 to 59 years) Other race 34 100.0% Responsible for grandchildrenHispanic or Latino 33 100.0% Responsible for grandchildren
Grandparents (60 years and over)