Races in Terrell, Texas (TX) Detailed Stats
Data:
Races - White alone (%)
Races - White alone (% change since 2000)
Races - Black alone (%)
Races - Black alone (% change since 2000)
Races - American Indian alone (%)
Races - American Indian alone (% change since 2000)
Races - Asian alone (%)
Races - Asian alone (% change since 2000)
Races - Hispanic (%)
Races - Hispanic (% change since 2000)
Races - Native Hawaiian and Other Pacific Islander alone (%)
Races - Native Hawaiian and Other Pacific Islander alone (% change since 2000)
Races - Two or more races(%)
Races - Two or more races(% change since 2000)
Races - Other race alone (%)
Races - Other race alone (% change since 2000)
Racial diversity
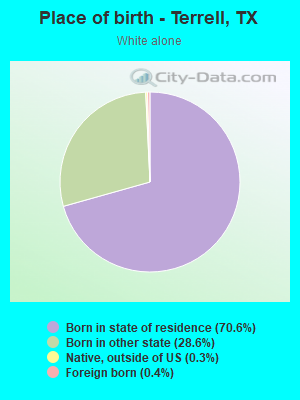
Place of birth - Born in state of residence (%)
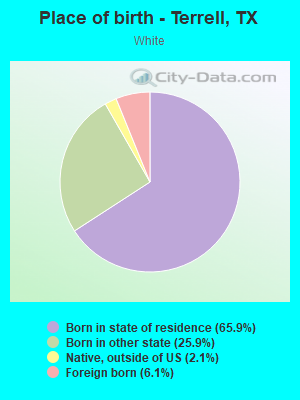
Place of birth - Born in state of residence (%) - White
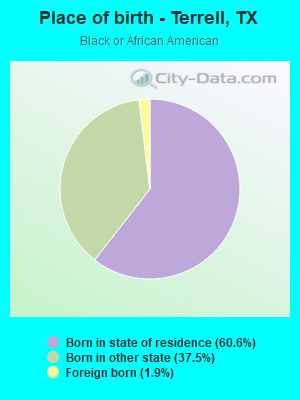
Place of birth - Born in state of residence (%) - Black or African American
Place of birth - Born in state of residence (%) - Asian
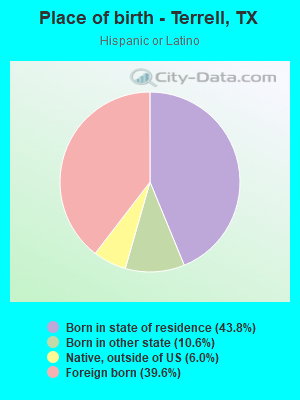
Place of birth - Born in state of residence (%) - Hispanic or Latino
Place of birth - Born in state of residence (%) - American Indian and Alaska Native
Place of birth - Born in state of residence (%) - Multirace
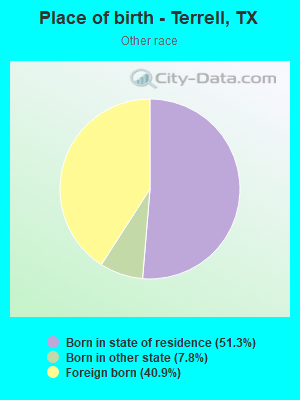
Place of birth - Born in state of residence (%) - Other Race
Place of birth - Born in other state (%)
Place of birth - Born in other state (%) - White
Place of birth - Born in other state (%) - Black or African American
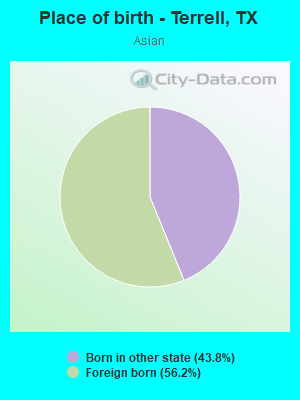
Place of birth - Born in other state (%) - Asian
Place of birth - Born in other state (%) - Hispanic or Latino
Place of birth - Born in other state (%) - American Indian and Alaska Native
Place of birth - Born in other state (%) - Multirace
Place of birth - Born in other state (%) - Other Race
Place of birth - Native, outside of US (%)
Place of birth - Native, outside of US (%) - White
Place of birth - Native, outside of US (%) - Black or African American
Place of birth - Native, outside of US (%) - Asian
Place of birth - Native, outside of US (%) - Hispanic or Latino
Place of birth - Native, outside of US (%) - American Indian and Alaska Native
Place of birth - Native, outside of US (%) - Multirace
Place of birth - Native, outside of US (%) - Other Race
Place of birth - Foreign born (%)
Place of birth - Foreign born (%) - White
Place of birth - Foreign born (%) - Black or African American
Place of birth - Foreign born (%) - Asian
Place of birth - Foreign born (%) - Hispanic or Latino
Place of birth - Foreign born (%) - American Indian and Alaska Native
Place of birth - Foreign born (%) - Multirace
Place of birth - Foreign born (%) - Other Race
Residents speaking English at home (%)
Residents speaking English at home - Born in the United States (%)
Residents speaking English at home - Native, born elsewhere (%)
Residents speaking English at home - Foreign born (%)
Residents speaking Spanish at home (%)
Residents speaking Spanish at home - Born in the United States (%)
Residents speaking Spanish at home - Native, born elsewhere (%)
Residents speaking Spanish at home - Foreign born (%)
Residents speaking other language at home (%)
Residents speaking other language at home - Born in the United States (%)
Residents speaking other language at home - Native, born elsewhere (%)
Residents speaking other language at home - Foreign born (%)
Marital status - Never married (%)
Marital status - Now married (%)
Marital status - Separated (%)
Marital status - Widowed (%)
Marital status - Divorced (%)
Ancestries Reported - Arab (%)
Ancestries Reported - Czech (%)
Ancestries Reported - Danish (%)
Ancestries Reported - Dutch (%)
Ancestries Reported - English (%)
Ancestries Reported - French (%)
Ancestries Reported - French Canadian (%)
Ancestries Reported - German (%)
Ancestries Reported - Greek (%)
Ancestries Reported - Hungarian (%)
Ancestries Reported - Irish (%)
Ancestries Reported - Italian (%)
Ancestries Reported - Lithuanian (%)
Ancestries Reported - Norwegian (%)
Ancestries Reported - Polish (%)
Ancestries Reported - Portuguese (%)
Ancestries Reported - Russian (%)
Ancestries Reported - Scotch-Irish (%)
Ancestries Reported - Scottish (%)
Ancestries Reported - Slovak (%)
Ancestries Reported - Subsaharan African (%)
Ancestries Reported - Swedish (%)
Ancestries Reported - Swiss (%)
Ancestries Reported - Ukrainian (%)
Ancestries Reported - United States (%)
Ancestries Reported - Welsh (%)
Ancestries Reported - West Indian (%)
Ancestries Reported - Other (%)
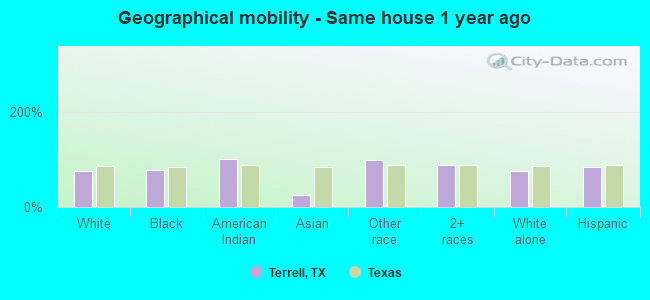
Geographical mobility - Same house 1 year ago (%)
Geographical mobility - Same house 1 year ago (%) - White
Geographical mobility - Same house 1 year ago (%) - Black or African American
Geographical mobility - Same house 1 year ago (%) - Asian
Geographical mobility - Same house 1 year ago (%) - Hispanic or Latino
Geographical mobility - Same house 1 year ago (%) - American Indian and Alaska Native
Geographical mobility - Same house 1 year ago (%) - Multirace
Geographical mobility - Same house 1 year ago (%) - Other Race
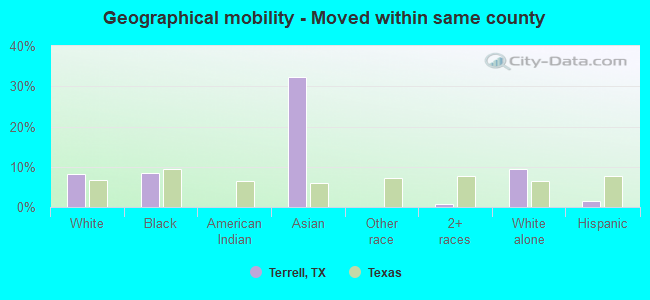
Geographical mobility - Moved within same county (%)
Geographical mobility - Moved within same county (%) - White
Geographical mobility - Moved within same county (%) - Black or African American
Geographical mobility - Moved within same county (%) - Asian
Geographical mobility - Moved within same county (%) - Hispanic or Latino
Geographical mobility - Moved within same county (%) - American Indian and Alaska Native
Geographical mobility - Moved within same county (%) - Multirace
Geographical mobility - Moved within same county (%) - Other Race
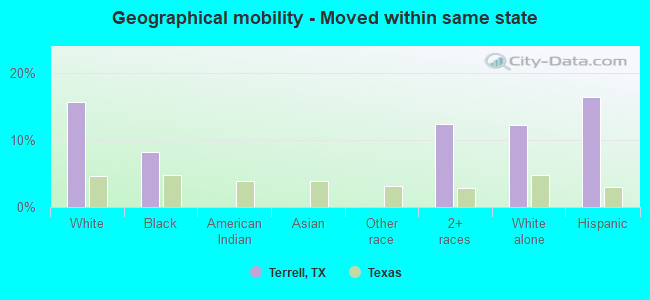
Geographical mobility - Moved from different county within same state (%)
Geographical mobility - Moved from different county within same state (%) - White
Geographical mobility - Moved from different county within same state (%) - Black or African American
Geographical mobility - Moved from different county within same state (%) - Asian
Geographical mobility - Moved from different county within same state (%) - Hispanic or Latino
Geographical mobility - Moved from different county within same state (%) - American Indian and Alaska Native
Geographical mobility - Moved from different county within same state (%) - Multirace
Geographical mobility - Moved from different county within same state (%) - Other Race
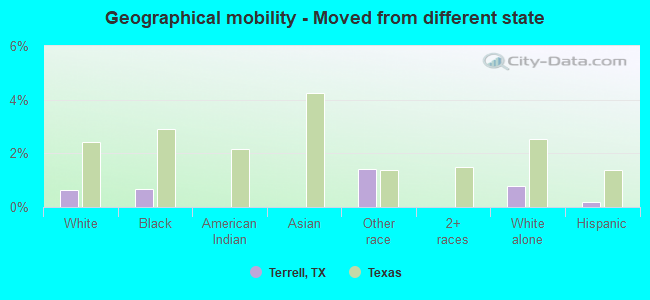
Geographical mobility - Moved from different state (%)
Geographical mobility - Moved from different state (%) - White
Geographical mobility - Moved from different state (%) - Black or African American
Geographical mobility - Moved from different state (%) - Asian
Geographical mobility - Moved from different state (%) - Hispanic or Latino
Geographical mobility - Moved from different state (%) - American Indian and Alaska Native
Geographical mobility - Moved from different state (%) - Multirace
Geographical mobility - Moved from different state (%) - Other Race
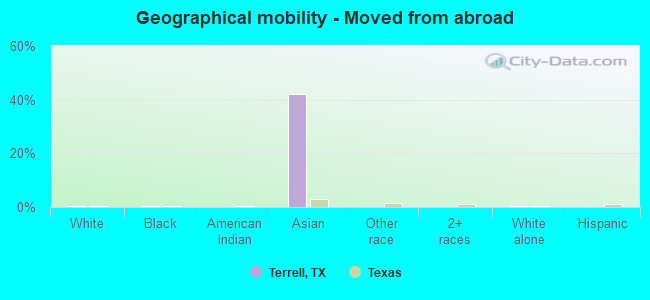
Geographical mobility - Moved from abroad (%)
Geographical mobility - Moved from abroad (%) - White
Geographical mobility - Moved from abroad (%) - Black or African American
Geographical mobility - Moved from abroad (%) - Asian
Geographical mobility - Moved from abroad (%) - Hispanic or Latino
Geographical mobility - Moved from abroad (%) - American Indian and Alaska Native
Geographical mobility - Moved from abroad (%) - Multirace
Geographical mobility - Moved from abroad (%) - Other Race
Place of birth for the foreign-born population - Ireland (%)
Place of birth for the foreign-born population - Denmark (%)
Place of birth for the foreign-born population - Norway (%)
Place of birth for the foreign-born population - Sweden (%)
Place of birth for the foreign-born population - United Kingdom (%)
Place of birth for the foreign-born population - England (%)
Place of birth for the foreign-born population - Scotland (%)
Place of birth for the foreign-born population - Other Northern Europe (%)
Place of birth for the foreign-born population - Austria (%)
Place of birth for the foreign-born population - Belgium (%)
Place of birth for the foreign-born population - France (%)
Place of birth for the foreign-born population - Germany (%)
Place of birth for the foreign-born population - Netherlands (%)
Place of birth for the foreign-born population - Switzerland (%)
Place of birth for the foreign-born population - Other Western Europe (%)
Place of birth for the foreign-born population - Greece (%)
Place of birth for the foreign-born population - Italy (%)
Place of birth for the foreign-born population - Portugal (%)
Place of birth for the foreign-born population - Spain (%)
Place of birth for the foreign-born population - Other Southern Europe (%)
Place of birth for the foreign-born population - Albania (%)
Place of birth for the foreign-born population - Belarus (%)
Place of birth for the foreign-born population - Bosnia and Herzegovina (%)
Place of birth for the foreign-born population - Bulgaria (%)
Place of birth for the foreign-born population - Croatia (%)
Place of birth for the foreign-born population - Czechoslovakia (%)
Place of birth for the foreign-born population - Hungary (%)
Place of birth for the foreign-born population - Latvia (%)
Place of birth for the foreign-born population - Lithuania (%)
Place of birth for the foreign-born population - North Macedonia (Macedonia) (%)
Place of birth for the foreign-born population - Moldova (%)
Place of birth for the foreign-born population - Poland (%)
Place of birth for the foreign-born population - Romania (%)
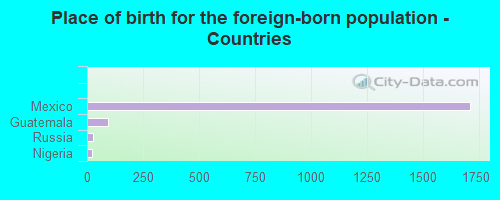
Place of birth for the foreign-born population - Russia (%)
Place of birth for the foreign-born population - Serbia (%)
Place of birth for the foreign-born population - Ukraine (%)
Place of birth for the foreign-born population - Other Eastern Europe (%)
Place of birth for the foreign-born population - China (%)
Place of birth for the foreign-born population - Hong Kong (%)
Place of birth for the foreign-born population - Taiwan (%)
Place of birth for the foreign-born population - Japan (%)
Place of birth for the foreign-born population - Korea (%)
Place of birth for the foreign-born population - Other Eastern Asia (%)
Place of birth for the foreign-born population - Afghanistan (%)
Place of birth for the foreign-born population - Bangladesh (%)
Place of birth for the foreign-born population - India (%)
Place of birth for the foreign-born population - Iran (%)
Place of birth for the foreign-born population - Kazakhstan (%)
Place of birth for the foreign-born population - Nepal (%)
Place of birth for the foreign-born population - Pakistan (%)
Place of birth for the foreign-born population - Sri Lanka (%)
Place of birth for the foreign-born population - Uzbekistan (%)
Place of birth for the foreign-born population - Other South Central Asia (%)
Place of birth for the foreign-born population - Burma (%)
Place of birth for the foreign-born population - Cambodia (%)
Place of birth for the foreign-born population - Indonesia (%)
Place of birth for the foreign-born population - Laos (%)
Place of birth for the foreign-born population - Malaysia (%)
Place of birth for the foreign-born population - Philippines (%)
Place of birth for the foreign-born population - Singapore (%)
Place of birth for the foreign-born population - Thailand (%)
Place of birth for the foreign-born population - Vietnam (%)
Place of birth for the foreign-born population - Other South Eastern Asia (%)
Place of birth for the foreign-born population - Armenia (%)
Place of birth for the foreign-born population - Iraq (%)
Place of birth for the foreign-born population - Israel (%)
Place of birth for the foreign-born population - Jordan (%)
Place of birth for the foreign-born population - Kuwait (%)
Place of birth for the foreign-born population - Lebanon (%)
Place of birth for the foreign-born population - Saudi Arabia (%)
Place of birth for the foreign-born population - Syria (%)
Place of birth for the foreign-born population - Turkey (%)
Place of birth for the foreign-born population - Yemen (%)
Place of birth for the foreign-born population - Other Western Asia (%)
Place of birth for the foreign-born population - Eritrea (%)
Place of birth for the foreign-born population - Ethiopia (%)
Place of birth for the foreign-born population - Kenya (%)
Place of birth for the foreign-born population - Somalia (%)
Place of birth for the foreign-born population - Uganda (%)
Place of birth for the foreign-born population - Zimbabwe (%)
Place of birth for the foreign-born population - Other Eastern Africa (%)
Place of birth for the foreign-born population - Cameroon (%)
Place of birth for the foreign-born population - Congo (%)
Place of birth for the foreign-born population - Democratic Republic of Congo (Zaire) (%)
Place of birth for the foreign-born population - Other Middle Africa (%)
Place of birth for the foreign-born population - Egypt (%)
Place of birth for the foreign-born population - Morocco (%)
Place of birth for the foreign-born population - Sudan (%)
Place of birth for the foreign-born population - Other Northern Africa (%)
Place of birth for the foreign-born population - South Africa (%)
Place of birth for the foreign-born population - Other Southern Africa (%)
Place of birth for the foreign-born population - Cabo Verde (%)
Place of birth for the foreign-born population - Ghana (%)
Place of birth for the foreign-born population - Liberia (%)
Place of birth for the foreign-born population - Nigeria (%)
Place of birth for the foreign-born population - Senegal (%)
Place of birth for the foreign-born population - Sierra Leone (%)
Place of birth for the foreign-born population - Other Western Africa (%)
Place of birth for the foreign-born population - Australia (%)
Place of birth for the foreign-born population - New Zealand (%)
Place of birth for the foreign-born population - Fiji (%)
Place of birth for the foreign-born population - Micronesia (%)
Place of birth for the foreign-born population - Bahamas (%)
Place of birth for the foreign-born population - Barbados (%)
Place of birth for the foreign-born population - Cuba (%)
Place of birth for the foreign-born population - Dominica (%)
Place of birth for the foreign-born population - Dominican Republic (%)
Place of birth for the foreign-born population - Grenada (%)
Place of birth for the foreign-born population - Haiti (%)
Place of birth for the foreign-born population - Jamaica (%)
Place of birth for the foreign-born population - St. Vincent and the Grenadines (%)
Place of birth for the foreign-born population - Trinidad and Tobago (%)
Place of birth for the foreign-born population - West Indies (%)
Place of birth for the foreign-born population - Other Caribbean (%)
Place of birth for the foreign-born population - Belize (%)
Place of birth for the foreign-born population - Costa Rica (%)
Place of birth for the foreign-born population - El Salvador (%)
Place of birth for the foreign-born population - Guatemala (%)
Place of birth for the foreign-born population - Honduras (%)
Place of birth for the foreign-born population - Mexico (%)
Place of birth for the foreign-born population - Nicaragua (%)
Place of birth for the foreign-born population - Panama (%)
Place of birth for the foreign-born population - Other Central America (%)
Place of birth for the foreign-born population - Argentina (%)
Place of birth for the foreign-born population - Bolivia (%)
Place of birth for the foreign-born population - Brazil (%)
Place of birth for the foreign-born population - Chile (%)
Place of birth for the foreign-born population - Colombia (%)
Place of birth for the foreign-born population - Ecuador (%)
Place of birth for the foreign-born population - Guyana (%)
Place of birth for the foreign-born population - Peru (%)
Place of birth for the foreign-born population - Uruguay (%)
Place of birth for the foreign-born population - Venezuela (%)
Place of birth for the foreign-born population - Other South America (%)
Place of birth for the foreign-born population - Canada (%)
Place of birth for the foreign-born population - Other Northern America (%)
Place of birth for the foreign-born population - Other (%)
Latest news about races in Terrell, TX collected exclusively by city-data.com from local newspapers, TV, and radio stations
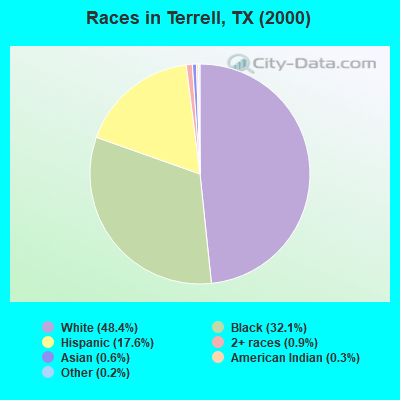
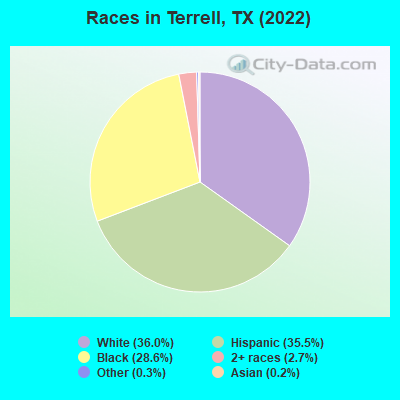
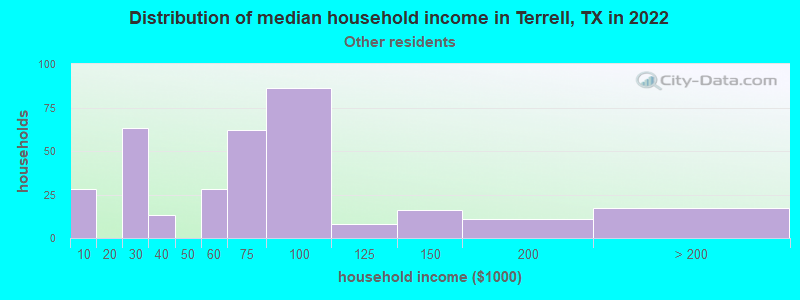
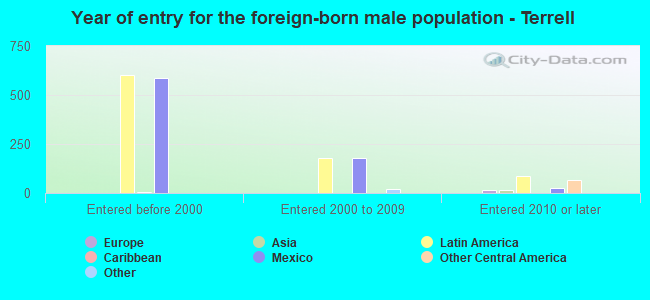
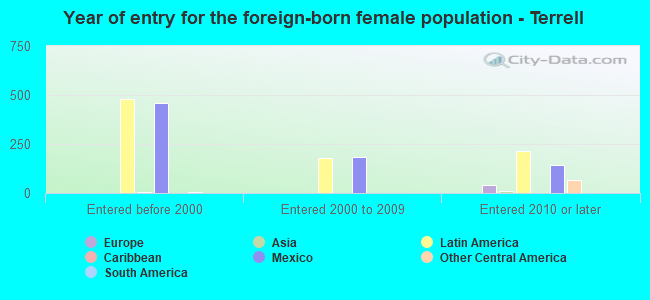
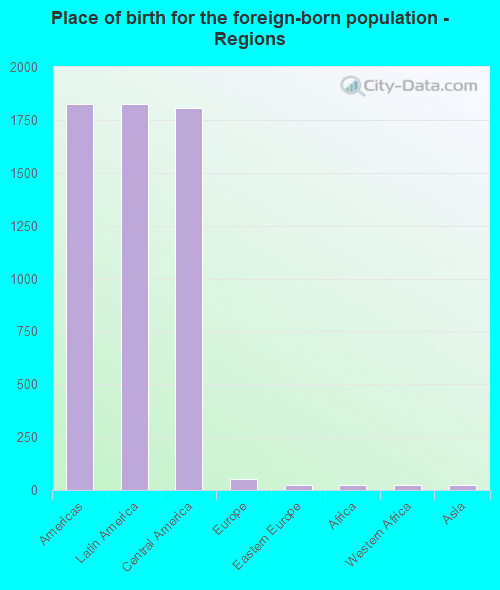
According to 2022 data, the most numerous races in Terrell, TX are Hispanic (7,358 residents), White alone (7,449 residents), and Black alone (5,926 residents). 73.5% of Terrell residents speak English at home. 9.3% of Terrell, TX residents are foreign-born (9.8% born in Latin America), which is 83.2% less than the foreign-born rate of 17.0% across the entire state of Texas.
Race distribution in Terrell
2000 2022
10,933,313 52.4% White alone 6,669,666 32.0% Hispanic 2,364,255 11.3% Black alone 554,445 2.7% Asian alone 230,567 1.1% Two or more races 68,859 0.3% American Indian alone 19,958 0.10% Other race alone 10,757 0.05% Native Hawaiian and Other
12,070,642 40.2% Hispanic 11,683,430 38.9% White alone 3,508,706 11.7% Black alone 1,608,173 5.4% Asian alone 956,560 3.2% Two or more races 125,763 0.4% Other race alone 47,023 0.2% American Indian alone 29,275 0.10% Native Hawaiian and Other
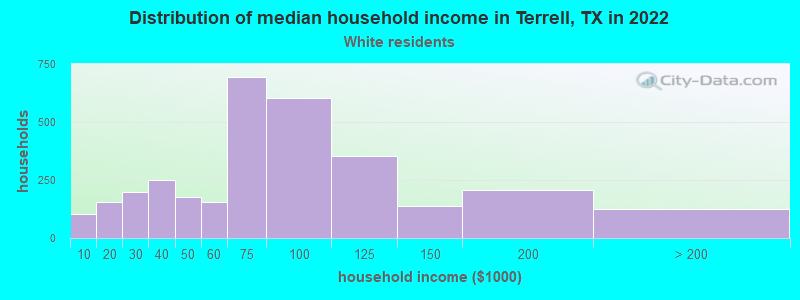
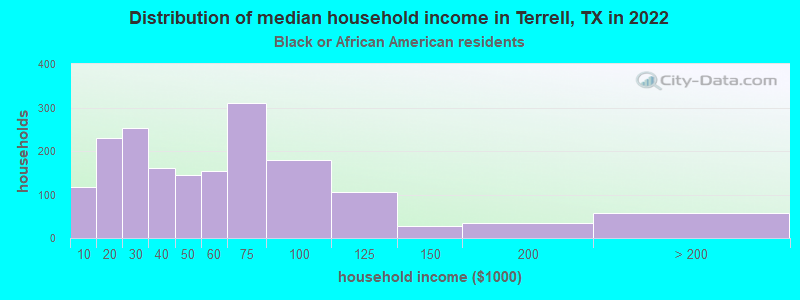
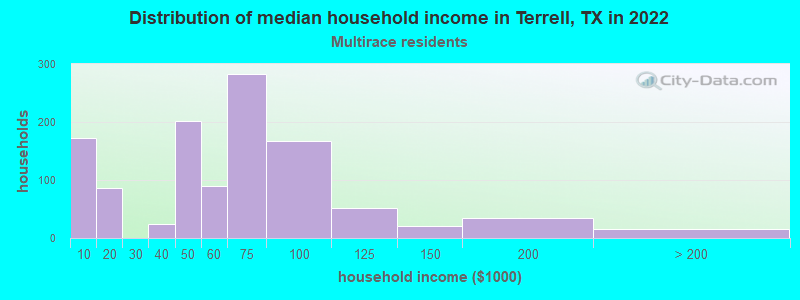
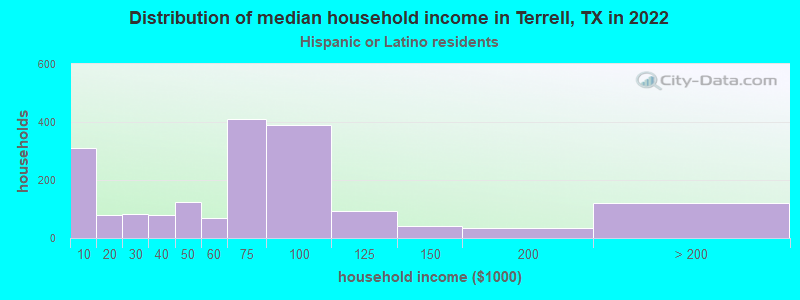
Income and house value in Terrell Median household income in 2022 $75,060 White non-Hispanic householders$58,745 Black householders$64,622 Some other race householders$68,809 Two or more races householders$75,010 Hispanic or Latino race householdersMedian 2022 house value $237,545 White Non-Hispanic householders$181,226 Black or African American householders $318,720 Asian householders$136,234 Some other race householders$173,046 Two or more races householders$138,751 Hispanic or Latino householders
Median age by race in Terrell
42.2 Median age for White residents41.4 43.5 32.8 Median age for Black or African American residents30.4 35.4 10.4 Median age for American Indian / Alaska Native residents-682,445,758.7 8.7 24.0 Median age for Asian residents-694,995,277.9 -468,354,429.9 -581,560,283.1 Median age for Native Hawaiian / Pacific Islander residents-666,666,666.0 -577,777,777.2 32.5 Median age for Other race residents35.0 21.6 22.6 Median age for Two or more races residents20.8 26.1 48.6 Median age for White alone residents46.4 49.9 25.4 Median age for Hispanic or Latino residents27.0 24.1
Owner/renter occupied households by race in Terrell
House owners and renters - White residents 2,009 59.2% Owner occupied1,383 40.8% Renter occupiedHouse owners and renters - Black or African American residents 1,135 57.5% Owner occupied840 42.5% Renter occupiedHouse owners and renters - Other race residents 315 80.4% Owner occupied77 19.6% Renter occupiedHouse owners and renters - Two or more races residents 567 52.3% Owner occupied517 47.7% Renter occupiedHouse owners and renters - White alone residents 1,808 61.7% Owner occupied1,123 38.3% Renter occupiedHouse owners and renters - Hispanic or Latino residents 1,033 67.1% Owner occupied506 32.9% Renter occupied
Language usage in Terrell
English speakers - Total 73.5% of residents of Terrell speak English at home.
24.8% of residents speak Spanish at home 3,165 66.0% Speak English very well1,632 34.0% Speak English less than very well2.2% of residents speak other language at home 200 46.5% Speak English very well230 53.5% Speak English less than very well
English speakers - Born in the United States 84.1% of residents of Terrell speak English at home.
14.9% of residents speak Spanish at home 600 81.3% Speak English very well138 18.7% Speak English less than very well2.2% of residents speak other language at home 109 100.0% Speak English very well
English speakers - Native, born elsewhere 35.5% of residents of Terrell speak English at home.
62.4% of residents speak Spanish at home 175 63.9% Speak English very well99 36.1% Speak English less than very well
English speakers - Foreign-born 19.9% of residents of Terrell speak English at home.
73.8% of residents speak Spanish at home 1,101 45.5% Speak English very well1,319 54.5% Speak English less than very well9.7% of residents speak other language at home 55 17.4% Speak English very well262 82.6% Speak English less than very well
White (Caucasian) - Speak only English Native:
89.9% (7,297)Foreign-born:
17.5% (99)
White (Caucasian) - Speak another language Native:
6.8% (554)Foreign-born:
81.8% (465)
Black or African American - Speak only English Native:
100.0% (5,264)Foreign-born:
24.4% (26)
Black or African American - Speak another language Native:
0.4% (20)Foreign-born:
30.2% (32)
Asian - Speak another language Native:
100.0% (18)Foreign-born:
76.9% (19)
Other race - Speak only English Native:
19.5% (132)Foreign-born:
10.0% (58)
Other race - Speak another language Native:
80.5% (545)Foreign-born:
90.4% (523)
Two or more races - Speak only English Native:
57.1% (1,480)Foreign-born:
10.1% (137)
Two or more races - Speak another language Native:
42.3% (1,097)Foreign-born:
89.9% (1,212)
White alone - Speak another language Native:
2.3% (166)Foreign-born:
99.8% (32)
Hispanic or Latino - Speak only English Native:
38.7% (1,463)Foreign-born:
12.3% (369)
Hispanic or Latino - Speak another language Native:
61.6% (2,326)Foreign-born:
86.4% (2,596)
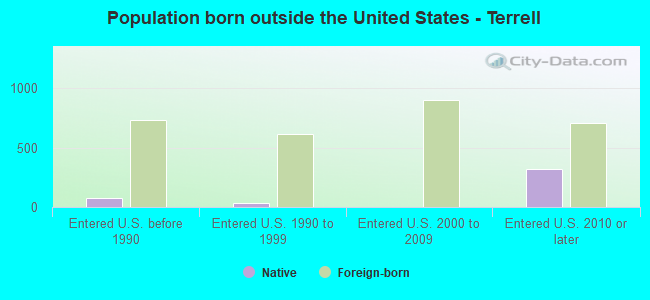
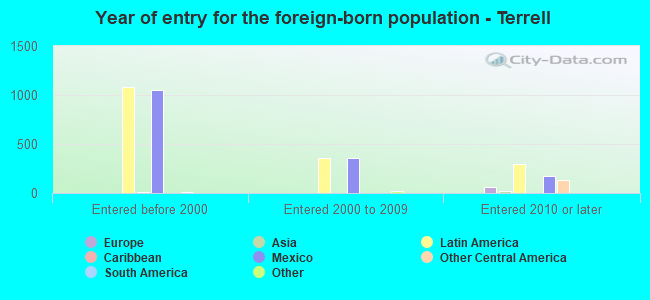
Foreign-born residents in Terrell 1,922 residents are foreign born (9.8% Latin America ).
This city:
9.3%Texas:
17.1%
Marital status for residents in Terrell Marital status - White (Caucasian) population 15 years and over
Males 25.3% Never married52.6% Now married4.0% Separated2.9% Widowed15.2% DivorcedFemales 20.7% Never married43.8% Now married5.7% Separated15.4% Widowed14.4% DivorcedWomen who gave birth in the past 12 months Now married:
100.0% (38)Unmarried:
0.0% (0)
Women who did not give birth in the past 12 months Now married:
52.9% (1,060)Unmarried:
47.1% (945)
Marital status - Black or African American population 15 years and over
Males 51.8% Never married30.5% Now married4.3% Separated1.8% Widowed11.6% DivorcedFemales 44.7% Never married21.7% Now married4.0% Separated13.5% Widowed16.1% DivorcedWomen who did not give birth in the past 12 months Now married:
23.5% (369)Unmarried:
76.5% (1,199)
Marital status - Asian population 15 years and over
Males 100.0% Never married0.0% Now married0.0% Separated0.0% Widowed0.0% DivorcedFemales 100.0% Never married0.0% Now married0.0% Separated0.0% Widowed0.0% DivorcedWomen who did not give birth in the past 12 months Now married:
0.0% (0)Unmarried:
100.0% (20)
Marital status - Other race population 15 years and over
Males 23.7% Never married76.3% Now married0.0% Separated0.0% Widowed0.0% DivorcedFemales 32.6% Never married39.3% Now married15.3% Separated12.8% Widowed0.0% DivorcedWomen who gave birth in the past 12 months Now married:
100.0% (37)Unmarried:
0.0% (0)
Women who did not give birth in the past 12 months Now married:
47.1% (244)Unmarried:
52.9% (274)
Marital status - Two or more races population 15 years and over
Males 38.7% Never married53.3% Now married0.0% Separated0.0% Widowed8.0% DivorcedFemales 38.6% Never married44.3% Now married0.8% Separated0.0% Widowed16.2% DivorcedWomen who gave birth in the past 12 months Now married:
100.0% (192)Unmarried:
0.0% (0)
Women who did not give birth in the past 12 months Now married:
36.4% (476)Unmarried:
63.6% (832)
Marital status - White alone, not Hispanic / Latino population 15 years and over
Males 24.1% Never married47.3% Now married5.5% Separated4.0% Widowed19.1% DivorcedFemales 18.2% Never married42.5% Now married5.2% Separated18.3% Widowed15.7% DivorcedWomen who gave birth in the past 12 months Now married:
100.0% (19)Unmarried:
0.0% (0)
Women who did not give birth in the past 12 months Now married:
51.2% (855)Unmarried:
48.8% (816)
Marital status - Hispanic or Latino population 15 years and over
Males 31.7% Never married62.7% Now married0.0% Separated0.0% Widowed5.6% DivorcedFemales 35.9% Never married46.5% Now married6.7% Separated3.6% Widowed7.4% DivorcedWomen who gave birth in the past 12 months Now married:
100.0% (170)Unmarried:
0.0% (0)
Women who did not give birth in the past 12 months Now married:
48.9% (891)Unmarried:
51.1% (931)
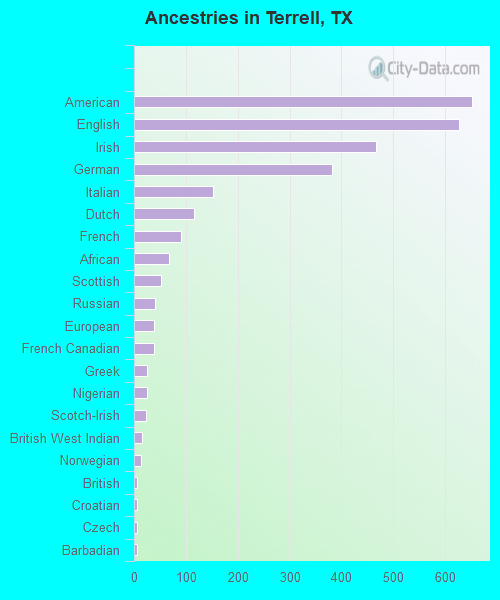
Ancestries in Terrell
652 7.4% American626 7.1% English466 5.3% Irish381 4.3% German152 1.7% Italian115 1.3% Dutch91 1.0% French68 0.8% African53 0.6% Scottish40 0.5% Russian38 0.4% European38 0.4% French Canadian25 0.3% Greek25 0.3% Nigerian23 0.3% Scotch-Irish16 0.2% British West Indian14 0.2% Norwegian6 0.07% British6 0.07% Croatian6 0.07% Czech6 0.07% Barbadian5 0.06% Canadian
Geographical mobility in Terrell Same house 1 year ago 6,955 75.3% White (Caucasian)4,659 77.7% Black or African American56 100.0% American Indian / Alaska Native9 26.5% Asian1,204 99.0% Other race3,515 88.3% Two or more races5,696 76.4% White alone, not Hispanic / Latino5,990 83.5% Hispanic or LatinoMoved within same county 755 8.2% White / Caucasian511 8.5% Black or African American11 32.3% Asian26 0.7% Two or more races707 9.5% White alone, not Hispanic / Latino99 1.4% Hispanic or LatinoMoved within same state 1,450 15.7% White / Caucasian489 8.2% Black or African American491 12.3% Two or more races911 12.2% White alone, not Hispanic / Latino1,173 16.4% Hispanic or LatinoMoved from different state 57 0.6% White / Caucasian40 0.7% Black or African American17 1.4% Other race59 0.8% White alone, not Hispanic / Latino14 0.2% Hispanic or LatinoMoved from abroad 28 0.3% White27 0.4% Black or African American14 42.1% Asian19 0.2% White alone, not Hispanic / Latino9 0.1% Hispanic or Latino
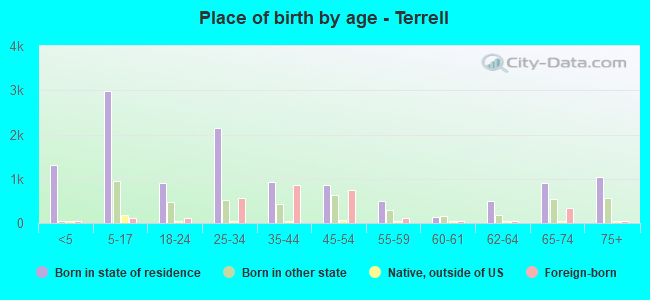
Children Nativity (place of birth) in Terrell
Children under 6 years - Living with two parents Both parents native 270 100.0% NativeBoth parents foreign-born 152 100.0% NativeOne native, one foreign-born parent 308 100.0% NativeChildren under 6 years - Living with one parent Native parent 444 100.0% NativeForeign-born parent 170 100.0% NativeChildren 6 to 17 years - Living with two parents Both parents native 1,179 99.9% Native1 0.1% Foreign-bornBoth parents foreign-born 364 95.2% Native18 4.8% Foreign-bornOne native, one foreign-born parent 526 97.6% Native13 2.4% Foreign-bornChildren 6 to 17 years - Living with one parent Native parent 1,961 100.0% NativeForeign-born parent 210 52.3% Native192 47.7% Foreign-born
Grandparents responsible for own grandchildren in Terrell
Grandparents (30 to 59 years) White / Caucasian 216 76.9% Responsible for grandchildren65 23.1% Not responsible for grandchildrenBlack or African American 6 34.4% Responsible for grandchildren12 65.6% Not responsible for grandchildrenOther race 62 100.0% Responsible for grandchildrenTwo or more races 20 100.0% Not responsible for grandchildrenWhite alone, not Hispanic / Latino 14 20.0% Responsible for grandchildren56 80.0% Not responsible for grandchildrenHispanic or Latino 164 89.8% Responsible for grandchildren19 10.2% Not responsible for grandchildrenGrandparents (60 years and over) White / Caucasian 74 30.3% Responsible for grandchildren171 69.7% Not responsible for grandchildrenBlack or African American 22 100.0% Responsible for grandchildrenWhite alone, not Hispanic / Latino 44 27.2% Responsible for grandchildren118 72.8% Not responsible for grandchildrenHispanic or Latino 51 37.8% Responsible for grandchildren84 62.2% Not responsible for grandchildren