Races in Temple Terrace, Florida (FL) Detailed Stats
Data:
Races - White alone (%)
Races - White alone (% change since 2000)
Races - Black alone (%)
Races - Black alone (% change since 2000)
Races - American Indian alone (%)
Races - American Indian alone (% change since 2000)
Races - Asian alone (%)
Races - Asian alone (% change since 2000)
Races - Hispanic (%)
Races - Hispanic (% change since 2000)
Races - Native Hawaiian and Other Pacific Islander alone (%)
Races - Native Hawaiian and Other Pacific Islander alone (% change since 2000)
Races - Two or more races(%)
Races - Two or more races(% change since 2000)
Races - Other race alone (%)
Races - Other race alone (% change since 2000)
Racial diversity
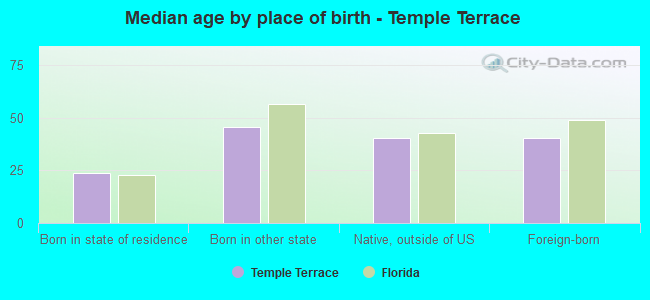
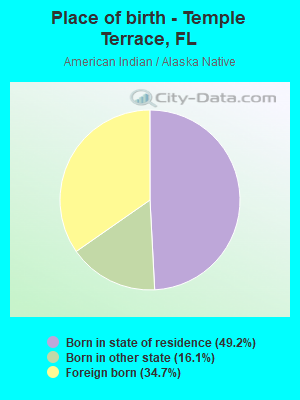
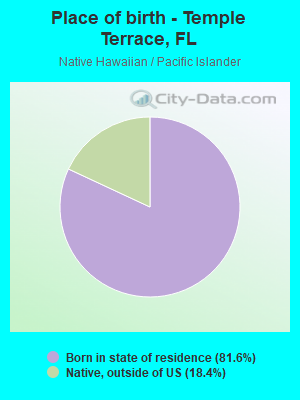
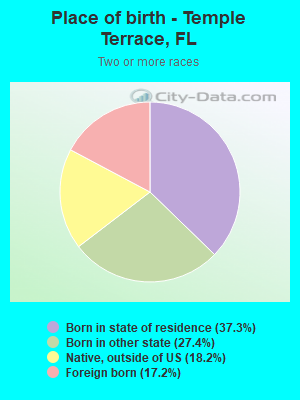
Place of birth - Born in state of residence (%)
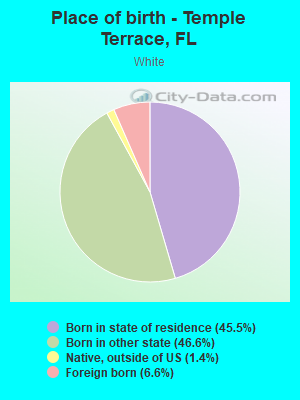
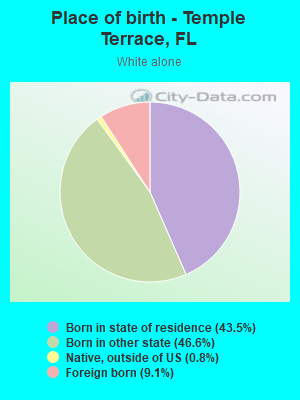
Place of birth - Born in state of residence (%) - White
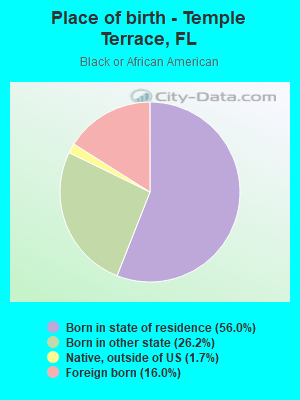
Place of birth - Born in state of residence (%) - Black or African American
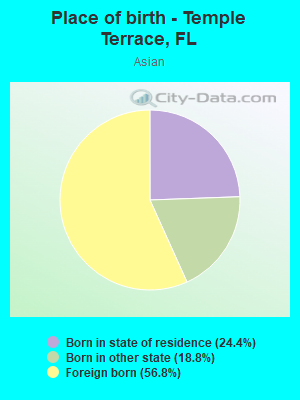
Place of birth - Born in state of residence (%) - Asian
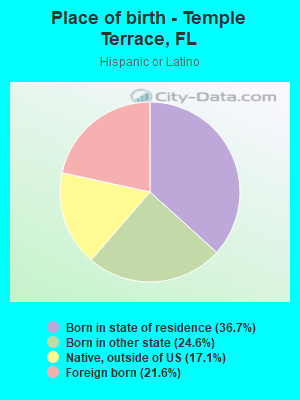
Place of birth - Born in state of residence (%) - Hispanic or Latino
Place of birth - Born in state of residence (%) - American Indian and Alaska Native
Place of birth - Born in state of residence (%) - Multirace
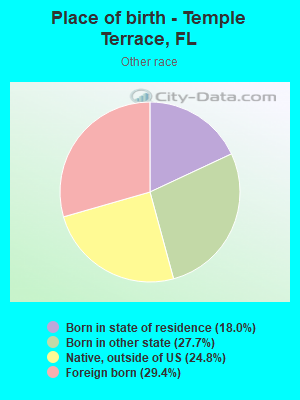
Place of birth - Born in state of residence (%) - Other Race
Place of birth - Born in other state (%)
Place of birth - Born in other state (%) - White
Place of birth - Born in other state (%) - Black or African American
Place of birth - Born in other state (%) - Asian
Place of birth - Born in other state (%) - Hispanic or Latino
Place of birth - Born in other state (%) - American Indian and Alaska Native
Place of birth - Born in other state (%) - Multirace
Place of birth - Born in other state (%) - Other Race
Place of birth - Native, outside of US (%)
Place of birth - Native, outside of US (%) - White
Place of birth - Native, outside of US (%) - Black or African American
Place of birth - Native, outside of US (%) - Asian
Place of birth - Native, outside of US (%) - Hispanic or Latino
Place of birth - Native, outside of US (%) - American Indian and Alaska Native
Place of birth - Native, outside of US (%) - Multirace
Place of birth - Native, outside of US (%) - Other Race
Place of birth - Foreign born (%)
Place of birth - Foreign born (%) - White
Place of birth - Foreign born (%) - Black or African American
Place of birth - Foreign born (%) - Asian
Place of birth - Foreign born (%) - Hispanic or Latino
Place of birth - Foreign born (%) - American Indian and Alaska Native
Place of birth - Foreign born (%) - Multirace
Place of birth - Foreign born (%) - Other Race
Residents speaking English at home (%)
Residents speaking English at home - Born in the United States (%)
Residents speaking English at home - Native, born elsewhere (%)
Residents speaking English at home - Foreign born (%)
Residents speaking Spanish at home (%)
Residents speaking Spanish at home - Born in the United States (%)
Residents speaking Spanish at home - Native, born elsewhere (%)
Residents speaking Spanish at home - Foreign born (%)
Residents speaking other language at home (%)
Residents speaking other language at home - Born in the United States (%)
Residents speaking other language at home - Native, born elsewhere (%)
Residents speaking other language at home - Foreign born (%)
Marital status - Never married (%)
Marital status - Now married (%)
Marital status - Separated (%)
Marital status - Widowed (%)
Marital status - Divorced (%)
Ancestries Reported - Arab (%)
Ancestries Reported - Czech (%)
Ancestries Reported - Danish (%)
Ancestries Reported - Dutch (%)
Ancestries Reported - English (%)
Ancestries Reported - French (%)
Ancestries Reported - French Canadian (%)
Ancestries Reported - German (%)
Ancestries Reported - Greek (%)
Ancestries Reported - Hungarian (%)
Ancestries Reported - Irish (%)
Ancestries Reported - Italian (%)
Ancestries Reported - Lithuanian (%)
Ancestries Reported - Norwegian (%)
Ancestries Reported - Polish (%)
Ancestries Reported - Portuguese (%)
Ancestries Reported - Russian (%)
Ancestries Reported - Scotch-Irish (%)
Ancestries Reported - Scottish (%)
Ancestries Reported - Slovak (%)
Ancestries Reported - Subsaharan African (%)
Ancestries Reported - Swedish (%)
Ancestries Reported - Swiss (%)
Ancestries Reported - Ukrainian (%)
Ancestries Reported - United States (%)
Ancestries Reported - Welsh (%)
Ancestries Reported - West Indian (%)
Ancestries Reported - Other (%)
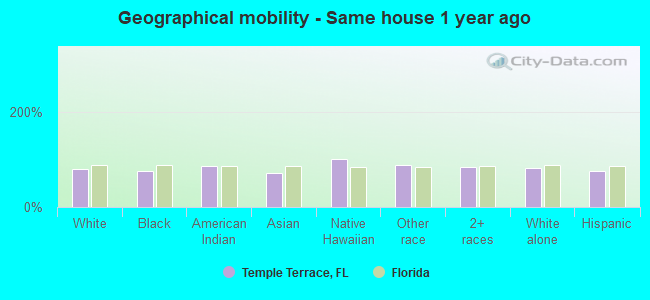
Geographical mobility - Same house 1 year ago (%)
Geographical mobility - Same house 1 year ago (%) - White
Geographical mobility - Same house 1 year ago (%) - Black or African American
Geographical mobility - Same house 1 year ago (%) - Asian
Geographical mobility - Same house 1 year ago (%) - Hispanic or Latino
Geographical mobility - Same house 1 year ago (%) - American Indian and Alaska Native
Geographical mobility - Same house 1 year ago (%) - Multirace
Geographical mobility - Same house 1 year ago (%) - Other Race
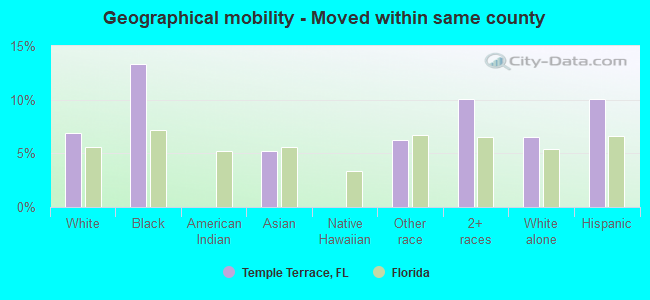
Geographical mobility - Moved within same county (%)
Geographical mobility - Moved within same county (%) - White
Geographical mobility - Moved within same county (%) - Black or African American
Geographical mobility - Moved within same county (%) - Asian
Geographical mobility - Moved within same county (%) - Hispanic or Latino
Geographical mobility - Moved within same county (%) - American Indian and Alaska Native
Geographical mobility - Moved within same county (%) - Multirace
Geographical mobility - Moved within same county (%) - Other Race
Geographical mobility - Moved from different county within same state (%)
Geographical mobility - Moved from different county within same state (%) - White
Geographical mobility - Moved from different county within same state (%) - Black or African American
Geographical mobility - Moved from different county within same state (%) - Asian
Geographical mobility - Moved from different county within same state (%) - Hispanic or Latino
Geographical mobility - Moved from different county within same state (%) - American Indian and Alaska Native
Geographical mobility - Moved from different county within same state (%) - Multirace
Geographical mobility - Moved from different county within same state (%) - Other Race
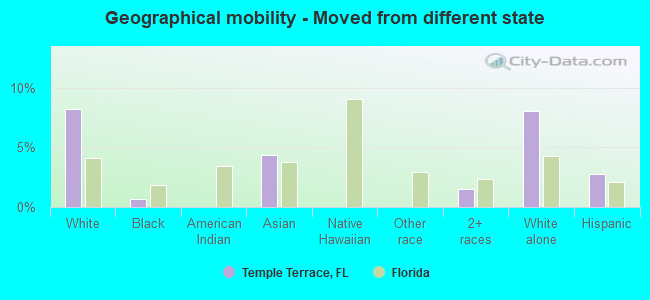
Geographical mobility - Moved from different state (%)
Geographical mobility - Moved from different state (%) - White
Geographical mobility - Moved from different state (%) - Black or African American
Geographical mobility - Moved from different state (%) - Asian
Geographical mobility - Moved from different state (%) - Hispanic or Latino
Geographical mobility - Moved from different state (%) - American Indian and Alaska Native
Geographical mobility - Moved from different state (%) - Multirace
Geographical mobility - Moved from different state (%) - Other Race
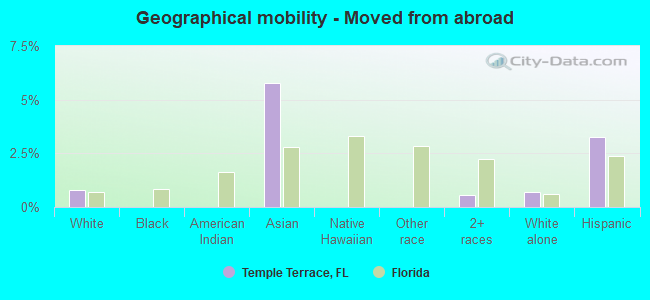
Geographical mobility - Moved from abroad (%)
Geographical mobility - Moved from abroad (%) - White
Geographical mobility - Moved from abroad (%) - Black or African American
Geographical mobility - Moved from abroad (%) - Asian
Geographical mobility - Moved from abroad (%) - Hispanic or Latino
Geographical mobility - Moved from abroad (%) - American Indian and Alaska Native
Geographical mobility - Moved from abroad (%) - Multirace
Geographical mobility - Moved from abroad (%) - Other Race
Place of birth for the foreign-born population - Ireland (%)
Place of birth for the foreign-born population - Denmark (%)
Place of birth for the foreign-born population - Norway (%)
Place of birth for the foreign-born population - Sweden (%)
Place of birth for the foreign-born population - United Kingdom (%)
Place of birth for the foreign-born population - England (%)
Place of birth for the foreign-born population - Scotland (%)
Place of birth for the foreign-born population - Other Northern Europe (%)
Place of birth for the foreign-born population - Austria (%)
Place of birth for the foreign-born population - Belgium (%)
Place of birth for the foreign-born population - France (%)
Place of birth for the foreign-born population - Germany (%)
Place of birth for the foreign-born population - Netherlands (%)
Place of birth for the foreign-born population - Switzerland (%)
Place of birth for the foreign-born population - Other Western Europe (%)
Place of birth for the foreign-born population - Greece (%)
Place of birth for the foreign-born population - Italy (%)
Place of birth for the foreign-born population - Portugal (%)
Place of birth for the foreign-born population - Spain (%)
Place of birth for the foreign-born population - Other Southern Europe (%)
Place of birth for the foreign-born population - Albania (%)
Place of birth for the foreign-born population - Belarus (%)
Place of birth for the foreign-born population - Bosnia and Herzegovina (%)
Place of birth for the foreign-born population - Bulgaria (%)
Place of birth for the foreign-born population - Croatia (%)
Place of birth for the foreign-born population - Czechoslovakia (%)
Place of birth for the foreign-born population - Hungary (%)
Place of birth for the foreign-born population - Latvia (%)
Place of birth for the foreign-born population - Lithuania (%)
Place of birth for the foreign-born population - North Macedonia (Macedonia) (%)
Place of birth for the foreign-born population - Moldova (%)
Place of birth for the foreign-born population - Poland (%)
Place of birth for the foreign-born population - Romania (%)
Place of birth for the foreign-born population - Russia (%)
Place of birth for the foreign-born population - Serbia (%)
Place of birth for the foreign-born population - Ukraine (%)
Place of birth for the foreign-born population - Other Eastern Europe (%)
Place of birth for the foreign-born population - China (%)
Place of birth for the foreign-born population - Hong Kong (%)
Place of birth for the foreign-born population - Taiwan (%)
Place of birth for the foreign-born population - Japan (%)
Place of birth for the foreign-born population - Korea (%)
Place of birth for the foreign-born population - Other Eastern Asia (%)
Place of birth for the foreign-born population - Afghanistan (%)
Place of birth for the foreign-born population - Bangladesh (%)
Place of birth for the foreign-born population - India (%)
Place of birth for the foreign-born population - Iran (%)
Place of birth for the foreign-born population - Kazakhstan (%)
Place of birth for the foreign-born population - Nepal (%)
Place of birth for the foreign-born population - Pakistan (%)
Place of birth for the foreign-born population - Sri Lanka (%)
Place of birth for the foreign-born population - Uzbekistan (%)
Place of birth for the foreign-born population - Other South Central Asia (%)
Place of birth for the foreign-born population - Burma (%)
Place of birth for the foreign-born population - Cambodia (%)
Place of birth for the foreign-born population - Indonesia (%)
Place of birth for the foreign-born population - Laos (%)
Place of birth for the foreign-born population - Malaysia (%)
Place of birth for the foreign-born population - Philippines (%)
Place of birth for the foreign-born population - Singapore (%)
Place of birth for the foreign-born population - Thailand (%)
Place of birth for the foreign-born population - Vietnam (%)
Place of birth for the foreign-born population - Other South Eastern Asia (%)
Place of birth for the foreign-born population - Armenia (%)
Place of birth for the foreign-born population - Iraq (%)
Place of birth for the foreign-born population - Israel (%)
Place of birth for the foreign-born population - Jordan (%)
Place of birth for the foreign-born population - Kuwait (%)
Place of birth for the foreign-born population - Lebanon (%)
Place of birth for the foreign-born population - Saudi Arabia (%)
Place of birth for the foreign-born population - Syria (%)
Place of birth for the foreign-born population - Turkey (%)
Place of birth for the foreign-born population - Yemen (%)
Place of birth for the foreign-born population - Other Western Asia (%)
Place of birth for the foreign-born population - Eritrea (%)
Place of birth for the foreign-born population - Ethiopia (%)
Place of birth for the foreign-born population - Kenya (%)
Place of birth for the foreign-born population - Somalia (%)
Place of birth for the foreign-born population - Uganda (%)
Place of birth for the foreign-born population - Zimbabwe (%)
Place of birth for the foreign-born population - Other Eastern Africa (%)
Place of birth for the foreign-born population - Cameroon (%)
Place of birth for the foreign-born population - Congo (%)
Place of birth for the foreign-born population - Democratic Republic of Congo (Zaire) (%)
Place of birth for the foreign-born population - Other Middle Africa (%)
Place of birth for the foreign-born population - Egypt (%)
Place of birth for the foreign-born population - Morocco (%)
Place of birth for the foreign-born population - Sudan (%)
Place of birth for the foreign-born population - Other Northern Africa (%)
Place of birth for the foreign-born population - South Africa (%)
Place of birth for the foreign-born population - Other Southern Africa (%)
Place of birth for the foreign-born population - Cabo Verde (%)
Place of birth for the foreign-born population - Ghana (%)
Place of birth for the foreign-born population - Liberia (%)
Place of birth for the foreign-born population - Nigeria (%)
Place of birth for the foreign-born population - Senegal (%)
Place of birth for the foreign-born population - Sierra Leone (%)
Place of birth for the foreign-born population - Other Western Africa (%)
Place of birth for the foreign-born population - Australia (%)
Place of birth for the foreign-born population - New Zealand (%)
Place of birth for the foreign-born population - Fiji (%)
Place of birth for the foreign-born population - Micronesia (%)
Place of birth for the foreign-born population - Bahamas (%)
Place of birth for the foreign-born population - Barbados (%)
Place of birth for the foreign-born population - Cuba (%)
Place of birth for the foreign-born population - Dominica (%)
Place of birth for the foreign-born population - Dominican Republic (%)
Place of birth for the foreign-born population - Grenada (%)
Place of birth for the foreign-born population - Haiti (%)
Place of birth for the foreign-born population - Jamaica (%)
Place of birth for the foreign-born population - St. Vincent and the Grenadines (%)
Place of birth for the foreign-born population - Trinidad and Tobago (%)
Place of birth for the foreign-born population - West Indies (%)
Place of birth for the foreign-born population - Other Caribbean (%)
Place of birth for the foreign-born population - Belize (%)
Place of birth for the foreign-born population - Costa Rica (%)
Place of birth for the foreign-born population - El Salvador (%)
Place of birth for the foreign-born population - Guatemala (%)
Place of birth for the foreign-born population - Honduras (%)
Place of birth for the foreign-born population - Mexico (%)
Place of birth for the foreign-born population - Nicaragua (%)
Place of birth for the foreign-born population - Panama (%)
Place of birth for the foreign-born population - Other Central America (%)
Place of birth for the foreign-born population - Argentina (%)
Place of birth for the foreign-born population - Bolivia (%)
Place of birth for the foreign-born population - Brazil (%)
Place of birth for the foreign-born population - Chile (%)
Place of birth for the foreign-born population - Colombia (%)
Place of birth for the foreign-born population - Ecuador (%)
Place of birth for the foreign-born population - Guyana (%)
Place of birth for the foreign-born population - Peru (%)
Place of birth for the foreign-born population - Uruguay (%)
Place of birth for the foreign-born population - Venezuela (%)
Place of birth for the foreign-born population - Other South America (%)
Place of birth for the foreign-born population - Canada (%)
Place of birth for the foreign-born population - Other Northern America (%)
Place of birth for the foreign-born population - Other (%)
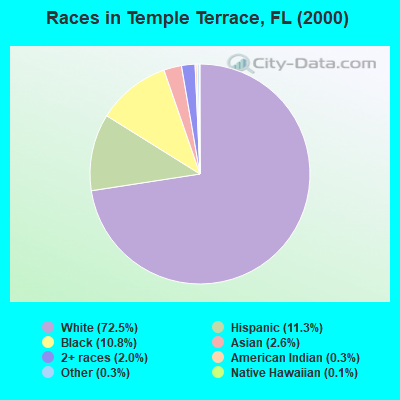
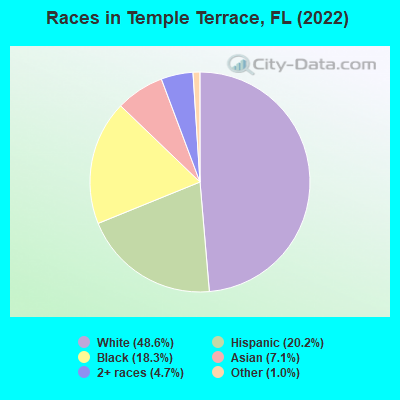
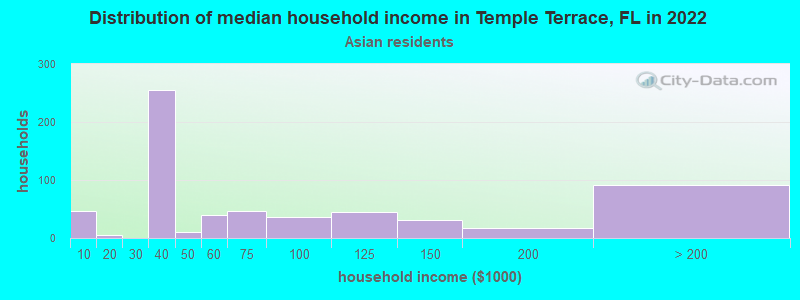
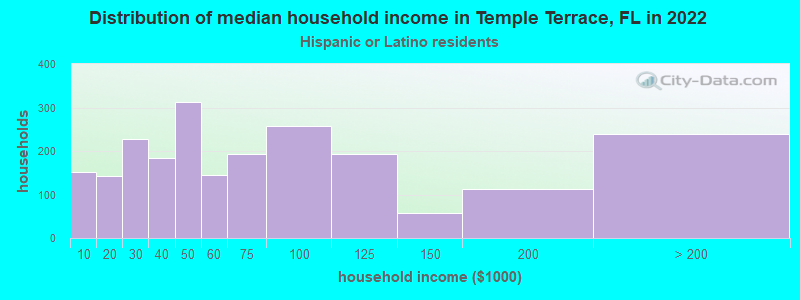
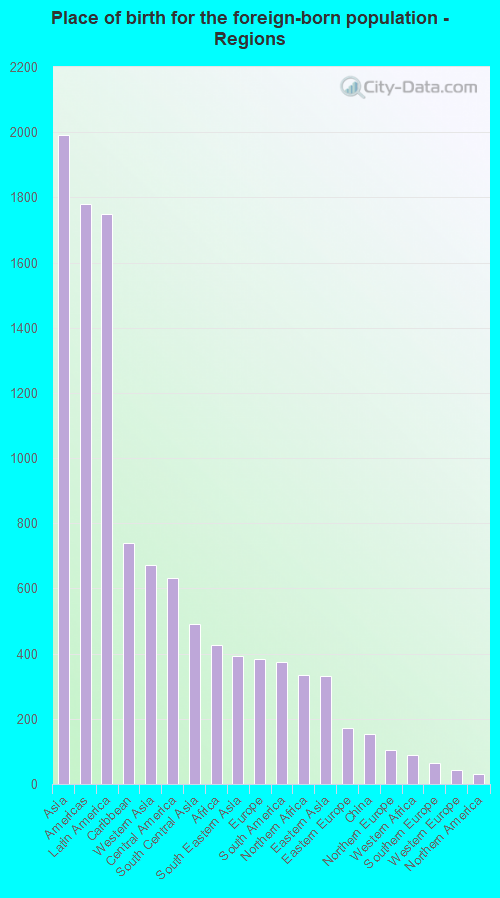
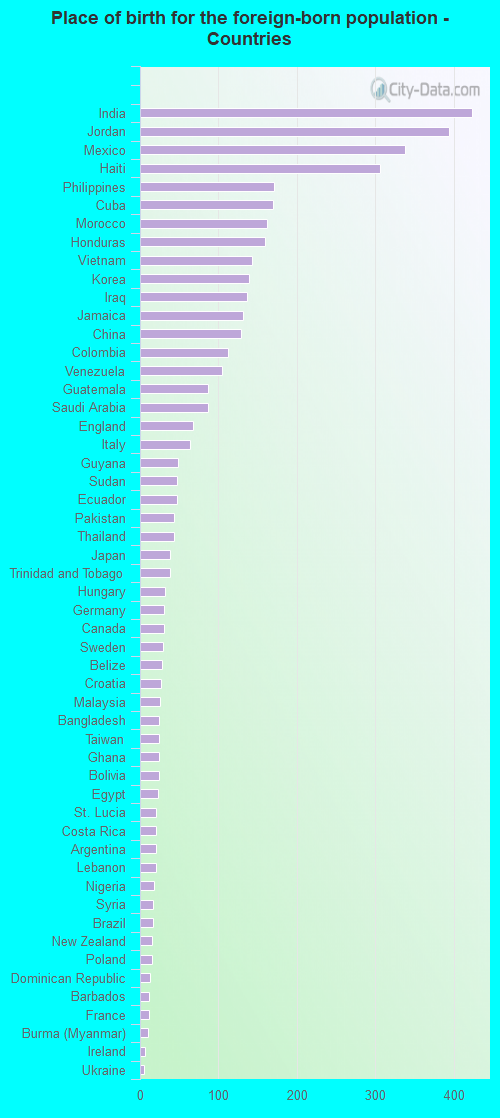
According to 2022 data, the most numerous races in Temple Terrace, FL are White alone (13,423 residents), Hispanic (5,589 residents), and Black alone (5,049 residents). 72.9% of Temple Terrace residents speak English at home. 16.6% of Temple Terrace, FL residents are foreign-born (7.1% born in Asia, 6.2% born in Latin America), which is 26.2% less than the foreign-born rate of 21.0% across the entire state of Florida.
Race distribution in Temple Terrace
2000 2022
10,458,509 65.4% White alone 2,682,715 16.8% Hispanic 2,264,268 14.2% Black alone 261,693 1.6% Asian alone 236,954 1.5% Two or more races 42,358 0.3% American Indian alone 28,994 0.2% Other race alone 6,887 0.04% Native Hawaiian and Other
11,309,403 50.8% White alone 6,025,039 27.1% Hispanic 3,241,015 14.6% Black alone 861,630 3.9% Two or more races 623,692 2.8% Asian alone 152,054 0.7% Other race alone 22,504 0.1% American Indian alone 9,486 0.04% Native Hawaiian and Other
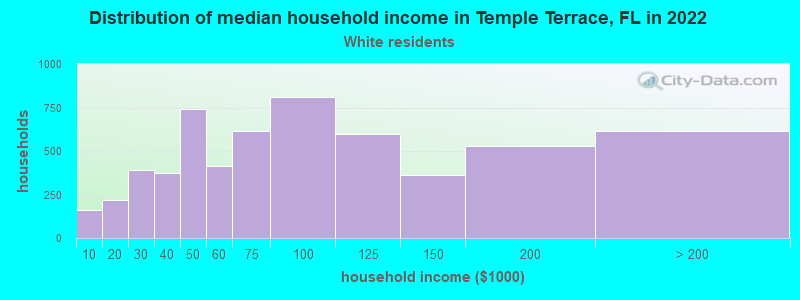
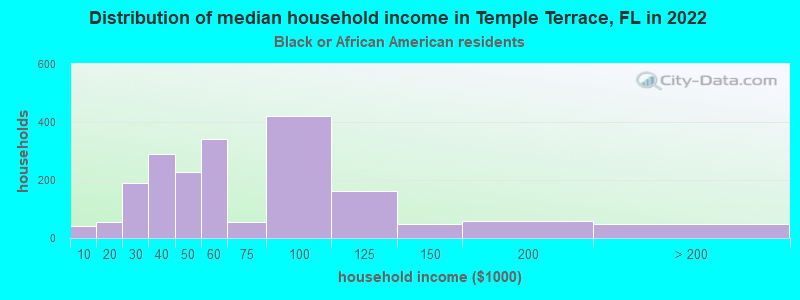
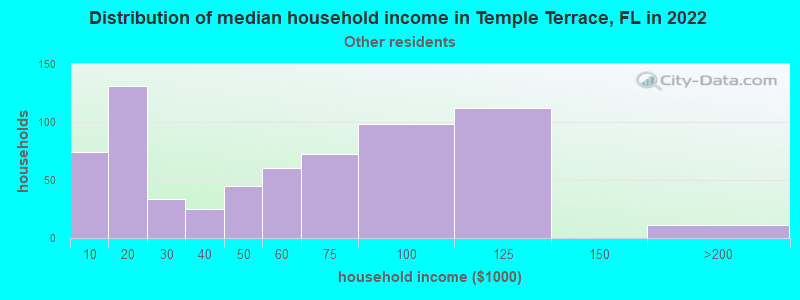
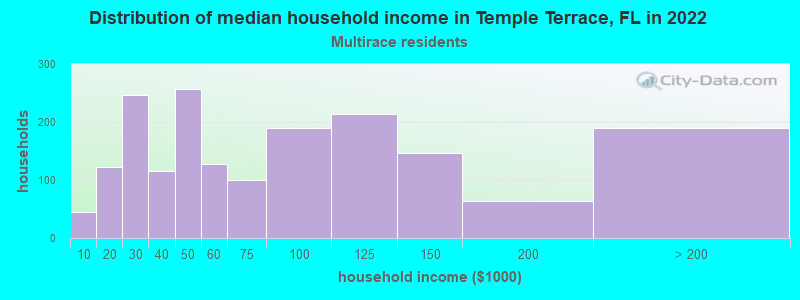
Income and house value in Temple Terrace Median household income in 2022 $74,677 White non-Hispanic householders$58,320 Black householders$53,471 Some other race householders$59,161 Two or more races householders$53,740 Hispanic or Latino race householdersMedian 2022 house value $389,832 White Non-Hispanic householders$267,247 Black or African American householders $327,221 Asian householders$443,874 Some other race householders$315,029 Two or more races householders$301,518 Hispanic or Latino householders
Median age by race in Temple Terrace
39.1 Median age for White residents38.7 39.4 29.3 Median age for Black or African American residents27.5 34.1 16.8 Median age for American Indian / Alaska Native residents-676,245,210.1 16.2 26.0 Median age for Asian residents23.8 29.5 -848,484,847.6 Median age for Native Hawaiian / Pacific Islander residents-776,729,559.0 -490,118,576.6 36.3 Median age for Other race residents37.0 34.8 34.5 Median age for Two or more races residents34.2 33.6 41.3 Median age for White alone residents41.5 40.9 32.8 Median age for Hispanic or Latino residents34.9 30.6
Owner/renter occupied households by race in Temple Terrace
House owners and renters - White residents 3,661 62.3% Owner occupied2,211 37.7% Renter occupiedHouse owners and renters - Black or African American residents 487 25.1% Owner occupied1,457 74.9% Renter occupiedHouse owners and renters - Asian residents 247 33.6% Owner occupied488 66.4% Renter occupiedHouse owners and renters - Native Hawaiian / Pacific Islander residents 2 30.7% Owner occupied5 69.3% Renter occupiedHouse owners and renters - Other race residents 272 38.0% Owner occupied444 62.0% Renter occupiedHouse owners and renters - Two or more races residents 1,044 54.4% Owner occupied876 45.6% Renter occupiedHouse owners and renters - White alone residents 3,673 64.4% Owner occupied2,026 35.6% Renter occupiedHouse owners and renters - Hispanic or Latino residents 964 43.3% Owner occupied1,263 56.7% Renter occupied
Language usage in Temple Terrace
English speakers - Total 72.9% of residents of Temple Terrace speak English at home.
12.0% of residents speak Spanish at home 2,358 73.8% Speak English very well837 26.2% Speak English less than very well15.5% of residents speak other language at home 2,953 71.6% Speak English very well1,172 28.4% Speak English less than very well
English speakers - Born in the United States 88.5% of residents of Temple Terrace speak English at home.
7.3% of residents speak Spanish at home 608 87.0% Speak English very well91 13.0% Speak English less than very well4.3% of residents speak other language at home 330 80.5% Speak English very well80 19.5% Speak English less than very well
English speakers - Native, born elsewhere 41.5% of residents of Temple Terrace speak English at home.
51.3% of residents speak Spanish at home 440 68.0% Speak English very well207 32.0% Speak English less than very well11.3% of residents speak other language at home 142 100.0% Speak English very well
English speakers - Foreign-born 14.5% of residents of Temple Terrace speak English at home.
22.9% of residents speak Spanish at home 628 57.6% Speak English very well463 42.4% Speak English less than very well61.6% of residents speak other language at home 1,915 65.4% Speak English very well1,015 34.6% Speak English less than very well
White (Caucasian) - Speak only English Native:
92.9% (11,524)Foreign-born:
18.4% (166)
White (Caucasian) - Speak another language Native:
6.6% (815)Foreign-born:
76.0% (684)
Black or African American - Speak only English Native:
98.3% (4,046)Foreign-born:
31.9% (251)
Black or African American - Speak another language Native:
1.8% (75)Foreign-born:
68.3% (536)
American Indian / Alaska Native - Speak only English Native:
43.6% (25)Foreign-born:
47.9% (14)
Asian - Speak only English Native:
67.3% (554)Foreign-born:
9.7% (113)
Asian - Speak another language Native:
29.3% (242)Foreign-born:
90.1% (1,042)
Other race - Speak only English Native:
45.5% (467)Foreign-born:
7.3% (35)
Other race - Speak another language Native:
55.5% (570)Foreign-born:
92.3% (441)
Two or more races - Speak only English Native:
64.5% (2,200)Foreign-born:
16.8% (128)
Two or more races - Speak another language Native:
34.5% (1,176)Foreign-born:
79.3% (607)
White alone - Speak only English Native:
93.4% (10,991)Foreign-born:
13.6% (166)
White alone - Speak another language Native:
6.4% (748)Foreign-born:
84.0% (1,023)
Hispanic or Latino - Speak only English Native:
52.7% (2,143)Foreign-born:
5.6% (67)
Hispanic or Latino - Speak another language Native:
49.2% (2,001)Foreign-born:
94.3% (1,122)
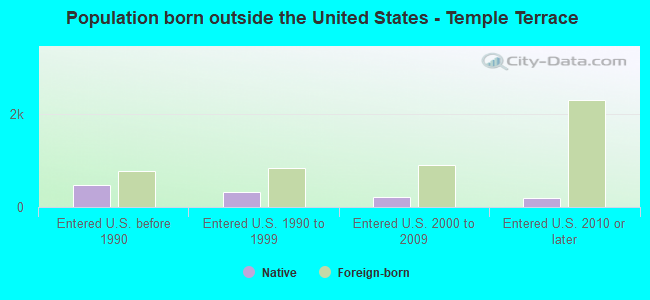
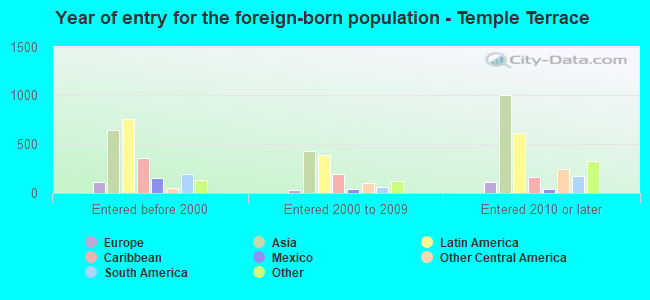
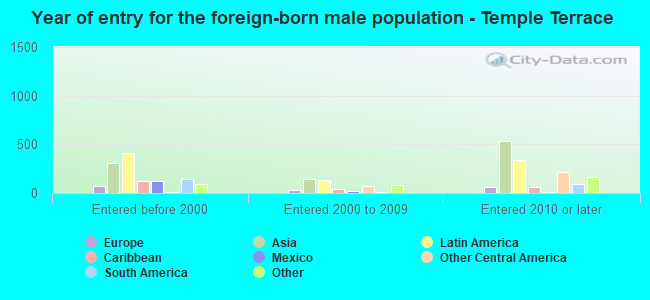
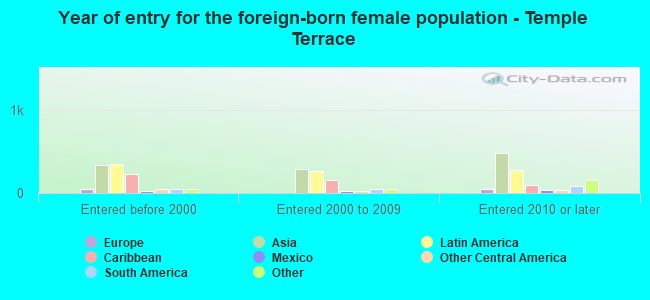
Foreign-born residents in Temple Terrace 4,598 residents are foreign born (7.1% Asia , 6.2% Latin America ).
This city:
16.6%Florida:
21.1%
Marital status for residents in Temple Terrace Marital status - White (Caucasian) population 15 years and over
Males 41.6% Never married44.5% Now married1.5% Separated2.1% Widowed10.3% DivorcedFemales 34.8% Never married44.4% Now married0.3% Separated7.7% Widowed12.8% DivorcedWomen who gave birth in the past 12 months Now married:
67.9% (47)Unmarried:
32.1% (22)
Women who did not give birth in the past 12 months Now married:
38.6% (1,167)Unmarried:
61.4% (1,859)
Marital status - Black or African American population 15 years and over
Males 63.4% Never married27.5% Now married3.8% Separated5.4% Widowed0.0% DivorcedFemales 44.6% Never married28.0% Now married4.1% Separated1.5% Widowed21.8% DivorcedWomen who did not give birth in the past 12 months Now married:
31.5% (482)Unmarried:
68.5% (1,047)
Marital status - American Indian / Alaska Native population 15 years and over
Males 0.0% Never married100.0% Now married0.0% Separated0.0% Widowed0.0% DivorcedFemales 93.0% Never married7.0% Now married0.0% Separated0.0% Widowed0.0% DivorcedWomen who did not give birth in the past 12 months Now married:
0.0% (0)Unmarried:
100.0% (80)
Marital status - Asian population 15 years and over
Males 67.9% Never married23.3% Now married3.2% Separated1.6% Widowed4.0% DivorcedFemales 58.2% Never married28.8% Now married4.8% Separated4.6% Widowed3.6% DivorcedWomen who did not give birth in the past 12 months Now married:
16.5% (97)Unmarried:
83.5% (491)
Marital status - Native Hawaiian / Pacific Islander population 15 years and over
Males 100.0% Never married0.0% Now married0.0% Separated0.0% Widowed0.0% DivorcedFemales 0.0% Never married0.0% Now married0.0% Separated0.0% Widowed100.0% DivorcedWomen who did not give birth in the past 12 months Now married:
0.0% (0)Unmarried:
100.0% (2)
Marital status - Other race population 15 years and over
Males 36.6% Never married59.8% Now married3.6% Separated0.0% Widowed0.0% DivorcedFemales 39.8% Never married36.7% Now married0.0% Separated0.0% Widowed23.4% DivorcedWomen who gave birth in the past 12 months Now married:
100.0% (22)Unmarried:
0.0% (0)
Women who did not give birth in the past 12 months Now married:
43.2% (259)Unmarried:
56.8% (342)
Marital status - Two or more races population 15 years and over
Males 46.1% Never married37.7% Now married1.8% Separated10.8% Widowed3.6% DivorcedFemales 46.8% Never married40.0% Now married2.1% Separated2.9% Widowed8.3% DivorcedWomen who gave birth in the past 12 months Now married:
47.9% (35)Unmarried:
52.1% (38)
Women who did not give birth in the past 12 months Now married:
37.6% (401)Unmarried:
62.4% (666)
Marital status - White alone, not Hispanic / Latino population 15 years and over
Males 39.0% Never married47.7% Now married1.8% Separated1.8% Widowed9.6% DivorcedFemales 32.1% Never married45.8% Now married0.0% Separated8.4% Widowed13.7% DivorcedWomen who gave birth in the past 12 months Now married:
67.9% (55)Unmarried:
32.1% (26)
Women who did not give birth in the past 12 months Now married:
40.3% (1,185)Unmarried:
59.7% (1,756)
Marital status - Hispanic or Latino population 15 years and over
Males 49.3% Never married34.1% Now married1.4% Separated7.0% Widowed8.2% DivorcedFemales 47.1% Never married40.4% Now married2.5% Separated1.7% Widowed8.3% DivorcedWomen who gave birth in the past 12 months Now married:
47.9% (24)Unmarried:
52.1% (26)
Women who did not give birth in the past 12 months Now married:
36.9% (479)Unmarried:
63.1% (820)
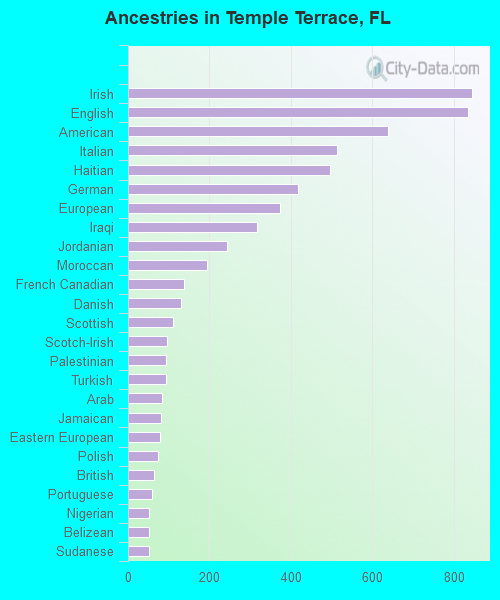
Ancestries in Temple Terrace
844 5.5% Irish834 5.4% English638 4.1% American513 3.3% Italian497 3.2% Haitian418 2.7% German374 2.4% European316 2.0% Iraqi242 1.6% Jordanian195 1.3% Moroccan138 0.9% French Canadian130 0.8% Danish110 0.7% Scottish95 0.6% Scotch-Irish94 0.6% Palestinian93 0.6% Turkish84 0.5% Arab80 0.5% Jamaican78 0.5% Eastern European73 0.5% Polish64 0.4% British58 0.4% Portuguese52 0.3% Nigerian52 0.3% Belizean51 0.3% Sudanese45 0.3% Guyanese43 0.3% Greek37 0.2% Northern European35 0.2% Ghanaian30 0.2% Hungarian29 0.2% Swedish25 0.2% Syrian23 0.1% French22 0.1% Russian22 0.1% U.S. Virgin Islander21 0.1% African19 0.1% Dutch18 0.1% Austrian18 0.1% Lithuanian18 0.1% British West Indian17 0.1% Afghan17 0.1% Croatian16 0.1% Belgian16 0.1% Finnish14 0.09% Canadian12 0.08% Egyptian5 0.03% Romanian3 0.02% Norwegian
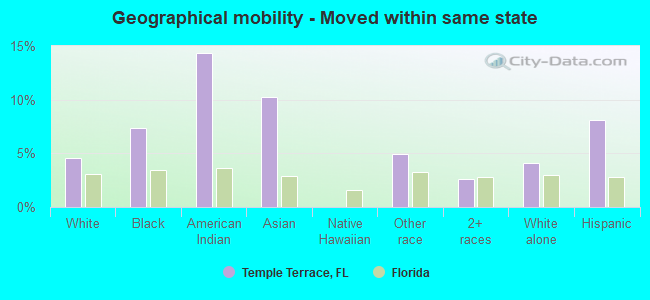
Geographical mobility in Temple Terrace Same house 1 year ago 10,910 79.8% White (Caucasian)3,843 74.9% Black or African American79 86.1% American Indian / Alaska Native1,449 72.2% Asian7 100.0% Native Hawaiian / Pacific Islander1,394 89.1% Other race3,858 84.3% Two or more races10,831 81.1% White alone, not Hispanic / Latino4,269 76.4% Hispanic or LatinoMoved within same county 938 6.9% White / Caucasian685 13.4% Black or African American105 5.2% Asian98 6.2% Other race460 10.1% Two or more races868 6.5% White alone, not Hispanic / Latino561 10.0% Hispanic or LatinoMoved within same state 626 4.6% White / Caucasian379 7.4% Black or African American13 14.3% American Indian / Alaska Native205 10.2% Asian77 4.9% Other race120 2.6% Two or more races543 4.1% White alone, not Hispanic / Latino453 8.1% Hispanic or LatinoMoved from different state 1,127 8.2% White / Caucasian33 0.6% Black or African American88 4.4% Asian71 1.5% Two or more races1,070 8.0% White alone, not Hispanic / Latino153 2.7% Hispanic or LatinoMoved from abroad 107 0.8% White116 5.8% Asian26 0.6% Two or more races95 0.7% White alone, not Hispanic / Latino182 3.3% Hispanic or Latino
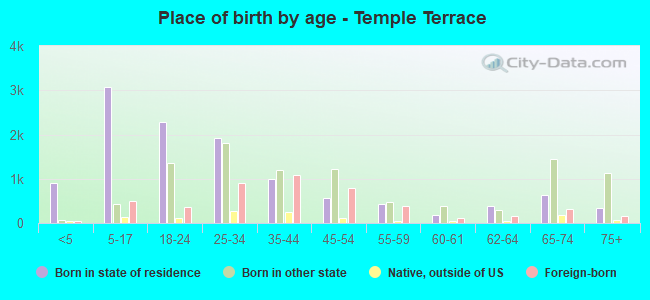
Children Nativity (place of birth) in Temple Terrace
Children under 6 years - Living with two parents Both parents native 502 100.0% NativeBoth parents foreign-born 120 84.1% Native23 15.9% Foreign-bornOne native, one foreign-born parent 170 100.0% NativeChildren under 6 years - Living with one parent Native parent 273 100.0% NativeForeign-born parent 63 100.0% NativeChildren 6 to 17 years - Living with two parents Both parents native 1,403 98.6% Native21 1.4% Foreign-bornBoth parents foreign-born 448 52.5% Native406 47.5% Foreign-bornOne native, one foreign-born parent 426 100.0% NativeChildren 6 to 17 years - Living with one parent Native parent 800 100.0% NativeForeign-born parent 229 56.0% Native180 44.0% Foreign-born
Grandparents responsible for own grandchildren in Temple Terrace
Grandparents (30 to 59 years) White / Caucasian 20 74.1% Responsible for grandchildren7 25.9% Not responsible for grandchildrenBlack or African American 20 100.0% Not responsible for grandchildrenAsian 12 100.0% Not responsible for grandchildrenTwo or more races 30 100.0% Responsible for grandchildrenWhite alone, not Hispanic / Latino 24 81.0% Responsible for grandchildren6 19.0% Not responsible for grandchildrenHispanic or Latino 17 100.0% Responsible for grandchildrenGrandparents (60 years and over) White / Caucasian 46 26.9% Responsible for grandchildren124 73.1% Not responsible for grandchildrenBlack or African American 24 40.6% Responsible for grandchildren35 59.4% Not responsible for grandchildrenTwo or more races 3 100.0% Responsible for grandchildrenWhite alone, not Hispanic / Latino 56 26.3% Responsible for grandchildren158 73.7% Not responsible for grandchildrenHispanic or Latino 2 12.3% Responsible for grandchildren15 87.7% Not responsible for grandchildren