Races in Telford, Tennessee (TN) Detailed Stats
Ancestries, Foreign-born residents, place of birth

Data:
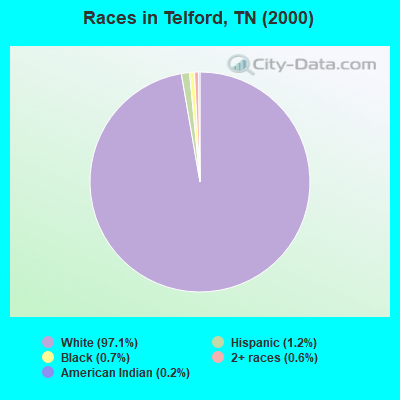
Race distribution in Telford

- 9,61197.1%White alone
- 1161.2%Hispanic
- 720.7%Black alone
- 610.6%Two or more races
- 230.2%American Indian alone
- 90.09%Asian alone
- 20.02%Other race alone
- 20.02%Native Hawaiian and Other
Pacific Islander alone
2000
2022
-
- 4,505,93079.2%White alone
- 928,20416.3%Black alone
- 123,8382.2%Hispanic
- 54,8241.0%Two or more races
- 56,0771.0%Asian alone
- 13,8200.2%American Indian alone
- 4,7800.08%Other race alone
- 1,8100.03%Native Hawaiian and Other
Pacific Islander alone
-
- 5,070,02671.9%White alone
- 1,089,73815.5%Black alone
- 442,6296.3%Hispanic
- 279,3814.0%Two or more races
- 131,8171.9%Asian alone
- 26,9720.4%Other race alone
- 6,3870.09%American Indian alone
- 4,3890.06%Native Hawaiian and Other
Pacific Islander alone
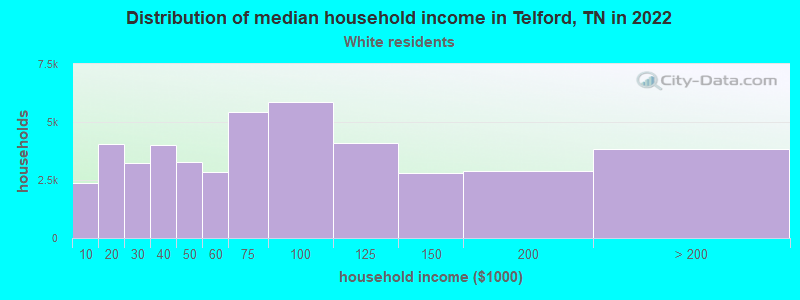
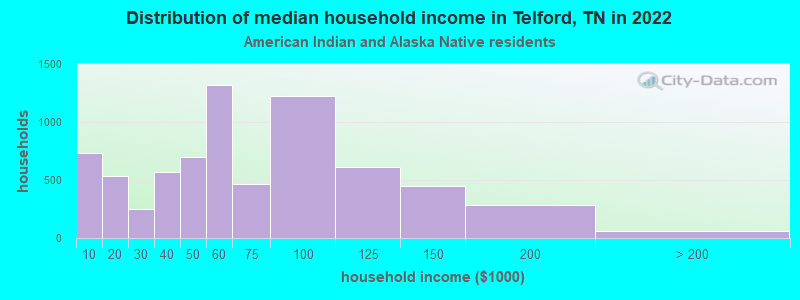
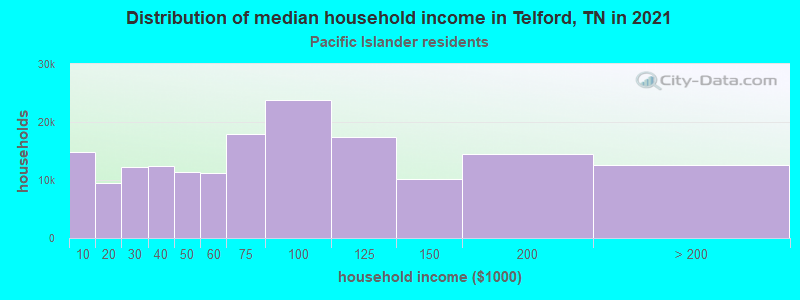
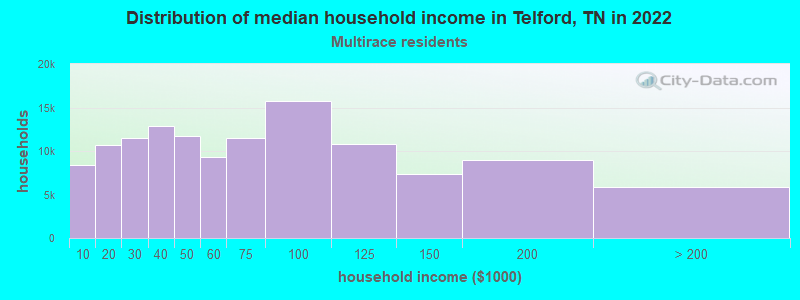
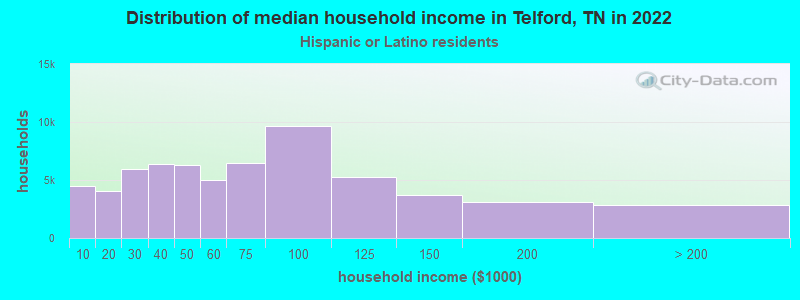
Income and house value in Telford
- Median household income in 2022
- $59,643White non-Hispanic householders
- $74,734Some other race householders
- $85,283Two or more races householders
- $105,410Hispanic or Latino race householders
- Median 2022 house value
- $251,779White Non-Hispanic householders
- $185,132Native Hawaiian and other Pacific Islander householders
- $265,166Two or more races householders