Races in Tallahassee, Florida (FL) Detailed Stats
Data:
Races - White alone (%)
Races - White alone (% change since 2000)
Races - Black alone (%)
Races - Black alone (% change since 2000)
Races - American Indian alone (%)
Races - American Indian alone (% change since 2000)
Races - Asian alone (%)
Races - Asian alone (% change since 2000)
Races - Hispanic (%)
Races - Hispanic (% change since 2000)
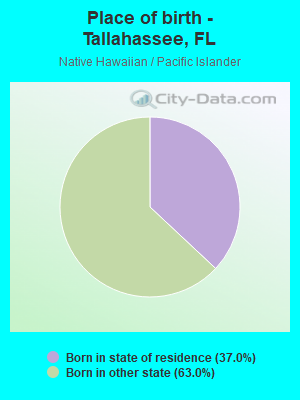
Races - Native Hawaiian and Other Pacific Islander alone (%)
Races - Native Hawaiian and Other Pacific Islander alone (% change since 2000)
Races - Two or more races(%)
Races - Two or more races(% change since 2000)
Races - Other race alone (%)
Races - Other race alone (% change since 2000)
Racial diversity
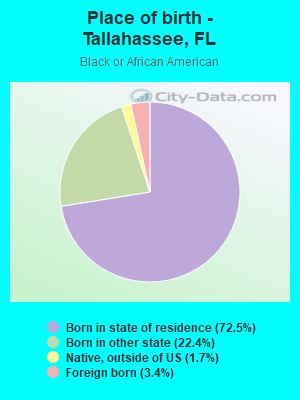
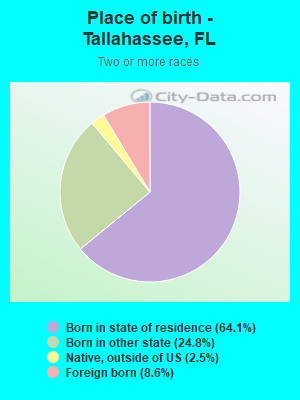
Place of birth - Born in state of residence (%)
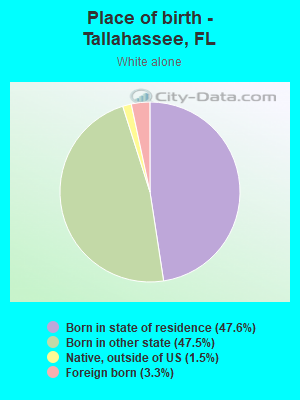
Place of birth - Born in state of residence (%) - White
Place of birth - Born in state of residence (%) - Black or African American
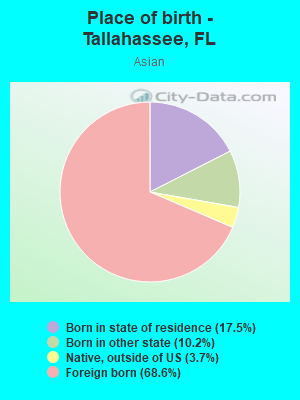
Place of birth - Born in state of residence (%) - Asian
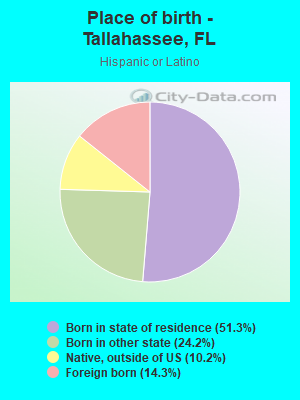
Place of birth - Born in state of residence (%) - Hispanic or Latino
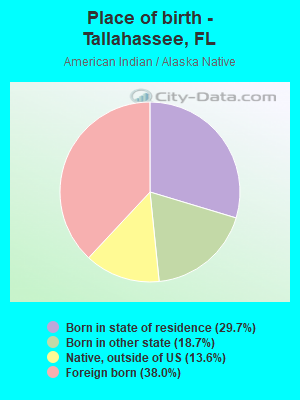
Place of birth - Born in state of residence (%) - American Indian and Alaska Native
Place of birth - Born in state of residence (%) - Multirace
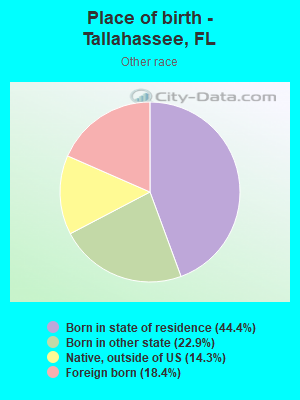
Place of birth - Born in state of residence (%) - Other Race
Place of birth - Born in other state (%)
Place of birth - Born in other state (%) - White
Place of birth - Born in other state (%) - Black or African American
Place of birth - Born in other state (%) - Asian
Place of birth - Born in other state (%) - Hispanic or Latino
Place of birth - Born in other state (%) - American Indian and Alaska Native
Place of birth - Born in other state (%) - Multirace
Place of birth - Born in other state (%) - Other Race
Place of birth - Native, outside of US (%)
Place of birth - Native, outside of US (%) - White
Place of birth - Native, outside of US (%) - Black or African American
Place of birth - Native, outside of US (%) - Asian
Place of birth - Native, outside of US (%) - Hispanic or Latino
Place of birth - Native, outside of US (%) - American Indian and Alaska Native
Place of birth - Native, outside of US (%) - Multirace
Place of birth - Native, outside of US (%) - Other Race
Place of birth - Foreign born (%)
Place of birth - Foreign born (%) - White
Place of birth - Foreign born (%) - Black or African American
Place of birth - Foreign born (%) - Asian
Place of birth - Foreign born (%) - Hispanic or Latino
Place of birth - Foreign born (%) - American Indian and Alaska Native
Place of birth - Foreign born (%) - Multirace
Place of birth - Foreign born (%) - Other Race
Residents speaking English at home (%)
Residents speaking English at home - Born in the United States (%)
Residents speaking English at home - Native, born elsewhere (%)
Residents speaking English at home - Foreign born (%)
Residents speaking Spanish at home (%)
Residents speaking Spanish at home - Born in the United States (%)
Residents speaking Spanish at home - Native, born elsewhere (%)
Residents speaking Spanish at home - Foreign born (%)
Residents speaking other language at home (%)
Residents speaking other language at home - Born in the United States (%)
Residents speaking other language at home - Native, born elsewhere (%)
Residents speaking other language at home - Foreign born (%)
Marital status - Never married (%)
Marital status - Now married (%)
Marital status - Separated (%)
Marital status - Widowed (%)
Marital status - Divorced (%)
Ancestries Reported - Arab (%)
Ancestries Reported - Czech (%)
Ancestries Reported - Danish (%)
Ancestries Reported - Dutch (%)
Ancestries Reported - English (%)
Ancestries Reported - French (%)
Ancestries Reported - French Canadian (%)
Ancestries Reported - German (%)
Ancestries Reported - Greek (%)
Ancestries Reported - Hungarian (%)
Ancestries Reported - Irish (%)
Ancestries Reported - Italian (%)
Ancestries Reported - Lithuanian (%)
Ancestries Reported - Norwegian (%)
Ancestries Reported - Polish (%)
Ancestries Reported - Portuguese (%)
Ancestries Reported - Russian (%)
Ancestries Reported - Scotch-Irish (%)
Ancestries Reported - Scottish (%)
Ancestries Reported - Slovak (%)
Ancestries Reported - Subsaharan African (%)
Ancestries Reported - Swedish (%)
Ancestries Reported - Swiss (%)
Ancestries Reported - Ukrainian (%)
Ancestries Reported - United States (%)
Ancestries Reported - Welsh (%)
Ancestries Reported - West Indian (%)
Ancestries Reported - Other (%)
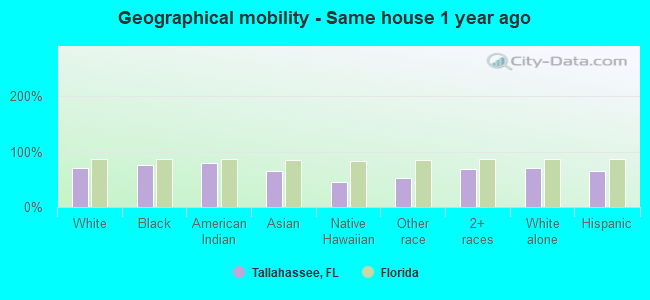
Geographical mobility - Same house 1 year ago (%)
Geographical mobility - Same house 1 year ago (%) - White
Geographical mobility - Same house 1 year ago (%) - Black or African American
Geographical mobility - Same house 1 year ago (%) - Asian
Geographical mobility - Same house 1 year ago (%) - Hispanic or Latino
Geographical mobility - Same house 1 year ago (%) - American Indian and Alaska Native
Geographical mobility - Same house 1 year ago (%) - Multirace
Geographical mobility - Same house 1 year ago (%) - Other Race
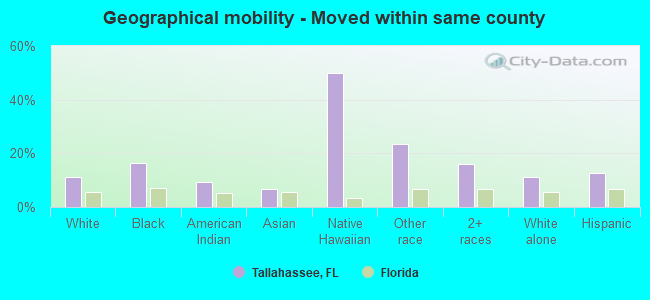
Geographical mobility - Moved within same county (%)
Geographical mobility - Moved within same county (%) - White
Geographical mobility - Moved within same county (%) - Black or African American
Geographical mobility - Moved within same county (%) - Asian
Geographical mobility - Moved within same county (%) - Hispanic or Latino
Geographical mobility - Moved within same county (%) - American Indian and Alaska Native
Geographical mobility - Moved within same county (%) - Multirace
Geographical mobility - Moved within same county (%) - Other Race
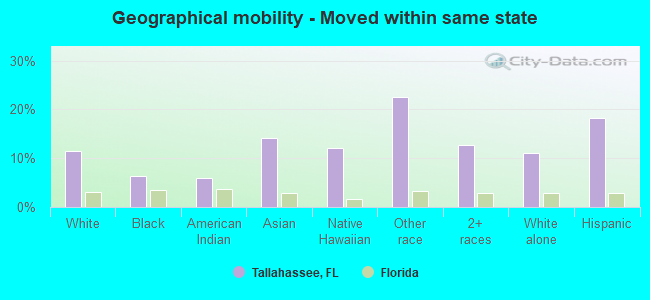
Geographical mobility - Moved from different county within same state (%)
Geographical mobility - Moved from different county within same state (%) - White
Geographical mobility - Moved from different county within same state (%) - Black or African American
Geographical mobility - Moved from different county within same state (%) - Asian
Geographical mobility - Moved from different county within same state (%) - Hispanic or Latino
Geographical mobility - Moved from different county within same state (%) - American Indian and Alaska Native
Geographical mobility - Moved from different county within same state (%) - Multirace
Geographical mobility - Moved from different county within same state (%) - Other Race
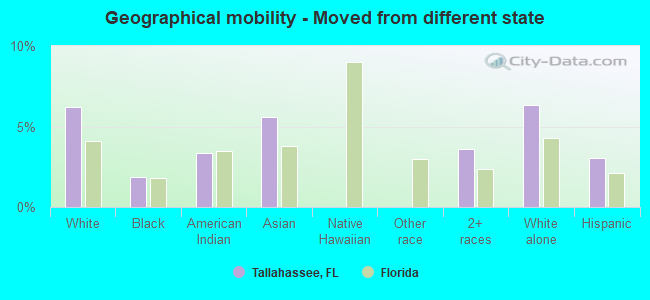
Geographical mobility - Moved from different state (%)
Geographical mobility - Moved from different state (%) - White
Geographical mobility - Moved from different state (%) - Black or African American
Geographical mobility - Moved from different state (%) - Asian
Geographical mobility - Moved from different state (%) - Hispanic or Latino
Geographical mobility - Moved from different state (%) - American Indian and Alaska Native
Geographical mobility - Moved from different state (%) - Multirace
Geographical mobility - Moved from different state (%) - Other Race
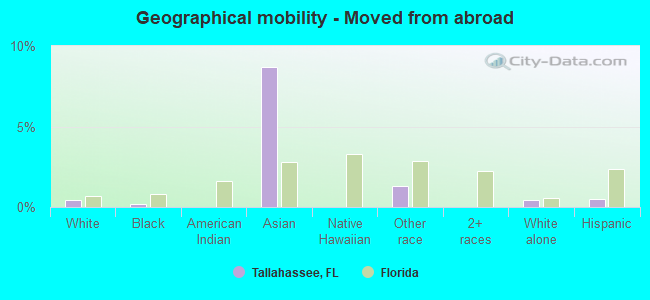
Geographical mobility - Moved from abroad (%)
Geographical mobility - Moved from abroad (%) - White
Geographical mobility - Moved from abroad (%) - Black or African American
Geographical mobility - Moved from abroad (%) - Asian
Geographical mobility - Moved from abroad (%) - Hispanic or Latino
Geographical mobility - Moved from abroad (%) - American Indian and Alaska Native
Geographical mobility - Moved from abroad (%) - Multirace
Geographical mobility - Moved from abroad (%) - Other Race
Place of birth for the foreign-born population - Ireland (%)
Place of birth for the foreign-born population - Denmark (%)
Place of birth for the foreign-born population - Norway (%)
Place of birth for the foreign-born population - Sweden (%)
Place of birth for the foreign-born population - United Kingdom (%)
Place of birth for the foreign-born population - England (%)
Place of birth for the foreign-born population - Scotland (%)
Place of birth for the foreign-born population - Other Northern Europe (%)
Place of birth for the foreign-born population - Austria (%)
Place of birth for the foreign-born population - Belgium (%)
Place of birth for the foreign-born population - France (%)
Place of birth for the foreign-born population - Germany (%)
Place of birth for the foreign-born population - Netherlands (%)
Place of birth for the foreign-born population - Switzerland (%)
Place of birth for the foreign-born population - Other Western Europe (%)
Place of birth for the foreign-born population - Greece (%)
Place of birth for the foreign-born population - Italy (%)
Place of birth for the foreign-born population - Portugal (%)
Place of birth for the foreign-born population - Spain (%)
Place of birth for the foreign-born population - Other Southern Europe (%)
Place of birth for the foreign-born population - Albania (%)
Place of birth for the foreign-born population - Belarus (%)
Place of birth for the foreign-born population - Bosnia and Herzegovina (%)
Place of birth for the foreign-born population - Bulgaria (%)
Place of birth for the foreign-born population - Croatia (%)
Place of birth for the foreign-born population - Czechoslovakia (%)
Place of birth for the foreign-born population - Hungary (%)
Place of birth for the foreign-born population - Latvia (%)
Place of birth for the foreign-born population - Lithuania (%)
Place of birth for the foreign-born population - North Macedonia (Macedonia) (%)
Place of birth for the foreign-born population - Moldova (%)
Place of birth for the foreign-born population - Poland (%)
Place of birth for the foreign-born population - Romania (%)
Place of birth for the foreign-born population - Russia (%)
Place of birth for the foreign-born population - Serbia (%)
Place of birth for the foreign-born population - Ukraine (%)
Place of birth for the foreign-born population - Other Eastern Europe (%)
Place of birth for the foreign-born population - China (%)
Place of birth for the foreign-born population - Hong Kong (%)
Place of birth for the foreign-born population - Taiwan (%)
Place of birth for the foreign-born population - Japan (%)
Place of birth for the foreign-born population - Korea (%)
Place of birth for the foreign-born population - Other Eastern Asia (%)
Place of birth for the foreign-born population - Afghanistan (%)
Place of birth for the foreign-born population - Bangladesh (%)
Place of birth for the foreign-born population - India (%)
Place of birth for the foreign-born population - Iran (%)
Place of birth for the foreign-born population - Kazakhstan (%)
Place of birth for the foreign-born population - Nepal (%)
Place of birth for the foreign-born population - Pakistan (%)
Place of birth for the foreign-born population - Sri Lanka (%)
Place of birth for the foreign-born population - Uzbekistan (%)
Place of birth for the foreign-born population - Other South Central Asia (%)
Place of birth for the foreign-born population - Burma (%)
Place of birth for the foreign-born population - Cambodia (%)
Place of birth for the foreign-born population - Indonesia (%)
Place of birth for the foreign-born population - Laos (%)
Place of birth for the foreign-born population - Malaysia (%)
Place of birth for the foreign-born population - Philippines (%)
Place of birth for the foreign-born population - Singapore (%)
Place of birth for the foreign-born population - Thailand (%)
Place of birth for the foreign-born population - Vietnam (%)
Place of birth for the foreign-born population - Other South Eastern Asia (%)
Place of birth for the foreign-born population - Armenia (%)
Place of birth for the foreign-born population - Iraq (%)
Place of birth for the foreign-born population - Israel (%)
Place of birth for the foreign-born population - Jordan (%)
Place of birth for the foreign-born population - Kuwait (%)
Place of birth for the foreign-born population - Lebanon (%)
Place of birth for the foreign-born population - Saudi Arabia (%)
Place of birth for the foreign-born population - Syria (%)
Place of birth for the foreign-born population - Turkey (%)
Place of birth for the foreign-born population - Yemen (%)
Place of birth for the foreign-born population - Other Western Asia (%)
Place of birth for the foreign-born population - Eritrea (%)
Place of birth for the foreign-born population - Ethiopia (%)
Place of birth for the foreign-born population - Kenya (%)
Place of birth for the foreign-born population - Somalia (%)
Place of birth for the foreign-born population - Uganda (%)
Place of birth for the foreign-born population - Zimbabwe (%)
Place of birth for the foreign-born population - Other Eastern Africa (%)
Place of birth for the foreign-born population - Cameroon (%)
Place of birth for the foreign-born population - Congo (%)
Place of birth for the foreign-born population - Democratic Republic of Congo (Zaire) (%)
Place of birth for the foreign-born population - Other Middle Africa (%)
Place of birth for the foreign-born population - Egypt (%)
Place of birth for the foreign-born population - Morocco (%)
Place of birth for the foreign-born population - Sudan (%)
Place of birth for the foreign-born population - Other Northern Africa (%)
Place of birth for the foreign-born population - South Africa (%)
Place of birth for the foreign-born population - Other Southern Africa (%)
Place of birth for the foreign-born population - Cabo Verde (%)
Place of birth for the foreign-born population - Ghana (%)
Place of birth for the foreign-born population - Liberia (%)
Place of birth for the foreign-born population - Nigeria (%)
Place of birth for the foreign-born population - Senegal (%)
Place of birth for the foreign-born population - Sierra Leone (%)
Place of birth for the foreign-born population - Other Western Africa (%)
Place of birth for the foreign-born population - Australia (%)
Place of birth for the foreign-born population - New Zealand (%)
Place of birth for the foreign-born population - Fiji (%)
Place of birth for the foreign-born population - Micronesia (%)
Place of birth for the foreign-born population - Bahamas (%)
Place of birth for the foreign-born population - Barbados (%)
Place of birth for the foreign-born population - Cuba (%)
Place of birth for the foreign-born population - Dominica (%)
Place of birth for the foreign-born population - Dominican Republic (%)
Place of birth for the foreign-born population - Grenada (%)
Place of birth for the foreign-born population - Haiti (%)
Place of birth for the foreign-born population - Jamaica (%)
Place of birth for the foreign-born population - St. Vincent and the Grenadines (%)
Place of birth for the foreign-born population - Trinidad and Tobago (%)
Place of birth for the foreign-born population - West Indies (%)
Place of birth for the foreign-born population - Other Caribbean (%)
Place of birth for the foreign-born population - Belize (%)
Place of birth for the foreign-born population - Costa Rica (%)
Place of birth for the foreign-born population - El Salvador (%)
Place of birth for the foreign-born population - Guatemala (%)
Place of birth for the foreign-born population - Honduras (%)
Place of birth for the foreign-born population - Mexico (%)
Place of birth for the foreign-born population - Nicaragua (%)
Place of birth for the foreign-born population - Panama (%)
Place of birth for the foreign-born population - Other Central America (%)
Place of birth for the foreign-born population - Argentina (%)
Place of birth for the foreign-born population - Bolivia (%)
Place of birth for the foreign-born population - Brazil (%)
Place of birth for the foreign-born population - Chile (%)
Place of birth for the foreign-born population - Colombia (%)
Place of birth for the foreign-born population - Ecuador (%)
Place of birth for the foreign-born population - Guyana (%)
Place of birth for the foreign-born population - Peru (%)
Place of birth for the foreign-born population - Uruguay (%)
Place of birth for the foreign-born population - Venezuela (%)
Place of birth for the foreign-born population - Other South America (%)
Place of birth for the foreign-born population - Canada (%)
Place of birth for the foreign-born population - Other Northern America (%)
Place of birth for the foreign-born population - Other (%)
Latest news about races in Tallahassee, FL collected exclusively by city-data.com from local newspapers, TV, and radio stations
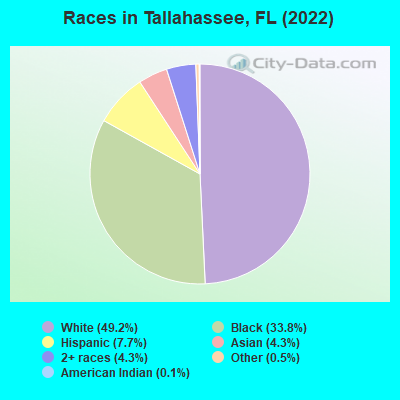
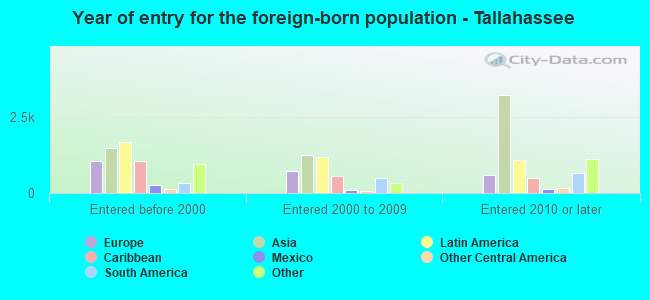
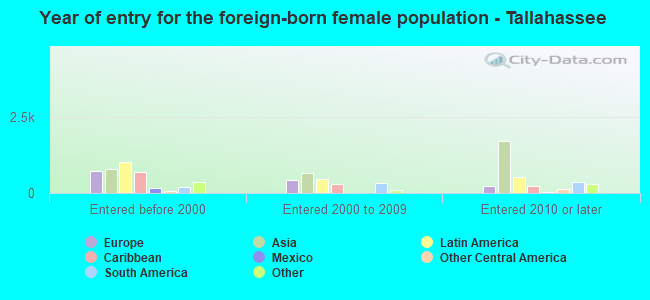
According to 2022 data, the most numerous races in Tallahassee, FL are White alone (99,160 residents), Hispanic (15,624 residents), and Black alone (68,232 residents). 88.2% of Tallahassee residents speak English at home. 7.7% of Tallahassee, FL residents are foreign-born (3.4% born in Asia, 2.2% born in Latin America, 0.9% born in Europe), which is 172.7% less than the foreign-born rate of 21.0% across the entire state of Florida.
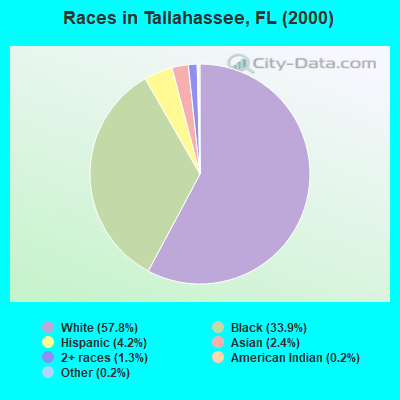
Race distribution in Tallahassee
2000 2022
87,047 57.8% White alone 51,025 33.9% Black alone 6,309 4.2% Hispanic 3,575 2.4% Asian alone 2,009 1.3% Two or more races 233 0.2% Other race alone 349 0.2% American Indian alone 77 0.05% Native Hawaiian and Other
99,160 49.2% White alone 68,232 33.8% Black alone 15,624 7.7% Hispanic 8,681 4.3% Two or more races 8,701 4.3% Asian alone 1,015 0.5% Other race alone 288 0.1% American Indian alone 27 0.01% Native Hawaiian and Other
2000 2022
10,458,509 65.4% White alone 2,682,715 16.8% Hispanic 2,264,268 14.2% Black alone 261,693 1.6% Asian alone 236,954 1.5% Two or more races 42,358 0.3% American Indian alone 28,994 0.2% Other race alone 6,887 0.04% Native Hawaiian and Other
11,309,403 50.8% White alone 6,025,039 27.1% Hispanic 3,241,015 14.6% Black alone 861,630 3.9% Two or more races 623,692 2.8% Asian alone 152,054 0.7% Other race alone 22,504 0.1% American Indian alone 9,486 0.04% Native Hawaiian and Other
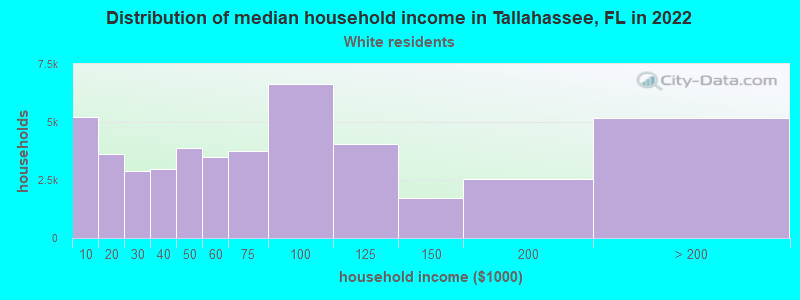
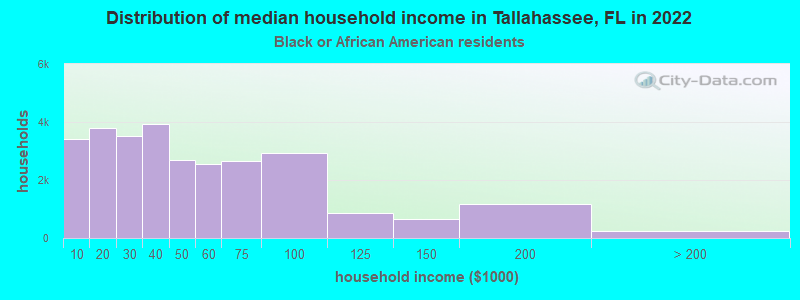
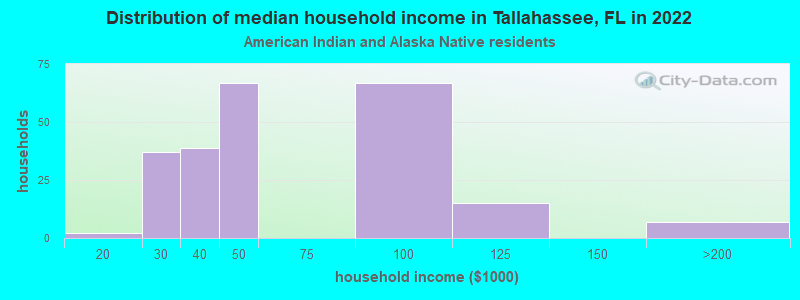
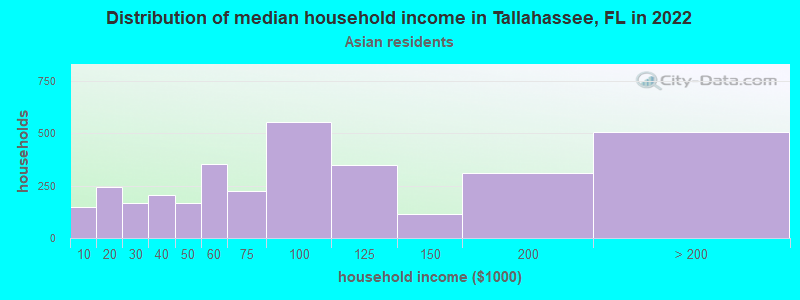
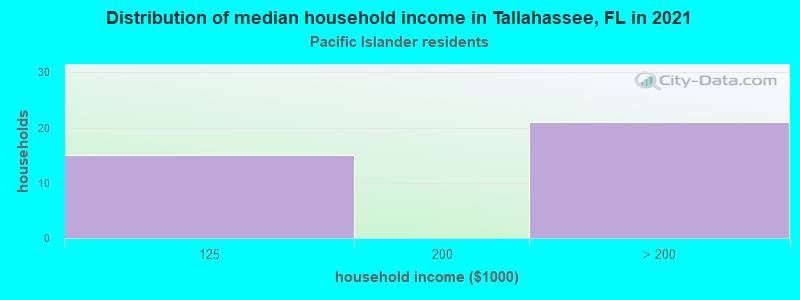
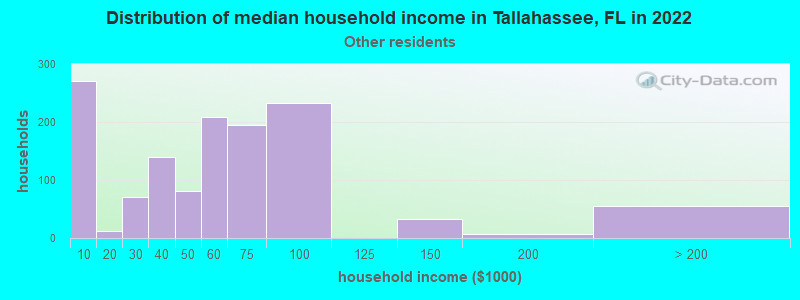
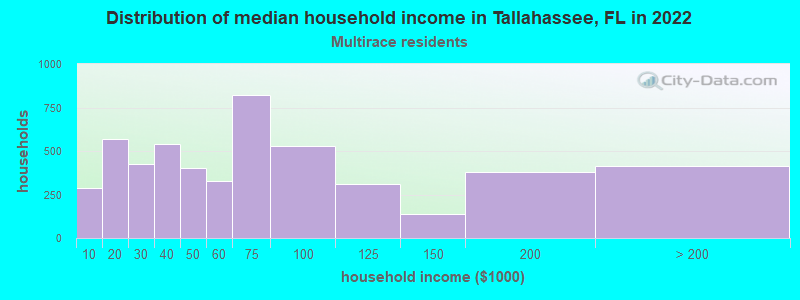
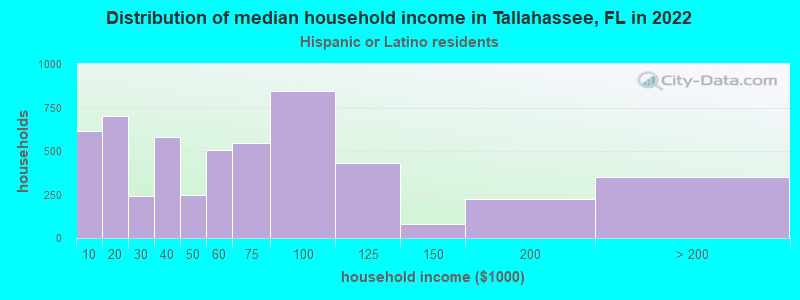
Income and house value in Tallahassee Median household income in 2022 $62,847 White non-Hispanic householders$38,922 Black householders$33,634 American Indian and Alaska Native householders$74,819 Asian householders$59,256 Some other race householders$64,459 Two or more races householders$57,530 Hispanic or Latino race householdersMedian 2022 house value $331,460 White Non-Hispanic householders$212,767 Black or African American householders$238,264 American Indian or Alaska Native householders $428,758 Asian householders$257,313 Some other race householders$284,569 Two or more races householders$295,119 Hispanic or Latino householders
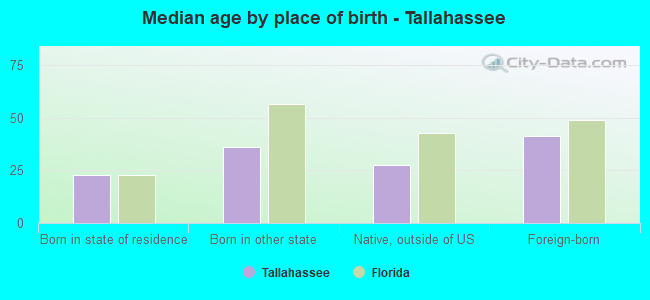
Median age by race in Tallahassee
30.8 Median age for White residents30.5 31.4 25.6 Median age for Black or African American residents24.8 26.1 32.8 Median age for American Indian / Alaska Native residents49.3 32.7 33.2 Median age for Asian residents33.1 33.7 -666,666,666.0 Median age for Native Hawaiian / Pacific Islander residents-666,666,666.0 -666,666,666.0 22.4 Median age for Other race residents27.1 21.7 21.5 Median age for Two or more races residents21.5 21.6 32.0 Median age for White alone residents31.6 32.3 22.8 Median age for Hispanic or Latino residents22.6 23.4
Owner/renter occupied households by race in Tallahassee
House owners and renters - White residents 22,697 49.4% Owner occupied23,252 50.6% Renter occupiedHouse owners and renters - Black or African American residents 8,058 28.4% Owner occupied20,357 71.6% Renter occupiedHouse owners and renters - American Indian / Alaska Native residents 125 60.6% Owner occupied81 39.4% Renter occupiedHouse owners and renters - Asian residents 1,512 48.5% Owner occupied1,607 51.5% Renter occupiedHouse owners and renters - Native Hawaiian / Pacific Islander residents 19 41.5% Owner occupied27 58.5% Renter occupiedHouse owners and renters - Other race residents 339 25.6% Owner occupied987 74.4% Renter occupiedHouse owners and renters - Two or more races residents 1,453 31.0% Owner occupied3,233 69.0% Renter occupiedHouse owners and renters - White alone residents 22,252 50.1% Owner occupied22,187 49.9% Renter occupiedHouse owners and renters - Hispanic or Latino residents 1,577 29.4% Owner occupied3,794 70.6% Renter occupied
Language usage in Tallahassee
English speakers - Total 88.2% of residents of Tallahassee speak English at home.
4.8% of residents speak Spanish at home 7,390 79.1% Speak English very well1,957 20.9% Speak English less than very well6.9% of residents speak other language at home 8,328 62.4% Speak English very well5,018 37.6% Speak English less than very well
English speakers - Born in the United States 93.9% of residents of Tallahassee speak English at home.
3.1% of residents speak Spanish at home 1,998 93.0% Speak English very well150 7.0% Speak English less than very well2.9% of residents speak other language at home 1,844 91.7% Speak English very well167 8.3% Speak English less than very well
English speakers - Native, born elsewhere 58.2% of residents of Tallahassee speak English at home.
31.7% of residents speak Spanish at home 921 60.8% Speak English very well593 39.2% Speak English less than very well10.1% of residents speak other language at home 159 32.9% Speak English very well325 67.1% Speak English less than very well
English speakers - Foreign-born 24.0% of residents of Tallahassee speak English at home.
14.2% of residents speak Spanish at home 992 49.3% Speak English very well1,022 50.7% Speak English less than very well61.8% of residents speak other language at home 4,508 51.4% Speak English very well4,266 48.6% Speak English less than very well
White (Caucasian) - Speak only English Native:
95.8% (92,679)Foreign-born:
42.5% (1,462)
White (Caucasian) - Speak another language Native:
4.2% (4,019)Foreign-born:
57.5% (1,981)
Black or African American - Speak only English Native:
97.0% (60,570)Foreign-born:
26.6% (625)
Black or African American - Speak another language Native:
3.0% (1,872)Foreign-born:
73.4% (1,722)
American Indian / Alaska Native - Speak another language Native:
91.0% (329)Foreign-born:
100.0% (246)
Asian - Speak only English Native:
40.2% (1,065)Foreign-born:
18.0% (1,056)
Asian - Speak another language Native:
59.8% (1,583)Foreign-born:
82.0% (4,810)
Other race - Speak another language Native:
44.5% (2,040)Foreign-born:
100.0% (1,114)
Two or more races - Speak only English Native:
81.2% (9,959)Foreign-born:
21.8% (273)
Two or more races - Speak another language Native:
18.8% (2,301)Foreign-born:
78.2% (978)
White alone - Speak only English Native:
97.4% (90,910)Foreign-born:
44.4% (1,412)
White alone - Speak another language Native:
2.6% (2,389)Foreign-born:
55.6% (1,767)
Hispanic or Latino - Speak only English Native:
49.5% (6,142)Foreign-born:
6.3% (141)
Hispanic or Latino - Speak another language Native:
50.5% (6,261)Foreign-born:
93.7% (2,094)
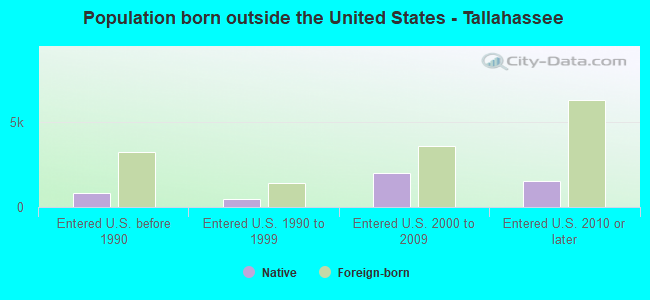
Foreign-born residents in Tallahassee 15,434 residents are foreign born (3.4% Asia , 2.2% Latin America , 0.9% Europe ).
This city:
7.7%Florida:
21.1%
Marital status for residents in Tallahassee Marital status - White (Caucasian) population 15 years and over
Males 53.2% Never married37.2% Now married0.6% Separated1.5% Widowed7.5% DivorcedFemales 50.9% Never married31.7% Now married1.3% Separated7.1% Widowed9.0% DivorcedWomen who gave birth in the past 12 months Now married:
73.5% (554)Unmarried:
26.5% (200)
Women who did not give birth in the past 12 months Now married:
23.8% (7,485)Unmarried:
76.2% (24,002)
Marital status - Black or African American population 15 years and over
Males 67.7% Never married14.9% Now married3.9% Separated2.8% Widowed10.7% DivorcedFemales 75.8% Never married10.5% Now married1.3% Separated2.1% Widowed10.2% DivorcedWomen who gave birth in the past 12 months Now married:
39.4% (419)Unmarried:
60.6% (644)
Women who did not give birth in the past 12 months Now married:
13.2% (3,304)Unmarried:
86.8% (21,728)
Marital status - American Indian / Alaska Native population 15 years and over
Males 36.3% Never married58.6% Now married0.0% Separated0.0% Widowed5.1% DivorcedFemales 73.0% Never married25.7% Now married0.0% Separated0.0% Widowed1.3% DivorcedWomen who did not give birth in the past 12 months Now married:
23.7% (87)Unmarried:
76.3% (280)
Marital status - Asian population 15 years and over
Males 42.3% Never married57.2% Now married0.0% Separated0.0% Widowed0.5% DivorcedFemales 40.9% Never married51.1% Now married1.2% Separated5.3% Widowed1.5% DivorcedWomen who gave birth in the past 12 months Now married:
100.0% (75)Unmarried:
0.0% (0)
Women who did not give birth in the past 12 months Now married:
44.8% (1,283)Unmarried:
55.2% (1,584)
Marital status - Native Hawaiian / Pacific Islander population 15 years and over
Males 100.0% Never married0.0% Now married0.0% Separated0.0% Widowed0.0% DivorcedFemales 0.0% Never married0.0% Now married0.0% Separated13.8% Widowed86.2% DivorcedWomen who did not give birth in the past 12 months Now married:
0.0% (0)Unmarried:
100.0% (19)
Marital status - Other race population 15 years and over
Males 78.4% Never married15.4% Now married0.0% Separated1.6% Widowed4.6% DivorcedFemales 72.4% Never married19.8% Now married0.0% Separated3.6% Widowed4.2% DivorcedWomen who gave birth in the past 12 months Now married:
25.0% (32)Unmarried:
75.0% (95)
Women who did not give birth in the past 12 months Now married:
14.2% (244)Unmarried:
85.8% (1,476)
Marital status - Two or more races population 15 years and over
Males 67.9% Never married23.1% Now married0.0% Separated2.1% Widowed6.9% DivorcedFemales 56.6% Never married28.6% Now married0.0% Separated10.1% Widowed4.8% DivorcedWomen who gave birth in the past 12 months Now married:
87.1% (65)Unmarried:
12.9% (10)
Women who did not give birth in the past 12 months Now married:
21.7% (833)Unmarried:
78.3% (2,998)
Marital status - White alone, not Hispanic / Latino population 15 years and over
Males 52.2% Never married38.2% Now married0.6% Separated1.6% Widowed7.4% DivorcedFemales 50.6% Never married31.6% Now married1.4% Separated7.3% Widowed9.1% DivorcedWomen who gave birth in the past 12 months Now married:
73.5% (554)Unmarried:
26.5% (200)
Women who did not give birth in the past 12 months Now married:
23.1% (6,909)Unmarried:
76.9% (22,963)
Marital status - Hispanic or Latino population 15 years and over
Males 68.8% Never married18.1% Now married0.0% Separated0.8% Widowed12.3% DivorcedFemales 59.0% Never married28.5% Now married0.0% Separated6.6% Widowed6.0% DivorcedWomen who gave birth in the past 12 months Now married:
73.1% (215)Unmarried:
26.9% (79)
Women who did not give birth in the past 12 months Now married:
20.6% (1,216)Unmarried:
79.4% (4,687)
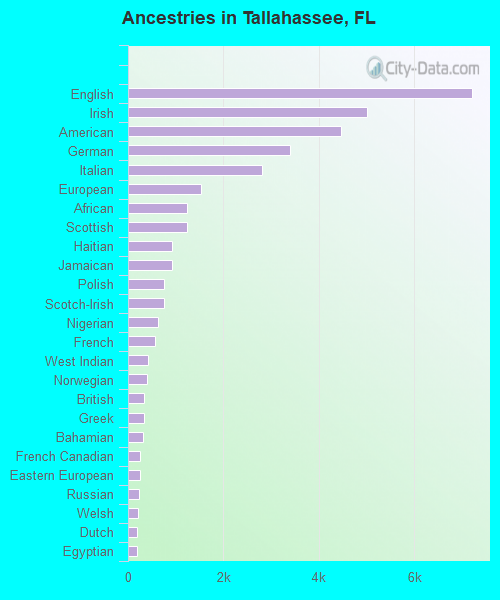
Ancestries in Tallahassee
7,204 7.9% English5,013 5.5% Irish4,457 4.9% American3,392 3.7% German2,810 3.1% Italian1,520 1.7% European1,236 1.4% African1,229 1.3% Scottish924 1.0% Haitian920 1.0% Jamaican763 0.8% Polish755 0.8% Scotch-Irish627 0.7% Nigerian569 0.6% French422 0.5% West Indian397 0.4% Norwegian336 0.4% British331 0.4% Greek315 0.3% Bahamian244 0.3% French Canadian243 0.3% Eastern European237 0.3% Russian208 0.2% Welsh190 0.2% Dutch180 0.2% Egyptian167 0.2% Iranian160 0.2% Canadian158 0.2% Swedish155 0.2% Northern European139 0.2% Serbian129 0.1% Hungarian128 0.1% Brazilian112 0.1% Danish110 0.1% Turkish108 0.1% Lebanese104 0.1% Ukrainian100 0.1% Scandinavian96 0.1% Czech77 0.08% Portuguese73 0.08% U.S. Virgin Islander70 0.08% Swiss66 0.07% Ghanaian63 0.07% Basque63 0.07% Romanian57 0.06% Arab45 0.05% Finnish41 0.04% Croatian39 0.04% Slovak38 0.04% Trinidadian and Tobagonian37 0.04% Guyanese34 0.04% Lithuanian32 0.03% Belgian32 0.03% Palestinian30 0.03% Armenian27 0.03% British West Indian22 0.02% Israeli22 0.02% Barbadian21 0.02% Albanian20 0.02% Slavic19 0.02% Jordanian19 0.02% Icelander19 0.02% Celtic18 0.02% Liberian18 0.02% Australian18 0.02% Yugoslavian10 0.01% Sudanese9 0.01% Zimbabwean7 0.01% Syrian6 0.01% Carpatho Rusyn
Geographical mobility in Tallahassee Same house 1 year ago 72,755 70.9% White (Caucasian)50,355 75.2% Black or African American477 79.2% American Indian / Alaska Native5,649 64.8% Asian38 45.6% Native Hawaiian / Pacific Islander3,178 52.5% Other race9,600 67.7% Two or more races70,108 71.0% White alone, not Hispanic / Latino10,133 65.5% Hispanic or LatinoMoved within same county 11,296 11.0% White / Caucasian11,043 16.5% Black or African American57 9.4% American Indian / Alaska Native599 6.9% Asian41 49.8% Native Hawaiian / Pacific Islander1,428 23.6% Other race2,249 15.9% Two or more races11,099 11.2% White alone, not Hispanic / Latino1,964 12.7% Hispanic or LatinoMoved within same state 11,776 11.5% White / Caucasian4,251 6.3% Black or African American36 5.9% American Indian / Alaska Native1,228 14.1% Asian10 12.1% Native Hawaiian / Pacific Islander1,364 22.6% Other race1,816 12.8% Two or more races10,928 11.1% White alone, not Hispanic / Latino2,833 18.3% Hispanic or LatinoMoved from different state 6,393 6.2% White / Caucasian1,233 1.8% Black or African American20 3.4% American Indian / Alaska Native487 5.6% Asian510 3.6% Two or more races6,242 6.3% White alone, not Hispanic / Latino468 3.0% Hispanic or LatinoMoved from abroad 436 0.4% White105 0.2% Black or African American760 8.7% Asian78 1.3% Other race436 0.4% White alone, not Hispanic / Latino78 0.5% Hispanic or Latino
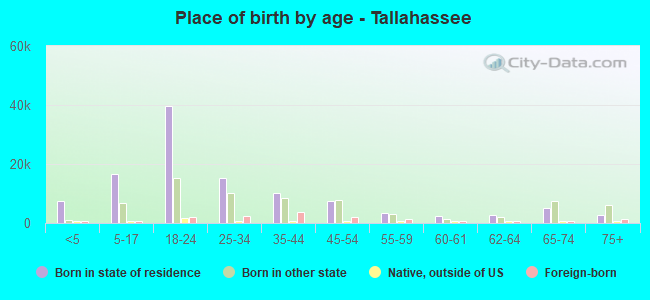
Children Nativity (place of birth) in Tallahassee
Children under 6 years - Living with two parents Both parents native 3,718 100.0% NativeBoth parents foreign-born 458 60.4% Native300 39.6% Foreign-bornOne native, one foreign-born parent 723 100.0% NativeChildren under 6 years - Living with one parent Native parent 4,169 100.0% NativeForeign-born parent 185 100.0% NativeChildren 6 to 17 years - Living with two parents Both parents native 8,333 100.0% NativeBoth parents foreign-born 1,526 84.4% Native281 15.6% Foreign-bornOne native, one foreign-born parent 1,025 96.3% Native39 3.7% Foreign-bornChildren 6 to 17 years - Living with one parent Native parent 8,648 100.0% NativeForeign-born parent 1,880 50.0% Native1,880 50.0% Foreign-born
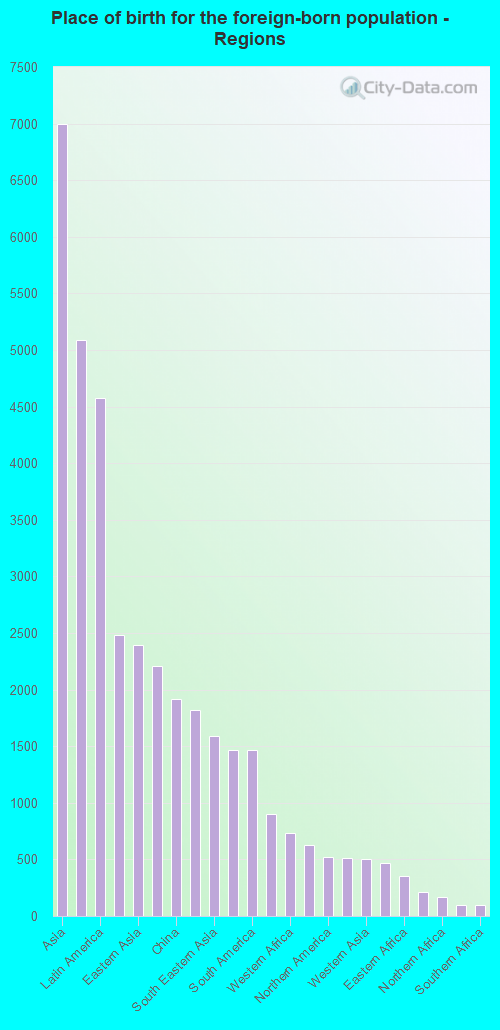
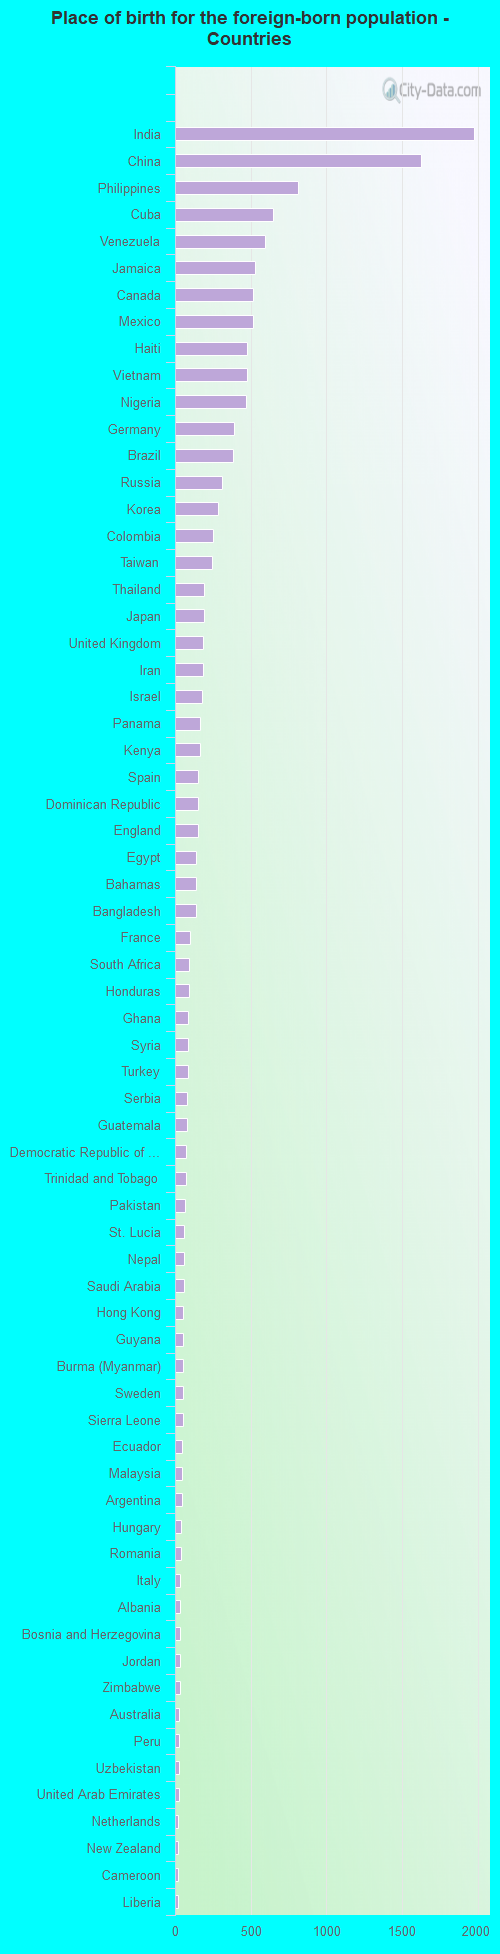
Place of birth for residents in Tallahassee 6,996 Asia5,092 Americas4,574 Latin America2,482 South Central Asia2,394 Eastern Asia2,207 Caribbean1,921 China1,823 Europe1,588 South Eastern Asia1,469 Africa1,465 South America901 Central America734 Western Africa624 Eastern Europe518 Northern America516 Western Europe504 Western Asia470 Northern Europe350 Eastern Africa212 Southern Europe169 Northern Africa96 Middle Africa94 Southern Africa51 Oceania51 Australia and New Zealand Subregion1,977 India1,623 China814 Philippines645 Cuba593 Venezuela527 Jamaica518 Canada514 Mexico473 Haiti473 Vietnam471 Nigeria388 Germany386 Brazil311 Russia281 Korea248 Colombia245 Taiwan193 Thailand191 Japan188 United Kingdom188 Iran179 Israel168 Panama165 Kenya151 Spain151 Dominican Republic149 England141 Egypt137 Bahamas136 Bangladesh98 France94 South Africa92 Honduras87 Ghana86 Syria84 Turkey81 Serbia78 Guatemala76 Democratic Republic of Congo (Zaire)70 Trinidad and Tobago63 Pakistan62 St. Lucia62 Nepal58 Saudi Arabia52 Hong Kong52 Guyana51 Burma (Myanmar)51 Sweden50 Sierra Leone49 Ecuador45 Malaysia43 Argentina41 Hungary40 Romania36 Italy36 Albania33 Bosnia and Herzegovina31 Jordan31 Zimbabwe28 Australia28 Peru26 Uzbekistan25 United Arab Emirates23 Netherlands23 New Zealand20 Cameroon20 Liberia17 Greece16 Iraq16 Kazakhstan15 Lebanon15 Nicaragua14 Ukraine14 Costa Rica13 Lithuania12 Sudan11 Togo10 St. Vincent and the Grenadines10 Sri Lanka10 Croatia9 El Salvador9 Ethiopia9 Indonesia9 Ivory Coast8 Poland8 Chile8 Uruguay8 Scotland6 Belize6 Kuwait6 Portugal5 Austria
Grandparents responsible for own grandchildren in Tallahassee
Grandparents (30 to 59 years) White / Caucasian 20 61.0% Responsible for grandchildren13 39.0% Not responsible for grandchildrenBlack or African American 143 45.7% Responsible for grandchildren170 54.3% Not responsible for grandchildrenOther race 48 100.0% Not responsible for grandchildrenTwo or more races 30 46.8% Responsible for grandchildren34 53.2% Not responsible for grandchildrenWhite alone, not Hispanic / Latino 9 35.8% Responsible for grandchildren16 64.2% Not responsible for grandchildrenHispanic or Latino 22 28.9% Responsible for grandchildren54 71.1% Not responsible for grandchildrenGrandparents (60 years and over) White / Caucasian 86 35.6% Responsible for grandchildren155 64.4% Not responsible for grandchildrenBlack or African American 132 38.5% Responsible for grandchildren211 61.5% Not responsible for grandchildrenOther race 9 100.0% Not responsible for grandchildrenTwo or more races 75 100.0% Not responsible for grandchildrenWhite alone, not Hispanic / Latino 93 35.6% Responsible for grandchildren167 64.4% Not responsible for grandchildrenHispanic or Latino 51 100.0% Not responsible for grandchildren
Zip codes: 32301 , 32303 , 32304 , 32305 , 32308 , 32309 , 32310 , 32311 , 32312 , 32317 , 32399.