Races in Syracuse, New York (NY) Detailed Stats
Data:
Races - White alone (%)
Races - White alone (% change since 2000)
Races - Black alone (%)
Races - Black alone (% change since 2000)
Races - American Indian alone (%)
Races - American Indian alone (% change since 2000)
Races - Asian alone (%)
Races - Asian alone (% change since 2000)
Races - Hispanic (%)
Races - Hispanic (% change since 2000)
Races - Native Hawaiian and Other Pacific Islander alone (%)
Races - Native Hawaiian and Other Pacific Islander alone (% change since 2000)
Races - Two or more races(%)
Races - Two or more races(% change since 2000)
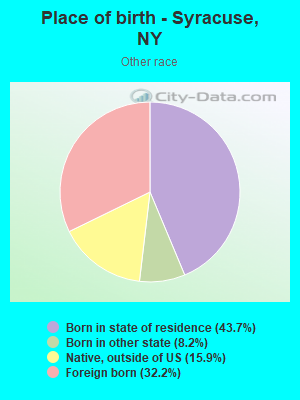
Races - Other race alone (%)
Races - Other race alone (% change since 2000)
Racial diversity
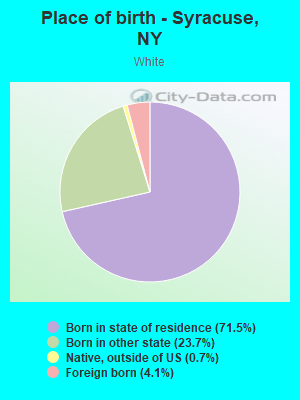
Place of birth - Born in state of residence (%)
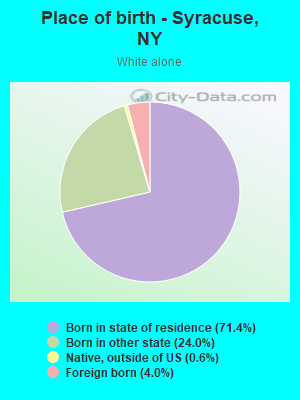
Place of birth - Born in state of residence (%) - White
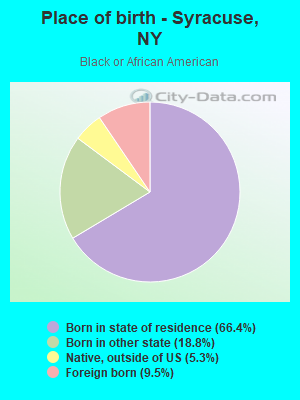
Place of birth - Born in state of residence (%) - Black or African American
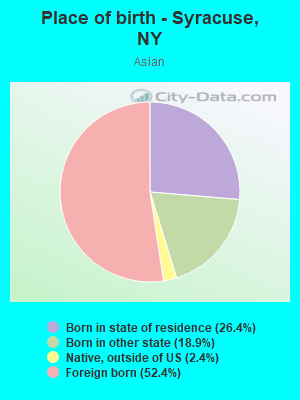
Place of birth - Born in state of residence (%) - Asian
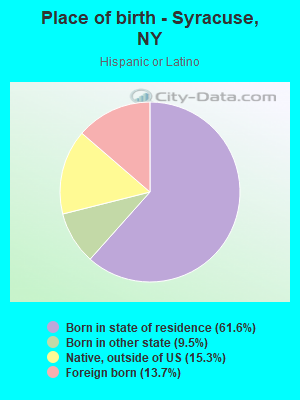
Place of birth - Born in state of residence (%) - Hispanic or Latino
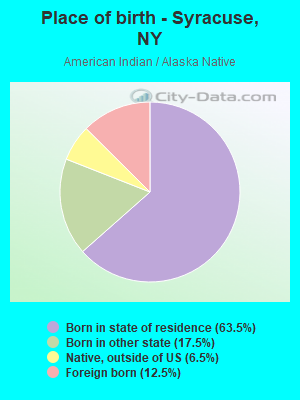
Place of birth - Born in state of residence (%) - American Indian and Alaska Native
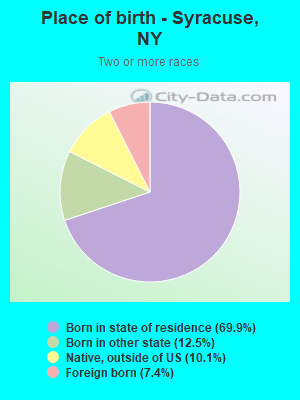
Place of birth - Born in state of residence (%) - Multirace
Place of birth - Born in state of residence (%) - Other Race
Place of birth - Born in other state (%)
Place of birth - Born in other state (%) - White
Place of birth - Born in other state (%) - Black or African American
Place of birth - Born in other state (%) - Asian
Place of birth - Born in other state (%) - Hispanic or Latino
Place of birth - Born in other state (%) - American Indian and Alaska Native
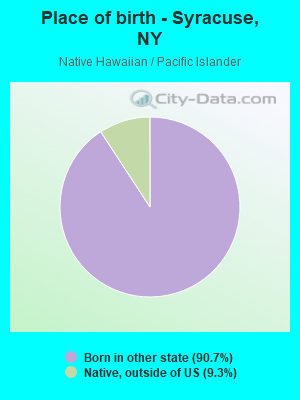
Place of birth - Born in other state (%) - Multirace
Place of birth - Born in other state (%) - Other Race
Place of birth - Native, outside of US (%)
Place of birth - Native, outside of US (%) - White
Place of birth - Native, outside of US (%) - Black or African American
Place of birth - Native, outside of US (%) - Asian
Place of birth - Native, outside of US (%) - Hispanic or Latino
Place of birth - Native, outside of US (%) - American Indian and Alaska Native
Place of birth - Native, outside of US (%) - Multirace
Place of birth - Native, outside of US (%) - Other Race
Place of birth - Foreign born (%)
Place of birth - Foreign born (%) - White
Place of birth - Foreign born (%) - Black or African American
Place of birth - Foreign born (%) - Asian
Place of birth - Foreign born (%) - Hispanic or Latino
Place of birth - Foreign born (%) - American Indian and Alaska Native
Place of birth - Foreign born (%) - Multirace
Place of birth - Foreign born (%) - Other Race
Residents speaking English at home (%)
Residents speaking English at home - Born in the United States (%)
Residents speaking English at home - Native, born elsewhere (%)
Residents speaking English at home - Foreign born (%)
Residents speaking Spanish at home (%)
Residents speaking Spanish at home - Born in the United States (%)
Residents speaking Spanish at home - Native, born elsewhere (%)
Residents speaking Spanish at home - Foreign born (%)
Residents speaking other language at home (%)
Residents speaking other language at home - Born in the United States (%)
Residents speaking other language at home - Native, born elsewhere (%)
Residents speaking other language at home - Foreign born (%)
Marital status - Never married (%)
Marital status - Now married (%)
Marital status - Separated (%)
Marital status - Widowed (%)
Marital status - Divorced (%)
Ancestries Reported - Arab (%)
Ancestries Reported - Czech (%)
Ancestries Reported - Danish (%)
Ancestries Reported - Dutch (%)
Ancestries Reported - English (%)
Ancestries Reported - French (%)
Ancestries Reported - French Canadian (%)
Ancestries Reported - German (%)
Ancestries Reported - Greek (%)
Ancestries Reported - Hungarian (%)
Ancestries Reported - Irish (%)
Ancestries Reported - Italian (%)
Ancestries Reported - Lithuanian (%)
Ancestries Reported - Norwegian (%)
Ancestries Reported - Polish (%)
Ancestries Reported - Portuguese (%)
Ancestries Reported - Russian (%)
Ancestries Reported - Scotch-Irish (%)
Ancestries Reported - Scottish (%)
Ancestries Reported - Slovak (%)
Ancestries Reported - Subsaharan African (%)
Ancestries Reported - Swedish (%)
Ancestries Reported - Swiss (%)
Ancestries Reported - Ukrainian (%)
Ancestries Reported - United States (%)
Ancestries Reported - Welsh (%)
Ancestries Reported - West Indian (%)
Ancestries Reported - Other (%)
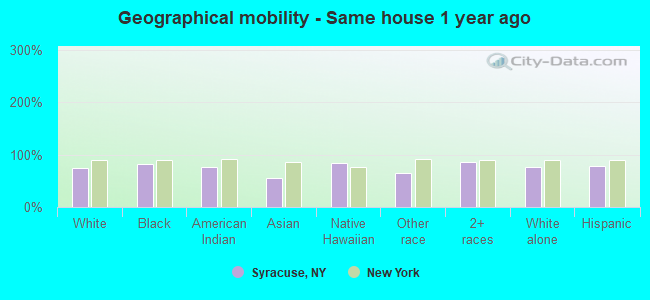
Geographical mobility - Same house 1 year ago (%)
Geographical mobility - Same house 1 year ago (%) - White
Geographical mobility - Same house 1 year ago (%) - Black or African American
Geographical mobility - Same house 1 year ago (%) - Asian
Geographical mobility - Same house 1 year ago (%) - Hispanic or Latino
Geographical mobility - Same house 1 year ago (%) - American Indian and Alaska Native
Geographical mobility - Same house 1 year ago (%) - Multirace
Geographical mobility - Same house 1 year ago (%) - Other Race
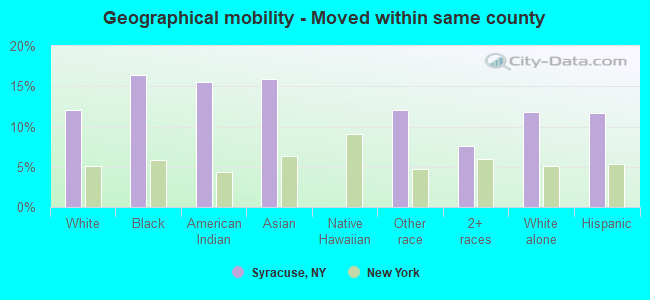
Geographical mobility - Moved within same county (%)
Geographical mobility - Moved within same county (%) - White
Geographical mobility - Moved within same county (%) - Black or African American
Geographical mobility - Moved within same county (%) - Asian
Geographical mobility - Moved within same county (%) - Hispanic or Latino
Geographical mobility - Moved within same county (%) - American Indian and Alaska Native
Geographical mobility - Moved within same county (%) - Multirace
Geographical mobility - Moved within same county (%) - Other Race
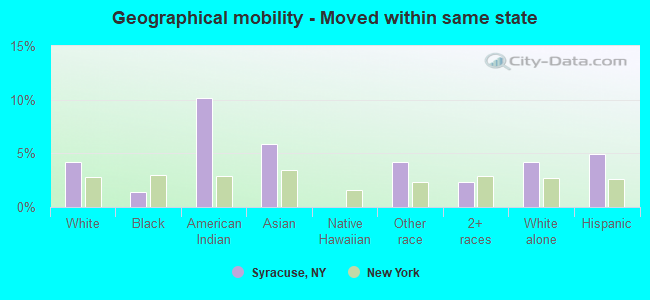
Geographical mobility - Moved from different county within same state (%)
Geographical mobility - Moved from different county within same state (%) - White
Geographical mobility - Moved from different county within same state (%) - Black or African American
Geographical mobility - Moved from different county within same state (%) - Asian
Geographical mobility - Moved from different county within same state (%) - Hispanic or Latino
Geographical mobility - Moved from different county within same state (%) - American Indian and Alaska Native
Geographical mobility - Moved from different county within same state (%) - Multirace
Geographical mobility - Moved from different county within same state (%) - Other Race
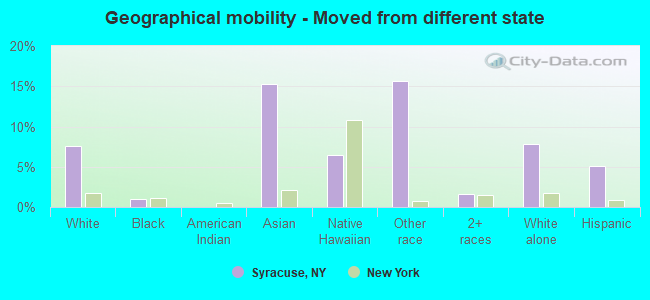
Geographical mobility - Moved from different state (%)
Geographical mobility - Moved from different state (%) - White
Geographical mobility - Moved from different state (%) - Black or African American
Geographical mobility - Moved from different state (%) - Asian
Geographical mobility - Moved from different state (%) - Hispanic or Latino
Geographical mobility - Moved from different state (%) - American Indian and Alaska Native
Geographical mobility - Moved from different state (%) - Multirace
Geographical mobility - Moved from different state (%) - Other Race
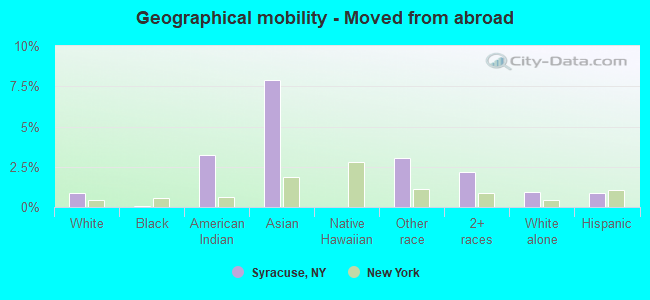
Geographical mobility - Moved from abroad (%)
Geographical mobility - Moved from abroad (%) - White
Geographical mobility - Moved from abroad (%) - Black or African American
Geographical mobility - Moved from abroad (%) - Asian
Geographical mobility - Moved from abroad (%) - Hispanic or Latino
Geographical mobility - Moved from abroad (%) - American Indian and Alaska Native
Geographical mobility - Moved from abroad (%) - Multirace
Geographical mobility - Moved from abroad (%) - Other Race
Place of birth for the foreign-born population - Ireland (%)
Place of birth for the foreign-born population - Denmark (%)
Place of birth for the foreign-born population - Norway (%)
Place of birth for the foreign-born population - Sweden (%)
Place of birth for the foreign-born population - United Kingdom (%)
Place of birth for the foreign-born population - England (%)
Place of birth for the foreign-born population - Scotland (%)
Place of birth for the foreign-born population - Other Northern Europe (%)
Place of birth for the foreign-born population - Austria (%)
Place of birth for the foreign-born population - Belgium (%)
Place of birth for the foreign-born population - France (%)
Place of birth for the foreign-born population - Germany (%)
Place of birth for the foreign-born population - Netherlands (%)
Place of birth for the foreign-born population - Switzerland (%)
Place of birth for the foreign-born population - Other Western Europe (%)
Place of birth for the foreign-born population - Greece (%)
Place of birth for the foreign-born population - Italy (%)
Place of birth for the foreign-born population - Portugal (%)
Place of birth for the foreign-born population - Spain (%)
Place of birth for the foreign-born population - Other Southern Europe (%)
Place of birth for the foreign-born population - Albania (%)
Place of birth for the foreign-born population - Belarus (%)
Place of birth for the foreign-born population - Bosnia and Herzegovina (%)
Place of birth for the foreign-born population - Bulgaria (%)
Place of birth for the foreign-born population - Croatia (%)
Place of birth for the foreign-born population - Czechoslovakia (%)
Place of birth for the foreign-born population - Hungary (%)
Place of birth for the foreign-born population - Latvia (%)
Place of birth for the foreign-born population - Lithuania (%)
Place of birth for the foreign-born population - North Macedonia (Macedonia) (%)
Place of birth for the foreign-born population - Moldova (%)
Place of birth for the foreign-born population - Poland (%)
Place of birth for the foreign-born population - Romania (%)
Place of birth for the foreign-born population - Russia (%)
Place of birth for the foreign-born population - Serbia (%)
Place of birth for the foreign-born population - Ukraine (%)
Place of birth for the foreign-born population - Other Eastern Europe (%)
Place of birth for the foreign-born population - China (%)
Place of birth for the foreign-born population - Hong Kong (%)
Place of birth for the foreign-born population - Taiwan (%)
Place of birth for the foreign-born population - Japan (%)
Place of birth for the foreign-born population - Korea (%)
Place of birth for the foreign-born population - Other Eastern Asia (%)
Place of birth for the foreign-born population - Afghanistan (%)
Place of birth for the foreign-born population - Bangladesh (%)
Place of birth for the foreign-born population - India (%)
Place of birth for the foreign-born population - Iran (%)
Place of birth for the foreign-born population - Kazakhstan (%)
Place of birth for the foreign-born population - Nepal (%)
Place of birth for the foreign-born population - Pakistan (%)
Place of birth for the foreign-born population - Sri Lanka (%)
Place of birth for the foreign-born population - Uzbekistan (%)
Place of birth for the foreign-born population - Other South Central Asia (%)
Place of birth for the foreign-born population - Burma (%)
Place of birth for the foreign-born population - Cambodia (%)
Place of birth for the foreign-born population - Indonesia (%)
Place of birth for the foreign-born population - Laos (%)
Place of birth for the foreign-born population - Malaysia (%)
Place of birth for the foreign-born population - Philippines (%)
Place of birth for the foreign-born population - Singapore (%)
Place of birth for the foreign-born population - Thailand (%)
Place of birth for the foreign-born population - Vietnam (%)
Place of birth for the foreign-born population - Other South Eastern Asia (%)
Place of birth for the foreign-born population - Armenia (%)
Place of birth for the foreign-born population - Iraq (%)
Place of birth for the foreign-born population - Israel (%)
Place of birth for the foreign-born population - Jordan (%)
Place of birth for the foreign-born population - Kuwait (%)
Place of birth for the foreign-born population - Lebanon (%)
Place of birth for the foreign-born population - Saudi Arabia (%)
Place of birth for the foreign-born population - Syria (%)
Place of birth for the foreign-born population - Turkey (%)
Place of birth for the foreign-born population - Yemen (%)
Place of birth for the foreign-born population - Other Western Asia (%)
Place of birth for the foreign-born population - Eritrea (%)
Place of birth for the foreign-born population - Ethiopia (%)
Place of birth for the foreign-born population - Kenya (%)
Place of birth for the foreign-born population - Somalia (%)
Place of birth for the foreign-born population - Uganda (%)
Place of birth for the foreign-born population - Zimbabwe (%)
Place of birth for the foreign-born population - Other Eastern Africa (%)
Place of birth for the foreign-born population - Cameroon (%)
Place of birth for the foreign-born population - Congo (%)
Place of birth for the foreign-born population - Democratic Republic of Congo (Zaire) (%)
Place of birth for the foreign-born population - Other Middle Africa (%)
Place of birth for the foreign-born population - Egypt (%)
Place of birth for the foreign-born population - Morocco (%)
Place of birth for the foreign-born population - Sudan (%)
Place of birth for the foreign-born population - Other Northern Africa (%)
Place of birth for the foreign-born population - South Africa (%)
Place of birth for the foreign-born population - Other Southern Africa (%)
Place of birth for the foreign-born population - Cabo Verde (%)
Place of birth for the foreign-born population - Ghana (%)
Place of birth for the foreign-born population - Liberia (%)
Place of birth for the foreign-born population - Nigeria (%)
Place of birth for the foreign-born population - Senegal (%)
Place of birth for the foreign-born population - Sierra Leone (%)
Place of birth for the foreign-born population - Other Western Africa (%)
Place of birth for the foreign-born population - Australia (%)
Place of birth for the foreign-born population - New Zealand (%)
Place of birth for the foreign-born population - Fiji (%)
Place of birth for the foreign-born population - Micronesia (%)
Place of birth for the foreign-born population - Bahamas (%)
Place of birth for the foreign-born population - Barbados (%)
Place of birth for the foreign-born population - Cuba (%)
Place of birth for the foreign-born population - Dominica (%)
Place of birth for the foreign-born population - Dominican Republic (%)
Place of birth for the foreign-born population - Grenada (%)
Place of birth for the foreign-born population - Haiti (%)
Place of birth for the foreign-born population - Jamaica (%)
Place of birth for the foreign-born population - St. Vincent and the Grenadines (%)
Place of birth for the foreign-born population - Trinidad and Tobago (%)
Place of birth for the foreign-born population - West Indies (%)
Place of birth for the foreign-born population - Other Caribbean (%)
Place of birth for the foreign-born population - Belize (%)
Place of birth for the foreign-born population - Costa Rica (%)
Place of birth for the foreign-born population - El Salvador (%)
Place of birth for the foreign-born population - Guatemala (%)
Place of birth for the foreign-born population - Honduras (%)
Place of birth for the foreign-born population - Mexico (%)
Place of birth for the foreign-born population - Nicaragua (%)
Place of birth for the foreign-born population - Panama (%)
Place of birth for the foreign-born population - Other Central America (%)
Place of birth for the foreign-born population - Argentina (%)
Place of birth for the foreign-born population - Bolivia (%)
Place of birth for the foreign-born population - Brazil (%)
Place of birth for the foreign-born population - Chile (%)
Place of birth for the foreign-born population - Colombia (%)
Place of birth for the foreign-born population - Ecuador (%)
Place of birth for the foreign-born population - Guyana (%)
Place of birth for the foreign-born population - Peru (%)
Place of birth for the foreign-born population - Uruguay (%)
Place of birth for the foreign-born population - Venezuela (%)
Place of birth for the foreign-born population - Other South America (%)
Place of birth for the foreign-born population - Canada (%)
Place of birth for the foreign-born population - Other Northern America (%)
Place of birth for the foreign-born population - Other (%)
Latest news about races in Syracuse, NY collected exclusively by city-data.com from local newspapers, TV, and radio stations
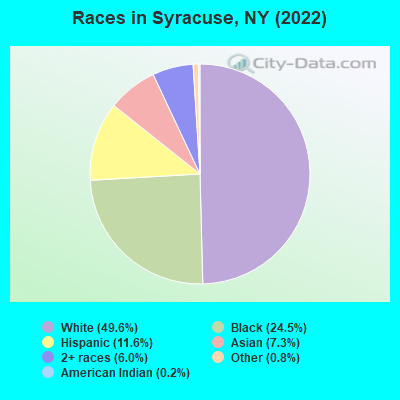
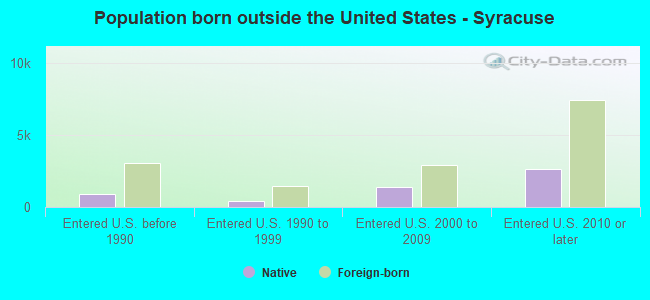
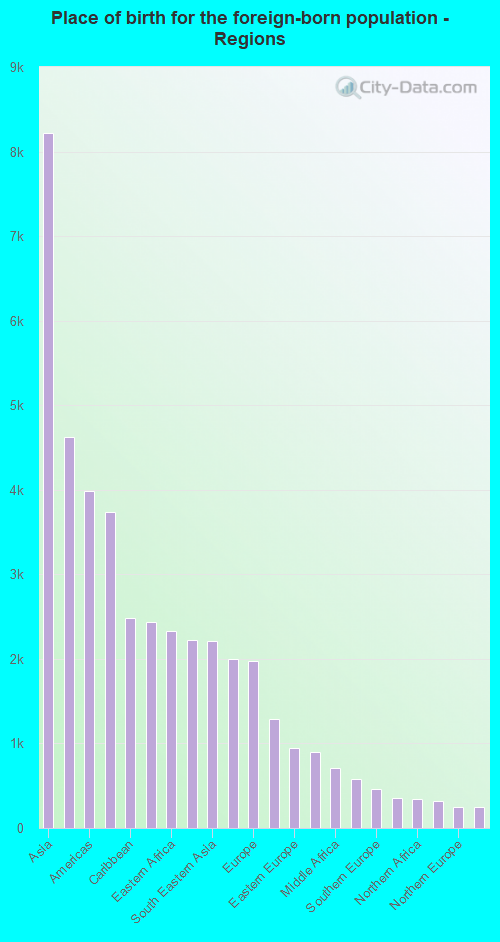
According to 2022 data, the most numerous races in Syracuse, NY are White alone (71,598 residents), Hispanic (16,758 residents), and Black alone (35,393 residents). 81.2% of Syracuse residents speak English at home. 13.0% of Syracuse, NY residents are foreign-born (5.7% born in Asia, 3.2% born in Africa, 2.6% born in Latin America, 1.4% born in Europe), which is 69.5% less than the foreign-born rate of 22.0% across the entire state of New York.
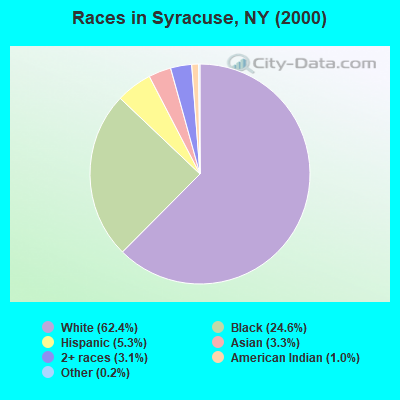
Race distribution in Syracuse
2000 2022
91,928 62.4% White alone 36,246 24.6% Black alone 7,768 5.3% Hispanic 4,929 3.3% Asian alone 4,493 3.1% Two or more races 1,538 1.0% American Indian alone 350 0.2% Other race alone 54 0.04% Native Hawaiian and Other
71,598 49.6% White alone 35,393 24.5% Black alone 16,758 11.6% Hispanic 10,525 7.3% Asian alone 8,621 6.0% Two or more races 1,203 0.8% Other race alone 361 0.2% American Indian alone
2000 2022
11,760,981 62.0% White alone 2,867,583 15.1% Hispanic 2,812,623 14.8% Black alone 1,035,926 5.5% Asian alone 366,116 1.9% Two or more races 75,499 0.4% Other race alone 52,499 0.3% American Indian alone 5,230 0.03% Native Hawaiian and Other
10,408,933 52.9% White alone 3,867,299 19.7% Hispanic 2,633,840 13.4% Black alone 1,776,286 9.0% Asian alone 732,670 3.7% Two or more races 216,110 1.1% Other race alone 35,082 0.2% American Indian alone 6,931 0.04% Native Hawaiian and Other
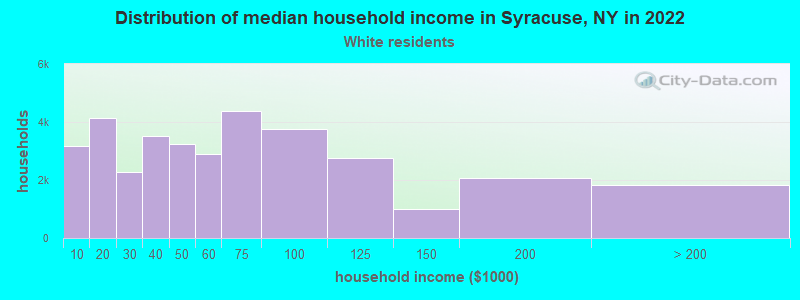
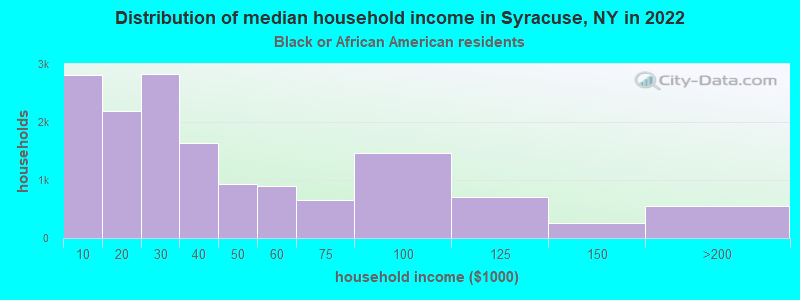
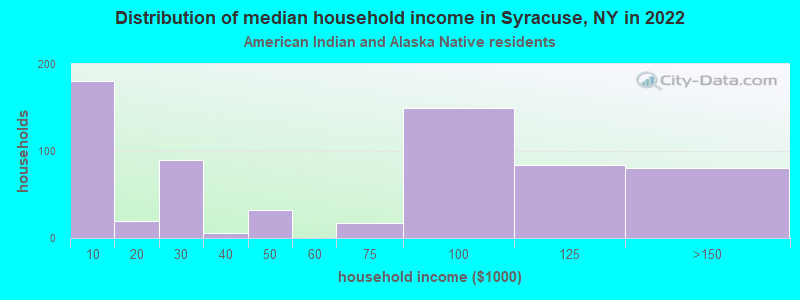
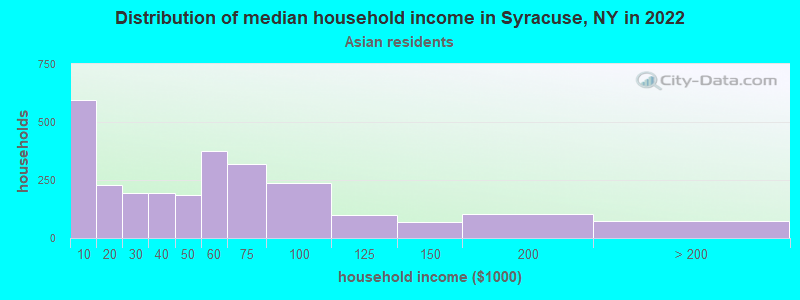
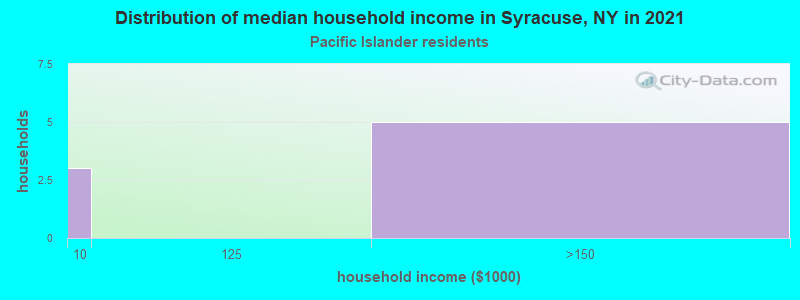
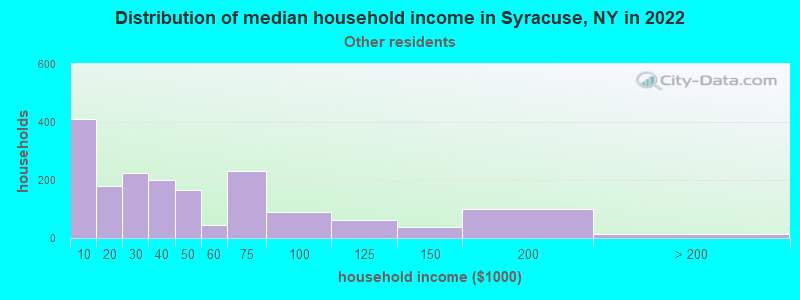
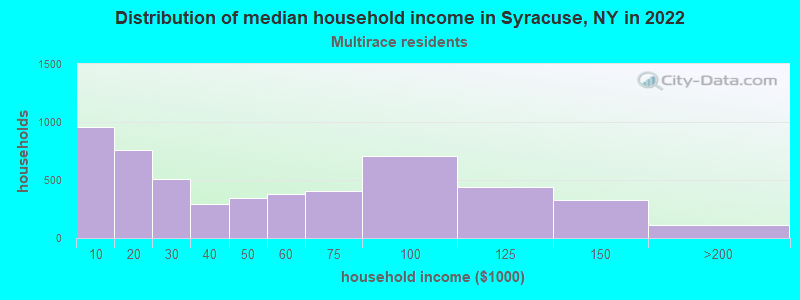
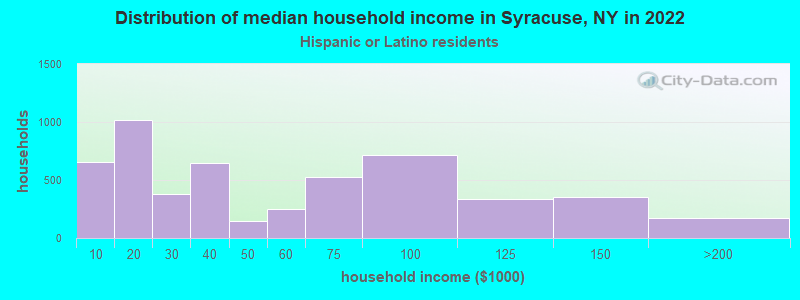
Income and house value in Syracuse Median household income in 2022 $53,480 White non-Hispanic householders$27,307 Black householders$91,780 American Indian and Alaska Native householders$42,486 Asian householders$42,196 Some other race householders$40,972 Two or more races householders$36,638 Hispanic or Latino race householdersMedian 2022 house value $139,297 White Non-Hispanic householders$122,909 Black or African American householders$108,320 American Indian or Alaska Native householders $137,298 Asian householders$130,503 Some other race householders$123,708 Two or more races householders$128,305 Hispanic or Latino householders
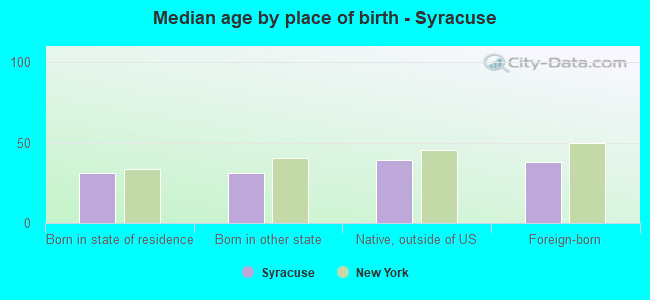
Median age by race in Syracuse
38.2 Median age for White residents39.6 37.0 29.0 Median age for Black or African American residents28.7 29.5 38.6 Median age for American Indian / Alaska Native residents44.5 27.2 22.4 Median age for Asian residents20.9 25.1 -666,666,666.0 Median age for Native Hawaiian / Pacific Islander residents-666,666,666.0 -666,666,666.0 33.0 Median age for Other race residents32.0 33.3 23.7 Median age for Two or more races residents22.7 26.6 38.7 Median age for White alone residents40.2 37.4 24.1 Median age for Hispanic or Latino residents22.2 28.1
Owner/renter occupied households by race in Syracuse
House owners and renters - White residents 18,276 52.2% Owner occupied16,767 47.8% Renter occupiedHouse owners and renters - Black or African American residents 4,472 29.9% Owner occupied10,471 70.1% Renter occupiedHouse owners and renters - American Indian / Alaska Native residents 136 34.1% Owner occupied263 65.9% Renter occupiedHouse owners and renters - Asian residents 762 27.9% Owner occupied1,967 72.1% Renter occupiedHouse owners and renters - Native Hawaiian / Pacific Islander residents 8 100.0% Renter occupiedHouse owners and renters - Other race residents 528 28.6% Owner occupied1,318 71.4% Renter occupiedHouse owners and renters - Two or more races residents 1,820 34.7% Owner occupied3,421 65.3% Renter occupiedHouse owners and renters - White alone residents 18,176 52.5% Owner occupied16,467 47.5% Renter occupiedHouse owners and renters - Hispanic or Latino residents 1,429 27.4% Owner occupied3,778 72.6% Renter occupied
Language usage in Syracuse
English speakers - Total 81.2% of residents of Syracuse speak English at home.
6.9% of residents speak Spanish at home 6,685 71.3% Speak English very well2,687 28.7% Speak English less than very well11.9% of residents speak other language at home 10,110 62.8% Speak English very well6,000 37.2% Speak English less than very well
English speakers - Born in the United States 89.8% of residents of Syracuse speak English at home.
2.6% of residents speak Spanish at home 602 82.0% Speak English very well132 18.0% Speak English less than very well7.6% of residents speak other language at home 1,395 65.3% Speak English very well740 34.7% Speak English less than very well
English speakers - Native, born elsewhere 35.4% of residents of Syracuse speak English at home.
51.6% of residents speak Spanish at home 1,580 62.7% Speak English very well940 37.3% Speak English less than very well13.0% of residents speak other language at home 635 100.0% Speak English very well
English speakers - Foreign-born 19.3% of residents of Syracuse speak English at home.
12.6% of residents speak Spanish at home 680 36.2% Speak English very well1,199 63.8% Speak English less than very well68.2% of residents speak other language at home 5,647 55.4% Speak English very well4,550 44.6% Speak English less than very well
White (Caucasian) - Speak only English Native:
97.2% (66,330)Foreign-born:
24.2% (728)
White (Caucasian) - Speak another language Native:
2.8% (1,891)Foreign-born:
75.8% (2,275)
Black or African American - Speak only English Native:
94.3% (29,470)Foreign-born:
27.0% (974)
Black or African American - Speak another language Native:
5.7% (1,777)Foreign-born:
73.0% (2,637)
American Indian / Alaska Native - Speak only English Native:
73.5% (825)Foreign-born:
22.6% (30)
American Indian / Alaska Native - Speak another language Native:
21.4% (240)Foreign-born:
69.3% (91)
Asian - Speak only English Native:
26.0% (1,232)Foreign-born:
12.7% (699)
Asian - Speak another language Native:
74.0% (3,509)Foreign-born:
87.3% (4,816)
Other race - Speak only English Native:
41.7% (1,260)Foreign-born:
20.3% (322)
Other race - Speak another language Native:
58.3% (1,760)Foreign-born:
79.7% (1,266)
Two or more races - Speak only English Native:
67.6% (8,717)Foreign-born:
13.0% (161)
Two or more races - Speak another language Native:
32.4% (4,171)Foreign-born:
87.0% (1,082)
White alone - Speak only English Native:
97.6% (64,804)Foreign-born:
25.3% (728)
White alone - Speak another language Native:
2.4% (1,567)Foreign-born:
74.7% (2,144)
Hispanic or Latino - Speak only English Native:
53.4% (6,989)Foreign-born:
12.2% (279)
Hispanic or Latino - Speak another language Native:
46.6% (6,110)Foreign-born:
87.8% (2,010)
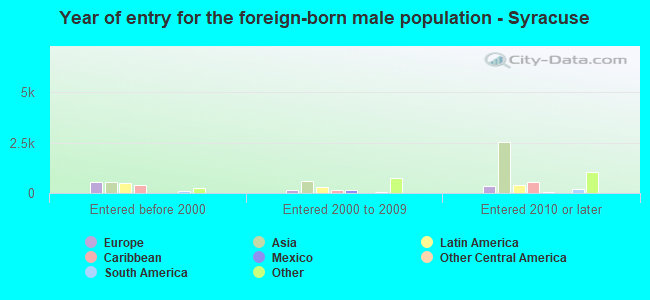
Foreign-born residents in Syracuse 18,794 residents are foreign born (5.7% Asia , 3.2% Africa , 2.6% Latin America , 1.4% Europe ).
This city:
13.0%New York:
22.6%
Marital status for residents in Syracuse Marital status - White (Caucasian) population 15 years and over
Males 50.4% Never married31.9% Now married3.4% Separated3.1% Widowed11.3% DivorcedFemales 51.6% Never married27.4% Now married1.1% Separated6.6% Widowed13.2% DivorcedWomen who gave birth in the past 12 months Now married:
93.5% (899)Unmarried:
6.5% (62)
Women who did not give birth in the past 12 months Now married:
18.8% (3,676)Unmarried:
81.2% (15,870)
Marital status - Black or African American population 15 years and over
Males 64.1% Never married22.9% Now married6.9% Separated1.9% Widowed4.2% DivorcedFemales 62.5% Never married22.3% Now married0.4% Separated4.9% Widowed9.9% DivorcedWomen who gave birth in the past 12 months Now married:
31.2% (249)Unmarried:
68.8% (549)
Women who did not give birth in the past 12 months Now married:
14.0% (1,197)Unmarried:
86.0% (7,331)
Marital status - American Indian / Alaska Native population 15 years and over
Males 57.7% Never married19.9% Now married5.6% Separated0.0% Widowed16.8% DivorcedFemales 62.9% Never married20.3% Now married1.6% Separated11.8% Widowed3.4% DivorcedWomen who gave birth in the past 12 months Now married:
100.0% (26)Unmarried:
0.0% (0)
Women who did not give birth in the past 12 months Now married:
17.1% (67)Unmarried:
82.9% (326)
Marital status - Asian population 15 years and over
Males 73.2% Never married20.7% Now married0.0% Separated6.0% Widowed0.0% DivorcedFemales 62.8% Never married30.0% Now married0.0% Separated1.1% Widowed6.0% DivorcedWomen who gave birth in the past 12 months Now married:
100.0% (315)Unmarried:
0.0% (0)
Women who did not give birth in the past 12 months Now married:
22.5% (819)Unmarried:
77.5% (2,826)
Marital status - Native Hawaiian / Pacific Islander population 15 years and over
Males 100.0% Never married0.0% Now married0.0% Separated0.0% Widowed0.0% DivorcedFemales 100.0% Never married0.0% Now married0.0% Separated0.0% Widowed0.0% DivorcedWomen who did not give birth in the past 12 months Now married:
0.0% (0)Unmarried:
100.0% (13)
Marital status - Other race population 15 years and over
Males 62.8% Never married18.2% Now married1.9% Separated5.2% Widowed11.9% DivorcedFemales 63.0% Never married16.2% Now married9.3% Separated1.2% Widowed10.2% DivorcedWomen who gave birth in the past 12 months Now married:
77.8% (15)Unmarried:
22.2% (4)
Women who did not give birth in the past 12 months Now married:
24.9% (360)Unmarried:
75.1% (1,083)
Marital status - Two or more races population 15 years and over
Males 76.2% Never married19.0% Now married0.1% Separated1.7% Widowed3.0% DivorcedFemales 48.2% Never married20.1% Now married10.4% Separated4.1% Widowed17.2% DivorcedWomen who gave birth in the past 12 months Now married:
100.0% (287)Unmarried:
0.0% (0)
Women who did not give birth in the past 12 months Now married:
24.5% (871)Unmarried:
75.5% (2,679)
Marital status - White alone, not Hispanic / Latino population 15 years and over
Males 49.9% Never married32.6% Now married3.4% Separated2.8% Widowed11.4% DivorcedFemales 50.6% Never married28.1% Now married1.2% Separated6.8% Widowed13.3% DivorcedWomen who gave birth in the past 12 months Now married:
93.5% (899)Unmarried:
6.5% (62)
Women who did not give birth in the past 12 months Now married:
19.7% (3,649)Unmarried:
80.3% (14,911)
Marital status - Hispanic or Latino population 15 years and over
Males 67.3% Never married19.5% Now married2.4% Separated4.7% Widowed6.1% DivorcedFemales 69.2% Never married11.2% Now married4.8% Separated1.4% Widowed13.5% DivorcedWomen who gave birth in the past 12 months Now married:
26.9% (32)Unmarried:
73.1% (88)
Women who did not give birth in the past 12 months Now married:
18.6% (808)Unmarried:
81.4% (3,534)
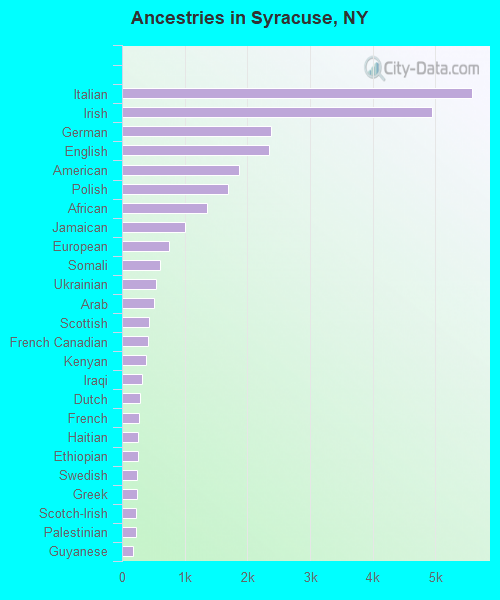
Ancestries in Syracuse
5,575 8.0% Italian4,951 7.1% Irish2,379 3.4% German2,341 3.4% English1,870 2.7% American1,697 2.4% Polish1,361 2.0% African1,004 1.4% Jamaican742 1.1% European607 0.9% Somali543 0.8% Ukrainian516 0.7% Arab438 0.6% Scottish412 0.6% French Canadian385 0.6% Kenyan312 0.4% Iraqi288 0.4% Dutch268 0.4% French261 0.4% Haitian253 0.4% Ethiopian243 0.4% Swedish235 0.3% Greek221 0.3% Scotch-Irish217 0.3% Palestinian183 0.3% Guyanese179 0.3% Ghanaian173 0.2% Afghan170 0.2% Russian159 0.2% Syrian151 0.2% Northern European149 0.2% Norwegian146 0.2% Sudanese132 0.2% Eastern European126 0.2% British120 0.2% Egyptian113 0.2% Iranian105 0.2% Yugoslavian105 0.2% Nigerian101 0.1% Turkish100 0.1% Hungarian93 0.1% Trinidadian and Tobagonian84 0.1% Brazilian82 0.1% British West Indian80 0.1% Canadian77 0.1% West Indian61 0.09% Liberian60 0.09% Austrian59 0.09% South African57 0.08% Scandinavian57 0.08% Zimbabwean56 0.08% Slavic49 0.07% Welsh47 0.07% Barbadian46 0.07% Danish44 0.06% Lithuanian41 0.06% Finnish38 0.05% Swiss36 0.05% Portuguese35 0.05% Slovak31 0.04% Macedonian22 0.03% Armenian21 0.03% Czech19 0.03% Pennsylvania German16 0.02% Lebanese15 0.02% Croatian12 0.02% Slovene12 0.02% Albanian11 0.02% Bulgarian11 0.02% Bahamian10 0.01% Israeli8 0.01% Serbian6 0.01% Czechoslovakian6 0.01% Basque
Geographical mobility in Syracuse Same house 1 year ago 54,947 75.3% White (Caucasian)30,342 81.1% Black or African American789 76.8% American Indian / Alaska Native5,713 55.2% Asian28 84.3% Native Hawaiian / Pacific Islander3,140 65.1% Other race13,991 86.4% Two or more races53,529 75.4% White alone, not Hispanic / Latino12,843 77.4% Hispanic or LatinoMoved within same county 8,774 12.0% White / Caucasian6,111 16.3% Black or African American159 15.5% American Indian / Alaska Native1,644 15.9% Asian579 12.0% Other race1,225 7.6% Two or more races8,349 11.8% White alone, not Hispanic / Latino1,933 11.7% Hispanic or LatinoMoved within same state 3,061 4.2% White / Caucasian525 1.4% Black or African American104 10.1% American Indian / Alaska Native603 5.8% Asian203 4.2% Other race371 2.3% Two or more races2,955 4.2% White alone, not Hispanic / Latino819 4.9% Hispanic or LatinoMoved from different state 5,569 7.6% White / Caucasian385 1.0% Black or African American1,579 15.3% Asian2 6.4% Native Hawaiian / Pacific Islander755 15.6% Other race255 1.6% Two or more races5,537 7.8% White alone, not Hispanic / Latino845 5.1% Hispanic or LatinoMoved from abroad 652 0.9% White33 0.1% Black or African American33 3.2% American Indian / Alaska Native814 7.9% Asian148 3.1% Other race349 2.2% Two or more races652 0.9% White alone, not Hispanic / Latino148 0.9% Hispanic or Latino
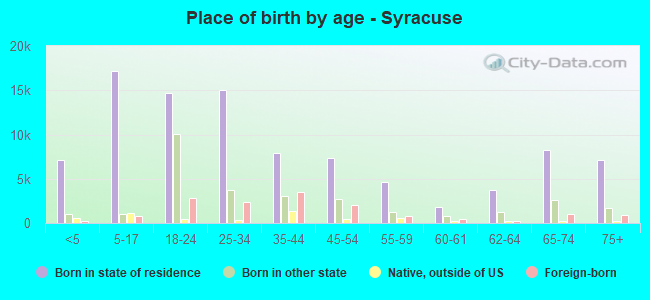
Children Nativity (place of birth) in Syracuse
Children under 6 years - Living with two parents Both parents native 3,058 100.0% NativeBoth parents foreign-born 1,262 100.0% NativeOne native, one foreign-born parent 664 100.0% NativeChildren under 6 years - Living with one parent Native parent 3,833 100.0% NativeForeign-born parent 845 100.0% NativeChildren 6 to 17 years - Living with two parents Both parents native 4,327 100.0% NativeBoth parents foreign-born 1,358 78.6% Native370 21.4% Foreign-bornOne native, one foreign-born parent 399 100.0% NativeChildren 6 to 17 years - Living with one parent Native parent 9,244 100.0% NativeForeign-born parent 1,353 60.2% Native896 39.8% Foreign-born
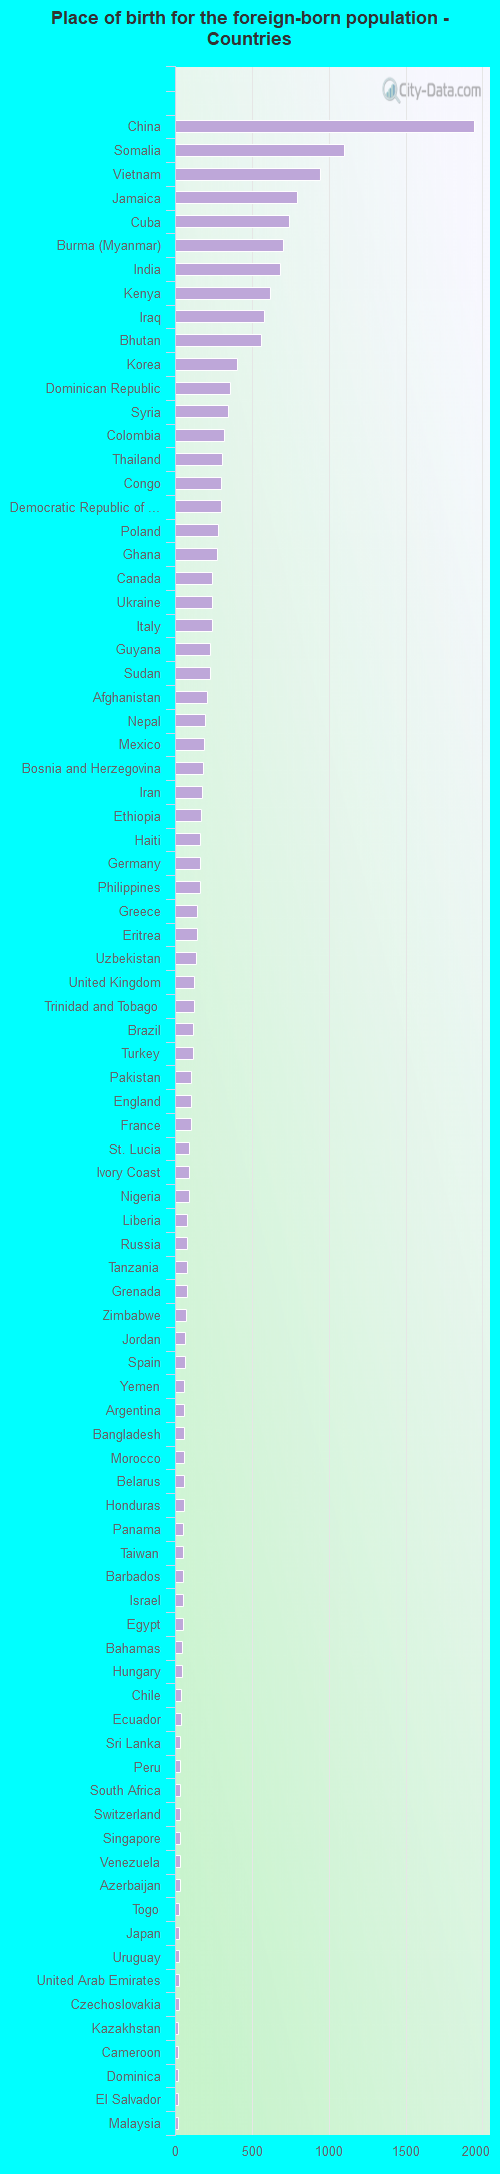
Place of birth for residents in Syracuse 8,218 Asia4,624 Africa3,981 Americas3,737 Latin America2,483 Caribbean2,433 Eastern Asia2,331 Eastern Africa2,220 South Central Asia2,213 South Eastern Asia2,002 China1,970 Europe1,287 Western Asia945 Eastern Europe904 South America713 Middle Africa575 Western Africa456 Southern Europe350 Central America346 Northern Africa314 Western Europe253 Northern Europe243 Northern America34 Southern Africa1,946 China1,102 Somalia942 Vietnam797 Jamaica742 Cuba706 Burma (Myanmar)684 India617 Kenya576 Iraq561 Bhutan402 Korea357 Dominican Republic342 Syria317 Colombia308 Thailand301 Congo299 Democratic Republic of Congo (Zaire)280 Poland273 Ghana243 Canada241 Ukraine239 Italy231 Guyana227 Sudan207 Afghanistan198 Nepal191 Mexico182 Bosnia and Herzegovina177 Iran171 Ethiopia164 Haiti162 Germany160 Philippines145 Greece144 Eritrea135 Uzbekistan123 United Kingdom122 Trinidad and Tobago120 Brazil118 Turkey107 Pakistan103 England101 France90 St. Lucia89 Ivory Coast88 Nigeria81 Liberia79 Russia77 Tanzania77 Grenada70 Zimbabwe65 Jordan63 Spain61 Yemen59 Argentina57 Bangladesh57 Morocco56 Belarus56 Honduras53 Panama52 Taiwan52 Barbados50 Israel50 Egypt46 Bahamas43 Hungary40 Chile39 Ecuador35 Sri Lanka35 Peru34 South Africa34 Switzerland34 Singapore33 Venezuela31 Azerbaijan27 Togo27 Japan25 Uruguay24 United Arab Emirates23 Czechoslovakia21 Kazakhstan19 Cameroon19 Dominica19 El Salvador18 Malaysia16 Guatemala15 Indonesia14 Cambodia13 Albania11 Laos11 Nicaragua11 Netherlands10 Algeria8 Moldova8 Bulgaria8 Portugal8 Kuwait7 Armenia6 Ireland4 Scotland3 Hong Kong3 Austria
Grandparents responsible for own grandchildren in Syracuse
Grandparents (30 to 59 years) White / Caucasian 921 85.5% Responsible for grandchildren156 14.5% Not responsible for grandchildrenBlack or African American 185 61.2% Responsible for grandchildren117 38.8% Not responsible for grandchildrenAmerican Indian / Alaska Native 29 100.0% Responsible for grandchildrenAsian 7 8.6% Responsible for grandchildren73 91.4% Not responsible for grandchildrenOther race 24 36.5% Responsible for grandchildren41 63.5% Not responsible for grandchildrenTwo or more races 27 100.0% Responsible for grandchildrenWhite alone, not Hispanic / Latino 921 85.5% Responsible for grandchildren156 14.5% Not responsible for grandchildrenHispanic or Latino 34 33.1% Responsible for grandchildren68 66.9% Not responsible for grandchildrenGrandparents (60 years and over) White / Caucasian 67 13.2% Responsible for grandchildren441 86.8% Not responsible for grandchildrenBlack or African American 140 47.1% Responsible for grandchildren157 52.9% Not responsible for grandchildrenAmerican Indian / Alaska Native 13 100.0% Responsible for grandchildrenAsian 66 100.0% Not responsible for grandchildrenOther race 8 100.0% Responsible for grandchildrenTwo or more races 80 96.4% Responsible for grandchildren3 3.6% Not responsible for grandchildrenWhite alone, not Hispanic / Latino 67 13.2% Responsible for grandchildren441 86.8% Not responsible for grandchildrenHispanic or Latino 64 85.3% Responsible for grandchildren11 14.7% Not responsible for grandchildren