Races in Swampscott, Massachusetts (MA) Detailed Stats
Data:
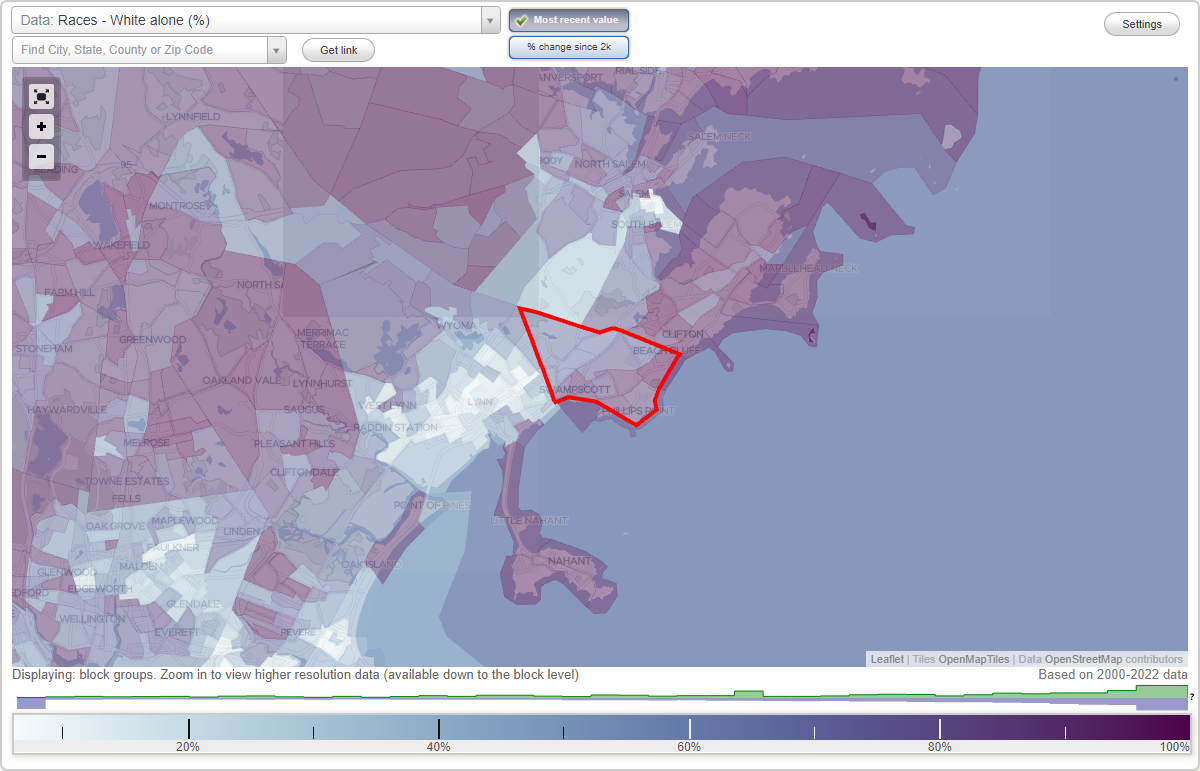
Races - White alone (%)
Races - White alone (% change since 2000)
Races - Black alone (%)
Races - Black alone (% change since 2000)
Races - American Indian alone (%)
Races - American Indian alone (% change since 2000)
Races - Asian alone (%)
Races - Asian alone (% change since 2000)
Races - Hispanic (%)
Races - Hispanic (% change since 2000)
Races - Native Hawaiian and Other Pacific Islander alone (%)
Races - Native Hawaiian and Other Pacific Islander alone (% change since 2000)
Races - Two or more races(%)
Races - Two or more races(% change since 2000)
Races - Other race alone (%)
Races - Other race alone (% change since 2000)
Racial diversity
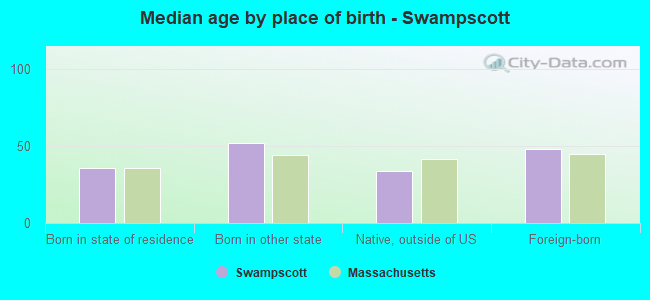
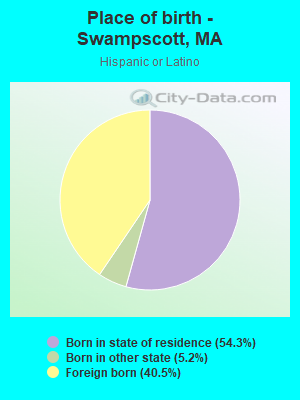
Place of birth - Born in state of residence (%)
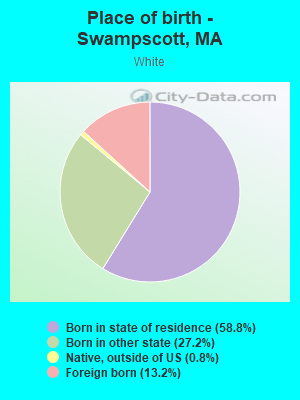
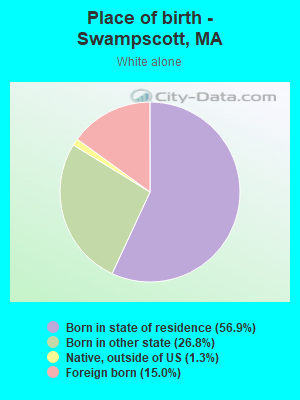
Place of birth - Born in state of residence (%) - White
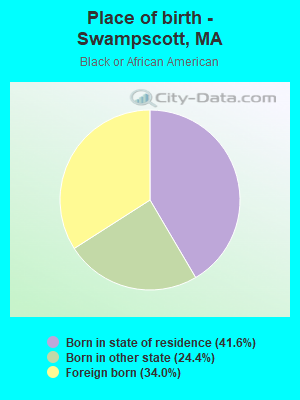
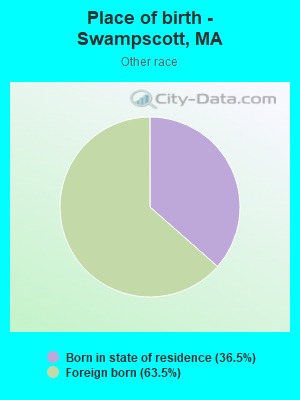
Place of birth - Born in state of residence (%) - Black or African American
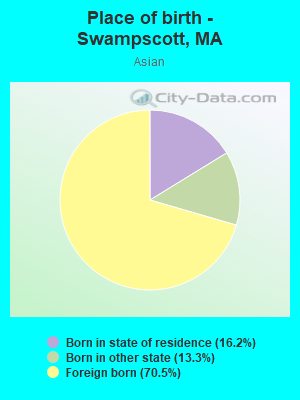
Place of birth - Born in state of residence (%) - Asian
Place of birth - Born in state of residence (%) - Hispanic or Latino
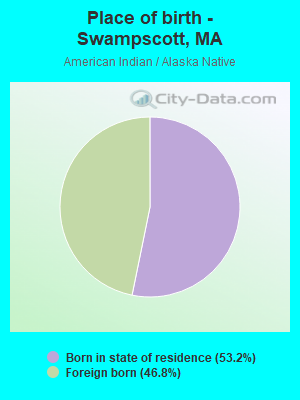
Place of birth - Born in state of residence (%) - American Indian and Alaska Native
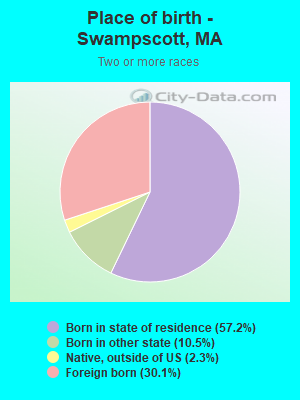
Place of birth - Born in state of residence (%) - Multirace
Place of birth - Born in state of residence (%) - Other Race
Place of birth - Born in other state (%)
Place of birth - Born in other state (%) - White
Place of birth - Born in other state (%) - Black or African American
Place of birth - Born in other state (%) - Asian
Place of birth - Born in other state (%) - Hispanic or Latino
Place of birth - Born in other state (%) - American Indian and Alaska Native
Place of birth - Born in other state (%) - Multirace
Place of birth - Born in other state (%) - Other Race
Place of birth - Native, outside of US (%)
Place of birth - Native, outside of US (%) - White
Place of birth - Native, outside of US (%) - Black or African American
Place of birth - Native, outside of US (%) - Asian
Place of birth - Native, outside of US (%) - Hispanic or Latino
Place of birth - Native, outside of US (%) - American Indian and Alaska Native
Place of birth - Native, outside of US (%) - Multirace
Place of birth - Native, outside of US (%) - Other Race
Place of birth - Foreign born (%)
Place of birth - Foreign born (%) - White
Place of birth - Foreign born (%) - Black or African American
Place of birth - Foreign born (%) - Asian
Place of birth - Foreign born (%) - Hispanic or Latino
Place of birth - Foreign born (%) - American Indian and Alaska Native
Place of birth - Foreign born (%) - Multirace
Place of birth - Foreign born (%) - Other Race
Residents speaking English at home (%)
Residents speaking English at home - Born in the United States (%)
Residents speaking English at home - Native, born elsewhere (%)
Residents speaking English at home - Foreign born (%)
Residents speaking Spanish at home (%)
Residents speaking Spanish at home - Born in the United States (%)
Residents speaking Spanish at home - Native, born elsewhere (%)
Residents speaking Spanish at home - Foreign born (%)
Residents speaking other language at home (%)
Residents speaking other language at home - Born in the United States (%)
Residents speaking other language at home - Native, born elsewhere (%)
Residents speaking other language at home - Foreign born (%)
Marital status - Never married (%)
Marital status - Now married (%)
Marital status - Separated (%)
Marital status - Widowed (%)
Marital status - Divorced (%)
Ancestries Reported - Arab (%)
Ancestries Reported - Czech (%)
Ancestries Reported - Danish (%)
Ancestries Reported - Dutch (%)
Ancestries Reported - English (%)
Ancestries Reported - French (%)
Ancestries Reported - French Canadian (%)
Ancestries Reported - German (%)
Ancestries Reported - Greek (%)
Ancestries Reported - Hungarian (%)
Ancestries Reported - Irish (%)
Ancestries Reported - Italian (%)
Ancestries Reported - Lithuanian (%)
Ancestries Reported - Norwegian (%)
Ancestries Reported - Polish (%)
Ancestries Reported - Portuguese (%)
Ancestries Reported - Russian (%)
Ancestries Reported - Scotch-Irish (%)
Ancestries Reported - Scottish (%)
Ancestries Reported - Slovak (%)
Ancestries Reported - Subsaharan African (%)
Ancestries Reported - Swedish (%)
Ancestries Reported - Swiss (%)
Ancestries Reported - Ukrainian (%)
Ancestries Reported - United States (%)
Ancestries Reported - Welsh (%)
Ancestries Reported - West Indian (%)
Ancestries Reported - Other (%)
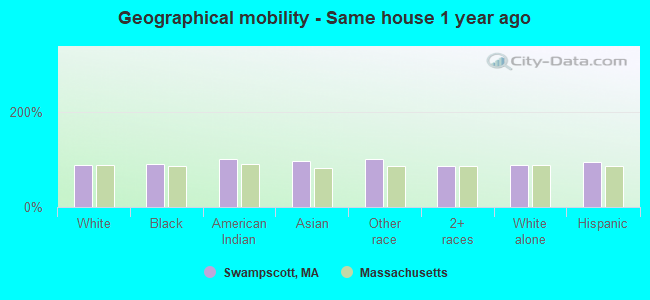
Geographical mobility - Same house 1 year ago (%)
Geographical mobility - Same house 1 year ago (%) - White
Geographical mobility - Same house 1 year ago (%) - Black or African American
Geographical mobility - Same house 1 year ago (%) - Asian
Geographical mobility - Same house 1 year ago (%) - Hispanic or Latino
Geographical mobility - Same house 1 year ago (%) - American Indian and Alaska Native
Geographical mobility - Same house 1 year ago (%) - Multirace
Geographical mobility - Same house 1 year ago (%) - Other Race
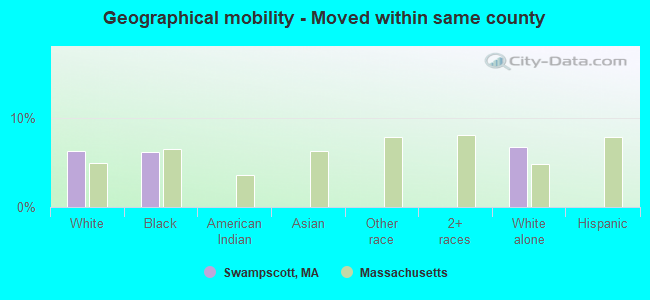
Geographical mobility - Moved within same county (%)
Geographical mobility - Moved within same county (%) - White
Geographical mobility - Moved within same county (%) - Black or African American
Geographical mobility - Moved within same county (%) - Asian
Geographical mobility - Moved within same county (%) - Hispanic or Latino
Geographical mobility - Moved within same county (%) - American Indian and Alaska Native
Geographical mobility - Moved within same county (%) - Multirace
Geographical mobility - Moved within same county (%) - Other Race
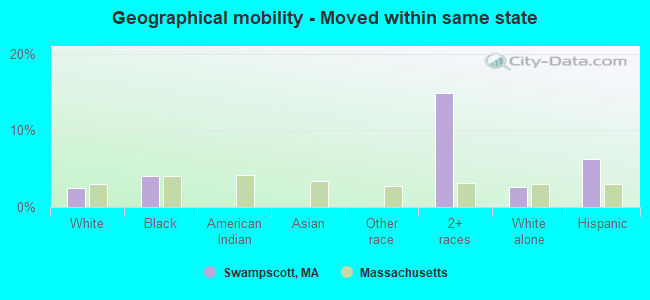
Geographical mobility - Moved from different county within same state (%)
Geographical mobility - Moved from different county within same state (%) - White
Geographical mobility - Moved from different county within same state (%) - Black or African American
Geographical mobility - Moved from different county within same state (%) - Asian
Geographical mobility - Moved from different county within same state (%) - Hispanic or Latino
Geographical mobility - Moved from different county within same state (%) - American Indian and Alaska Native
Geographical mobility - Moved from different county within same state (%) - Multirace
Geographical mobility - Moved from different county within same state (%) - Other Race
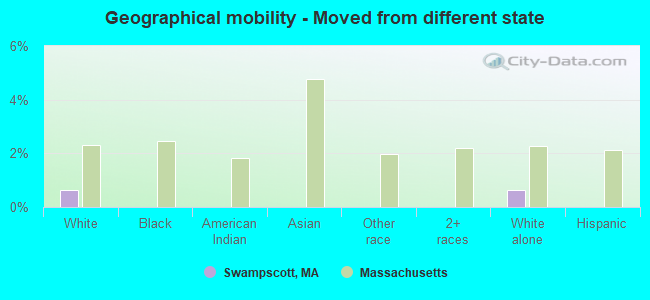
Geographical mobility - Moved from different state (%)
Geographical mobility - Moved from different state (%) - White
Geographical mobility - Moved from different state (%) - Black or African American
Geographical mobility - Moved from different state (%) - Asian
Geographical mobility - Moved from different state (%) - Hispanic or Latino
Geographical mobility - Moved from different state (%) - American Indian and Alaska Native
Geographical mobility - Moved from different state (%) - Multirace
Geographical mobility - Moved from different state (%) - Other Race
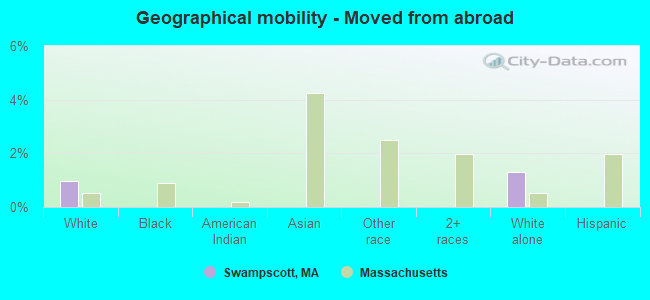
Geographical mobility - Moved from abroad (%)
Geographical mobility - Moved from abroad (%) - White
Geographical mobility - Moved from abroad (%) - Black or African American
Geographical mobility - Moved from abroad (%) - Asian
Geographical mobility - Moved from abroad (%) - Hispanic or Latino
Geographical mobility - Moved from abroad (%) - American Indian and Alaska Native
Geographical mobility - Moved from abroad (%) - Multirace
Geographical mobility - Moved from abroad (%) - Other Race
Place of birth for the foreign-born population - Ireland (%)
Place of birth for the foreign-born population - Denmark (%)
Place of birth for the foreign-born population - Norway (%)
Place of birth for the foreign-born population - Sweden (%)
Place of birth for the foreign-born population - United Kingdom (%)
Place of birth for the foreign-born population - England (%)
Place of birth for the foreign-born population - Scotland (%)
Place of birth for the foreign-born population - Other Northern Europe (%)
Place of birth for the foreign-born population - Austria (%)
Place of birth for the foreign-born population - Belgium (%)
Place of birth for the foreign-born population - France (%)
Place of birth for the foreign-born population - Germany (%)
Place of birth for the foreign-born population - Netherlands (%)
Place of birth for the foreign-born population - Switzerland (%)
Place of birth for the foreign-born population - Other Western Europe (%)
Place of birth for the foreign-born population - Greece (%)
Place of birth for the foreign-born population - Italy (%)
Place of birth for the foreign-born population - Portugal (%)
Place of birth for the foreign-born population - Spain (%)
Place of birth for the foreign-born population - Other Southern Europe (%)
Place of birth for the foreign-born population - Albania (%)
Place of birth for the foreign-born population - Belarus (%)
Place of birth for the foreign-born population - Bosnia and Herzegovina (%)
Place of birth for the foreign-born population - Bulgaria (%)
Place of birth for the foreign-born population - Croatia (%)
Place of birth for the foreign-born population - Czechoslovakia (%)
Place of birth for the foreign-born population - Hungary (%)
Place of birth for the foreign-born population - Latvia (%)
Place of birth for the foreign-born population - Lithuania (%)
Place of birth for the foreign-born population - North Macedonia (Macedonia) (%)
Place of birth for the foreign-born population - Moldova (%)
Place of birth for the foreign-born population - Poland (%)
Place of birth for the foreign-born population - Romania (%)
Place of birth for the foreign-born population - Russia (%)
Place of birth for the foreign-born population - Serbia (%)
Place of birth for the foreign-born population - Ukraine (%)
Place of birth for the foreign-born population - Other Eastern Europe (%)
Place of birth for the foreign-born population - China (%)
Place of birth for the foreign-born population - Hong Kong (%)
Place of birth for the foreign-born population - Taiwan (%)
Place of birth for the foreign-born population - Japan (%)
Place of birth for the foreign-born population - Korea (%)
Place of birth for the foreign-born population - Other Eastern Asia (%)
Place of birth for the foreign-born population - Afghanistan (%)
Place of birth for the foreign-born population - Bangladesh (%)
Place of birth for the foreign-born population - India (%)
Place of birth for the foreign-born population - Iran (%)
Place of birth for the foreign-born population - Kazakhstan (%)
Place of birth for the foreign-born population - Nepal (%)
Place of birth for the foreign-born population - Pakistan (%)
Place of birth for the foreign-born population - Sri Lanka (%)
Place of birth for the foreign-born population - Uzbekistan (%)
Place of birth for the foreign-born population - Other South Central Asia (%)
Place of birth for the foreign-born population - Burma (%)
Place of birth for the foreign-born population - Cambodia (%)
Place of birth for the foreign-born population - Indonesia (%)
Place of birth for the foreign-born population - Laos (%)
Place of birth for the foreign-born population - Malaysia (%)
Place of birth for the foreign-born population - Philippines (%)
Place of birth for the foreign-born population - Singapore (%)
Place of birth for the foreign-born population - Thailand (%)
Place of birth for the foreign-born population - Vietnam (%)
Place of birth for the foreign-born population - Other South Eastern Asia (%)
Place of birth for the foreign-born population - Armenia (%)
Place of birth for the foreign-born population - Iraq (%)
Place of birth for the foreign-born population - Israel (%)
Place of birth for the foreign-born population - Jordan (%)
Place of birth for the foreign-born population - Kuwait (%)
Place of birth for the foreign-born population - Lebanon (%)
Place of birth for the foreign-born population - Saudi Arabia (%)
Place of birth for the foreign-born population - Syria (%)
Place of birth for the foreign-born population - Turkey (%)
Place of birth for the foreign-born population - Yemen (%)
Place of birth for the foreign-born population - Other Western Asia (%)
Place of birth for the foreign-born population - Eritrea (%)
Place of birth for the foreign-born population - Ethiopia (%)
Place of birth for the foreign-born population - Kenya (%)
Place of birth for the foreign-born population - Somalia (%)
Place of birth for the foreign-born population - Uganda (%)
Place of birth for the foreign-born population - Zimbabwe (%)
Place of birth for the foreign-born population - Other Eastern Africa (%)
Place of birth for the foreign-born population - Cameroon (%)
Place of birth for the foreign-born population - Congo (%)
Place of birth for the foreign-born population - Democratic Republic of Congo (Zaire) (%)
Place of birth for the foreign-born population - Other Middle Africa (%)
Place of birth for the foreign-born population - Egypt (%)
Place of birth for the foreign-born population - Morocco (%)
Place of birth for the foreign-born population - Sudan (%)
Place of birth for the foreign-born population - Other Northern Africa (%)
Place of birth for the foreign-born population - South Africa (%)
Place of birth for the foreign-born population - Other Southern Africa (%)
Place of birth for the foreign-born population - Cabo Verde (%)
Place of birth for the foreign-born population - Ghana (%)
Place of birth for the foreign-born population - Liberia (%)
Place of birth for the foreign-born population - Nigeria (%)
Place of birth for the foreign-born population - Senegal (%)
Place of birth for the foreign-born population - Sierra Leone (%)
Place of birth for the foreign-born population - Other Western Africa (%)
Place of birth for the foreign-born population - Australia (%)
Place of birth for the foreign-born population - New Zealand (%)
Place of birth for the foreign-born population - Fiji (%)
Place of birth for the foreign-born population - Micronesia (%)
Place of birth for the foreign-born population - Bahamas (%)
Place of birth for the foreign-born population - Barbados (%)
Place of birth for the foreign-born population - Cuba (%)
Place of birth for the foreign-born population - Dominica (%)
Place of birth for the foreign-born population - Dominican Republic (%)
Place of birth for the foreign-born population - Grenada (%)
Place of birth for the foreign-born population - Haiti (%)
Place of birth for the foreign-born population - Jamaica (%)
Place of birth for the foreign-born population - St. Vincent and the Grenadines (%)
Place of birth for the foreign-born population - Trinidad and Tobago (%)
Place of birth for the foreign-born population - West Indies (%)
Place of birth for the foreign-born population - Other Caribbean (%)
Place of birth for the foreign-born population - Belize (%)
Place of birth for the foreign-born population - Costa Rica (%)
Place of birth for the foreign-born population - El Salvador (%)
Place of birth for the foreign-born population - Guatemala (%)
Place of birth for the foreign-born population - Honduras (%)
Place of birth for the foreign-born population - Mexico (%)
Place of birth for the foreign-born population - Nicaragua (%)
Place of birth for the foreign-born population - Panama (%)
Place of birth for the foreign-born population - Other Central America (%)
Place of birth for the foreign-born population - Argentina (%)
Place of birth for the foreign-born population - Bolivia (%)
Place of birth for the foreign-born population - Brazil (%)
Place of birth for the foreign-born population - Chile (%)
Place of birth for the foreign-born population - Colombia (%)
Place of birth for the foreign-born population - Ecuador (%)
Place of birth for the foreign-born population - Guyana (%)
Place of birth for the foreign-born population - Peru (%)
Place of birth for the foreign-born population - Uruguay (%)
Place of birth for the foreign-born population - Venezuela (%)
Place of birth for the foreign-born population - Other South America (%)
Place of birth for the foreign-born population - Canada (%)
Place of birth for the foreign-born population - Other Northern America (%)
Place of birth for the foreign-born population - Other (%)
Latest news about races in Swampscott, MA collected exclusively by city-data.com from local newspapers, TV, and radio stations
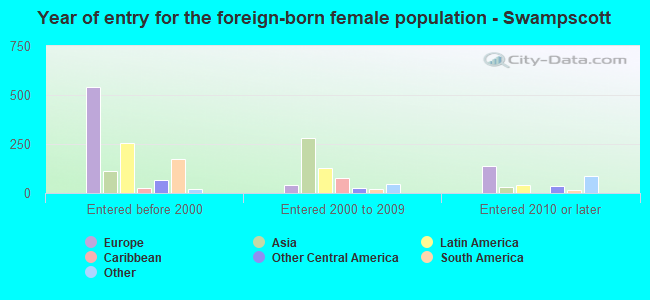
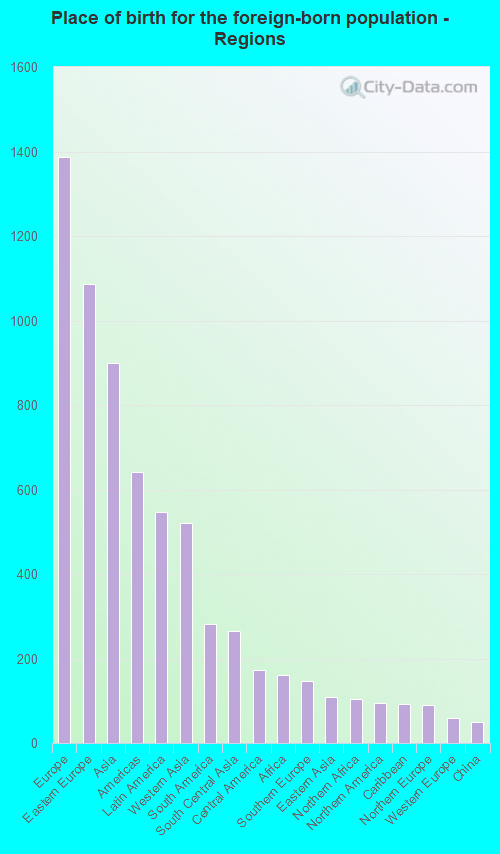
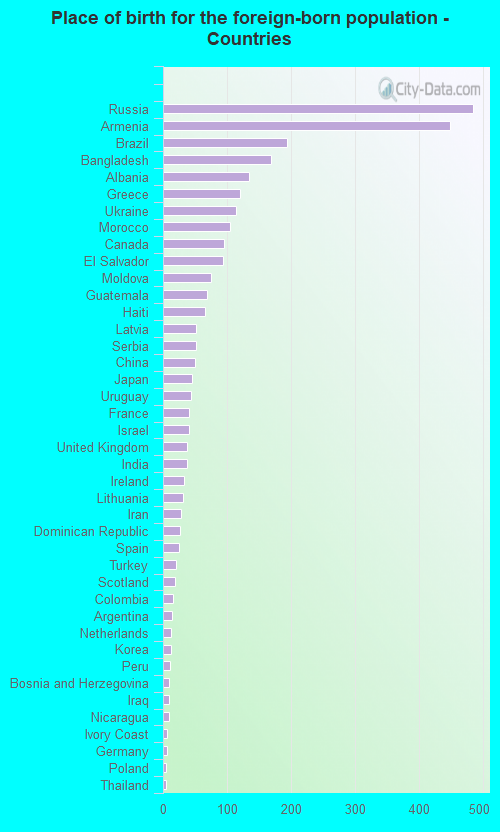
According to 2022 data, the most numerous races in Swampscott, MA are White alone (12,771 residents), Hispanic (818 residents), and Asian alone (477 residents). 74.9% of Swampscott residents speak English at home. 20.4% of Swampscott, MA residents are foreign-born (8.9% born in Europe, 5.8% born in Asia, 3.5% born in Latin America), which is 11.8% greater than the foreign-born rate of 18.0% across the entire state of Massachusetts.
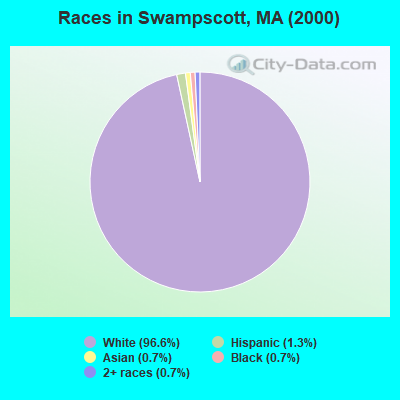
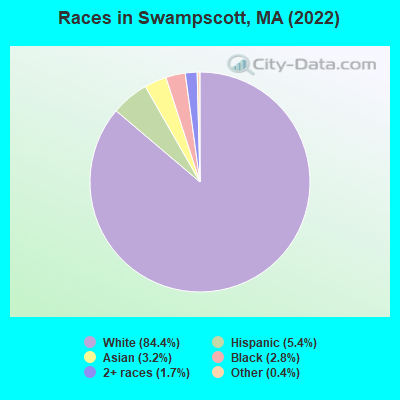
Race distribution in Swampscott
2000 2022
5,198,359 81.9% White alone 428,729 6.8% Hispanic 318,329 5.0% Black alone 236,786 3.7% Asian alone 110,338 1.7% Two or more races 43,586 0.7% Other race alone 11,264 0.2% American Indian alone 1,706 0.03% Native Hawaiian and Other
4,676,627 67.0% White alone 911,038 13.0% Hispanic 501,463 7.2% Asian alone 459,740 6.6% Black alone 341,889 4.9% Two or more races 84,403 1.2% Other race alone 5,838 0.08% American Indian alone 976 0.01% Native Hawaiian and Other
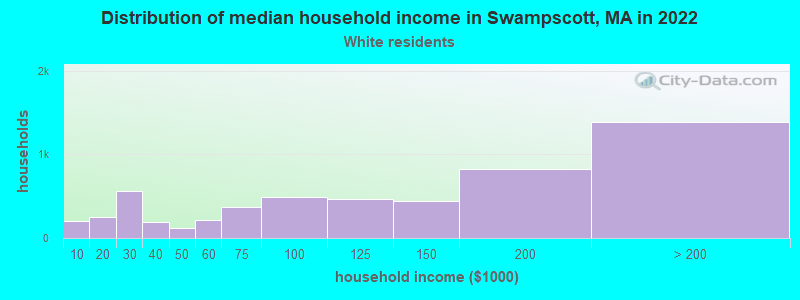
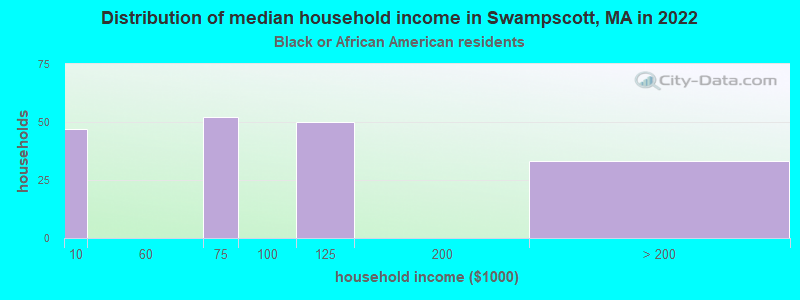
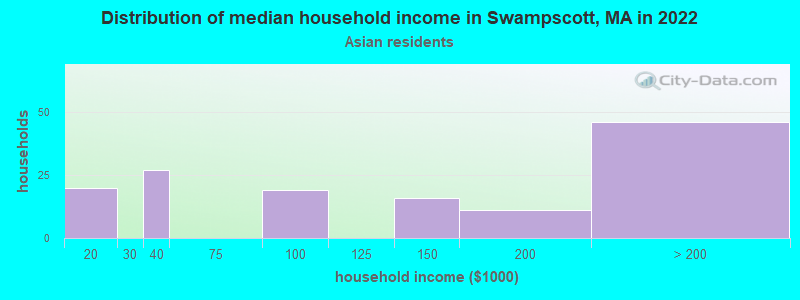
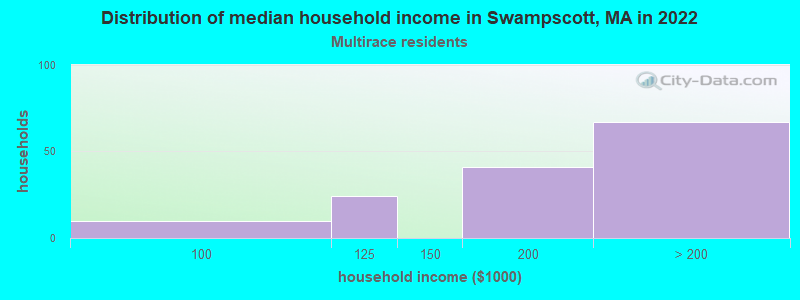
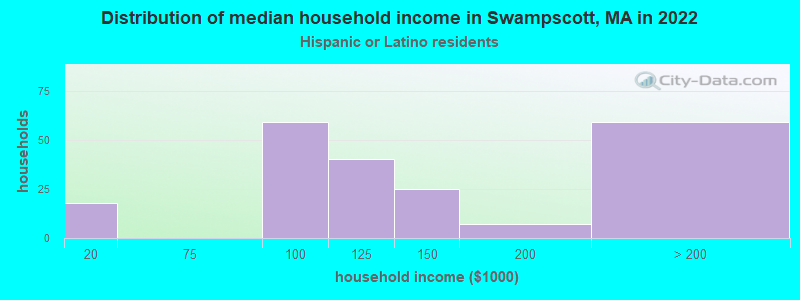
Income and house value in Swampscott Median household income in 2022 $120,821 White non-Hispanic householders$126,897 Asian householdersover $200,000 Two or more races householders$112,557 Hispanic or Latino race householdersMedian 2022 house value $740,090 White Non-Hispanic householders$423,774 Black or African American householdersover $1,000,000 American Indian or Alaska Native householders $72,428 Asian householders$296,299 Some other race householders$592,599 Two or more races householders$296,299 Hispanic or Latino householders
Median age by race in Swampscott
47.5 Median age for White residents45.4 48.7 48.7 Median age for Black or African American residents53.4 45.2 53.9 Median age for American Indian / Alaska Native residents-679,156,908.0 -364,551,862.7 39.9 Median age for Asian residents41.3 38.9 -514,227,641.8 Median age for Native Hawaiian / Pacific Islander residents-666,666,666.0 -508,717,948.2 74.1 Median age for Other race residents-682,593,856.0 -702,645,501.9 35.7 Median age for Two or more races residents19.2 37.5 47.0 Median age for White alone residents44.8 48.5 36.6 Median age for Hispanic or Latino residents22.0 45.1
Owner/renter occupied households by race in Swampscott
House owners and renters - White residents 4,246 76.9% Owner occupied1,273 23.1% Renter occupiedHouse owners and renters - Black or African American residents 36 19.2% Owner occupied151 80.8% Renter occupiedHouse owners and renters - American Indian / Alaska Native residents 39 100.0% Owner occupiedHouse owners and renters - Asian residents 102 68.2% Owner occupied48 31.8% Renter occupiedHouse owners and renters - Other race residents 65 100.0% Owner occupiedHouse owners and renters - Two or more races residents 126 81.1% Owner occupied29 18.9% Renter occupiedHouse owners and renters - White alone residents 4,269 76.3% Owner occupied1,325 23.7% Renter occupiedHouse owners and renters - Hispanic or Latino residents 149 70.3% Owner occupied63 29.7% Renter occupied
Language usage in Swampscott
English speakers - Total 74.9% of residents of Swampscott speak English at home.
3.2% of residents speak Spanish at home 293 63.6% Speak English very well168 36.4% Speak English less than very well22.0% of residents speak other language at home 1,738 55.1% Speak English very well1,414 44.9% Speak English less than very well
English speakers - Born in the United States 96.5% of residents of Swampscott speak English at home.
0.4% of residents speak Spanish at home 16 100.0% Speak English very well3.6% of residents speak other language at home 94 70.7% Speak English very well39 29.3% Speak English less than very well
All residents speak only English at home
English speakers - Foreign-born 13.9% of residents of Swampscott speak English at home.
8.9% of residents speak Spanish at home 123 43.3% Speak English very well161 56.7% Speak English less than very well75.7% of residents speak other language at home 1,093 45.1% Speak English very well1,332 54.9% Speak English less than very well
White (Caucasian) - Speak only English Native:
96.0% (9,556)Foreign-born:
12.0% (194)
White (Caucasian) - Speak another language Native:
4.2% (418)Foreign-born:
86.5% (1,399)
Black or African American - Speak only English Native:
81.6% (192)Foreign-born:
68.2% (88)
Black or African American - Speak another language Native:
18.7% (44)Foreign-born:
43.0% (56)
American Indian / Alaska Native - Speak another language Native:
100.0% (28)Foreign-born:
100.0% (60)
Asian - Speak only English Native:
54.9% (72)Foreign-born:
12.8% (42)
Asian - Speak another language Native:
45.0% (59)Foreign-born:
87.2% (288)
Other race - Speak only English Native:
64.9% (24)Foreign-born:
100.0% (66)
Two or more races - Speak only English Native:
69.6% (336)Foreign-born:
21.5% (51)
Two or more races - Speak another language Native:
28.4% (137)Foreign-born:
82.4% (194)
White alone - Speak only English Native:
95.0% (9,576)Foreign-born:
11.4% (216)
White alone - Speak another language Native:
5.1% (510)Foreign-born:
89.4% (1,692)
Hispanic or Latino - Speak only English Native:
59.5% (248)Foreign-born:
5.0% (17)
Hispanic or Latino - Speak another language Native:
42.2% (176)Foreign-born:
95.0% (319)
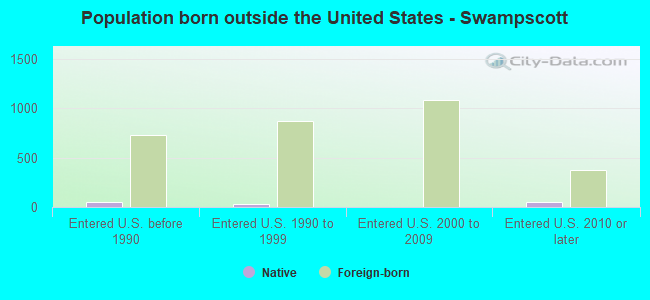
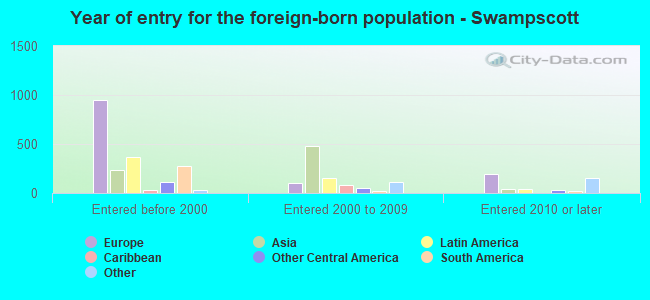
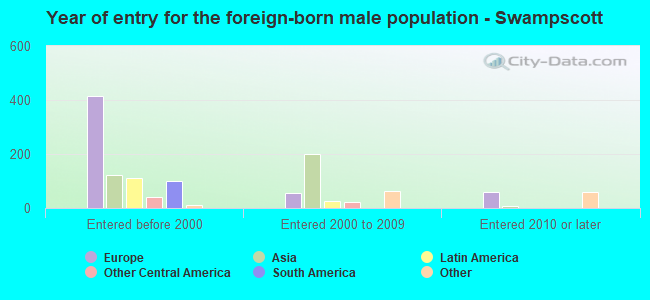
Foreign-born residents in Swampscott 3,090 residents are foreign born (8.9% Europe , 5.8% Asia , 3.5% Latin America ).
This city:
20.4%Massachusetts:
17.6%
Marital status for residents in Swampscott Marital status - White (Caucasian) population 15 years and over
Males 22.4% Never married65.1% Now married2.9% Separated2.1% Widowed7.5% DivorcedFemales 21.0% Never married56.8% Now married0.9% Separated9.0% Widowed12.3% DivorcedWomen who gave birth in the past 12 months Now married:
100.0% (147)Unmarried:
0.0% (0)
Women who did not give birth in the past 12 months Now married:
53.4% (1,299)Unmarried:
46.6% (1,135)
Marital status - Black or African American population 15 years and over
Males 41.3% Never married52.9% Now married0.0% Separated0.0% Widowed5.8% DivorcedFemales 52.9% Never married23.8% Now married0.0% Separated6.6% Widowed16.7% DivorcedWomen who did not give birth in the past 12 months Now married:
33.1% (50)Unmarried:
66.9% (100)
Marital status - American Indian / Alaska Native population 15 years and over
Males 0.0% Never married100.0% Now married0.0% Separated0.0% Widowed0.0% DivorcedFemales 0.0% Never married100.0% Now married0.0% Separated0.0% Widowed0.0% DivorcedWomen who did not give birth in the past 12 months Now married:
100.0% (11)Unmarried:
0.0% (0)
Marital status - Asian population 15 years and over
Males 48.6% Never married51.4% Now married0.0% Separated0.0% Widowed0.0% DivorcedFemales 32.8% Never married53.0% Now married0.0% Separated14.1% Widowed0.0% DivorcedWomen who gave birth in the past 12 months Now married:
100.0% (7)Unmarried:
0.0% (0)
Women who did not give birth in the past 12 months Now married:
57.5% (93)Unmarried:
42.5% (68)
Marital status - Other race population 15 years and over
Males 0.0% Never married0.0% Now married0.0% Separated0.0% Widowed100.0% DivorcedFemales 0.0% Never married100.0% Now married0.0% Separated0.0% Widowed0.0% DivorcedWomen who did not give birth in the past 12 months Now married:
100.0% (38)Unmarried:
0.0% (0)
Marital status - Two or more races population 15 years and over
Males 56.2% Never married43.8% Now married0.0% Separated0.0% Widowed0.0% DivorcedFemales 28.3% Never married71.7% Now married0.0% Separated0.0% Widowed0.0% DivorcedWomen who did not give birth in the past 12 months Now married:
62.2% (81)Unmarried:
37.8% (49)
Marital status - White alone, not Hispanic / Latino population 15 years and over
Males 22.6% Never married64.8% Now married2.9% Separated2.1% Widowed7.6% DivorcedFemales 21.1% Never married56.1% Now married0.9% Separated9.3% Widowed12.7% DivorcedWomen who gave birth in the past 12 months Now married:
100.0% (155)Unmarried:
0.0% (0)
Women who did not give birth in the past 12 months Now married:
52.3% (1,286)Unmarried:
47.7% (1,174)
Marital status - Hispanic or Latino population 15 years and over
Males 38.9% Never married61.1% Now married0.0% Separated0.0% Widowed0.0% DivorcedFemales 18.2% Never married81.8% Now married0.0% Separated0.0% Widowed0.0% DivorcedWomen who did not give birth in the past 12 months Now married:
82.2% (198)Unmarried:
17.8% (43)
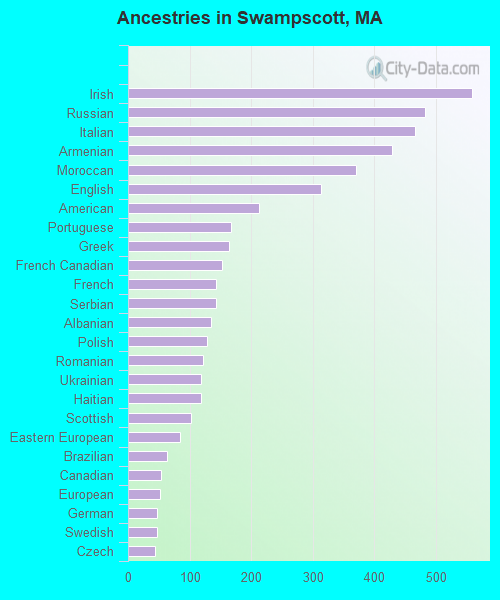
Ancestries in Swampscott
558 8.8% Irish482 7.6% Russian465 7.4% Italian428 6.8% Armenian370 5.9% Moroccan314 5.0% English213 3.4% American167 2.6% Portuguese164 2.6% Greek153 2.4% French Canadian143 2.3% French143 2.3% Serbian135 2.1% Albanian128 2.0% Polish122 1.9% Romanian119 1.9% Ukrainian119 1.9% Haitian102 1.6% Scottish85 1.3% Eastern European63 1.0% Brazilian53 0.8% Canadian52 0.8% European47 0.7% German47 0.7% Swedish44 0.7% Czech31 0.5% Lithuanian29 0.5% African25 0.4% Iranian15 0.2% Palestinian12 0.2% Dutch11 0.2% Yugoslavian11 0.2% Lebanese6 0.10% Turkish4 0.06% Hungarian2 0.03% British1 0.02% Cape Verdean
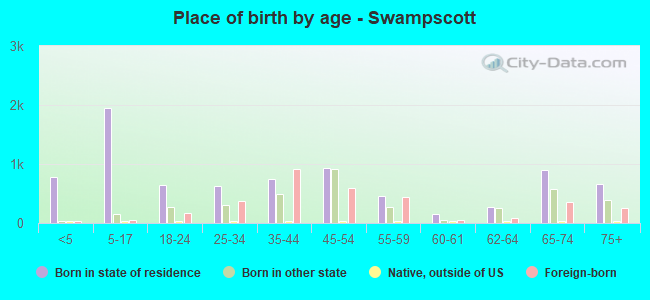
Children Nativity (place of birth) in Swampscott
Children under 6 years - Living with two parents Both parents native 420 100.0% NativeBoth parents foreign-born 322 100.0% NativeOne native, one foreign-born parent 187 100.0% NativeChildren under 6 years - Living with one parent Native parent 17 100.0% NativeChildren 6 to 17 years - Living with two parents Both parents native 1,073 99.8% Native2 0.2% Foreign-bornBoth parents foreign-born 281 89.0% Native35 11.0% Foreign-bornOne native, one foreign-born parent 204 100.0% NativeChildren 6 to 17 years - Living with one parent Native parent 252 100.0% NativeForeign-born parent 55 50.7% Native54 49.3% Foreign-born
Grandparents responsible for own grandchildren in Swampscott
Grandparents (30 to 59 years) Black or African American 8 100.0% Responsible for grandchildren
Grandparents (60 years and over)