Races in Sunnyside, Oregon (OR) Detailed Stats
Ancestries, Foreign-born residents, place of birth

Recent posts about races in Sunnyside, Oregon on our local forum with over 2,400,000 registered users:
 | Diversity & Inclusion in Happy Valley/West Linn, OR? (10 replies) |
| Woodstock? (35 replies) |
| Family Moving to Portland Area (23 replies) |
| A non-controversial Portland thread (94 replies) |
| Possible relocation to Portland Oregon- please assist (47 replies) |
| Looks like I got the job at Kaiser in (lower) Sunnyside....now where to live? (23 replies) |
17.6% of Sunnyside, OR residents are foreign-born (8.4% born in Europe, 6.1% born in Asia, 2.8% born in Latin America), which is 49.0% greater than the foreign-born rate of 9.0% across the entire state of Oregon.
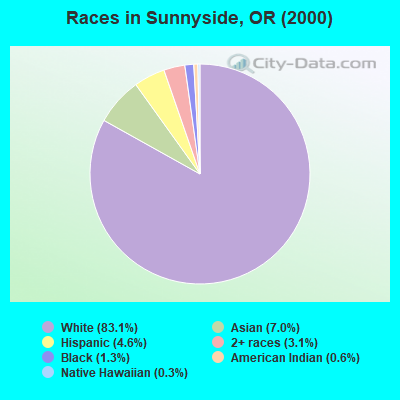
Race distribution in Sunnyside

- 5,64383.1%White alone
- 4787.0%Asian alone
- 3104.6%Hispanic
- 2093.1%Two or more races
- 861.3%Black alone
- 380.6%American Indian alone
- 210.3%Native Hawaiian and Other
Pacific Islander alone - 60.09%Other race alone
2000
2022
-
- 2,857,61683.5%White alone
- 275,3148.0%Hispanic
- 100,3332.9%Asian alone
- 82,7332.4%Two or more races
- 53,3251.6%Black alone
- 40,1301.2%American Indian alone
- 7,3980.2%Native Hawaiian and Other
Pacific Islander alone - 4,5500.1%Other race alone

-
- 3,037,57171.6%White alone
- 609,53814.4%Hispanic
- 252,7446.0%Two or more races
- 191,2834.5%Asian alone
- 78,2281.8%Black alone
- 29,3990.7%American Indian alone
- 25,7310.6%Other race alone
- 15,6430.4%Native Hawaiian and Other
Pacific Islander alone

Income and house value in Sunnyside
- Median household income in 2022
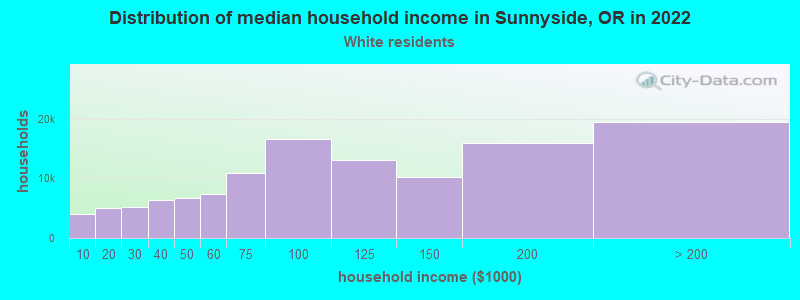
- $83,563White non-Hispanic householders
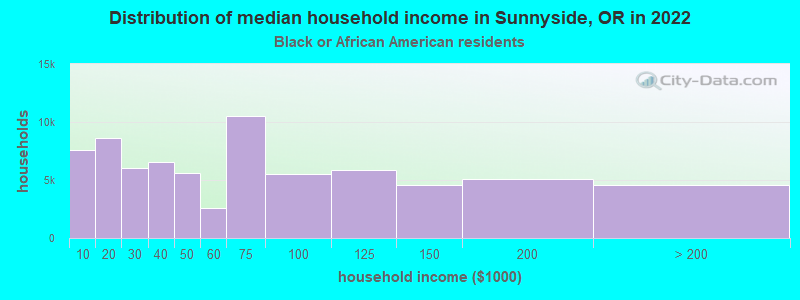
- $176,765Black householders
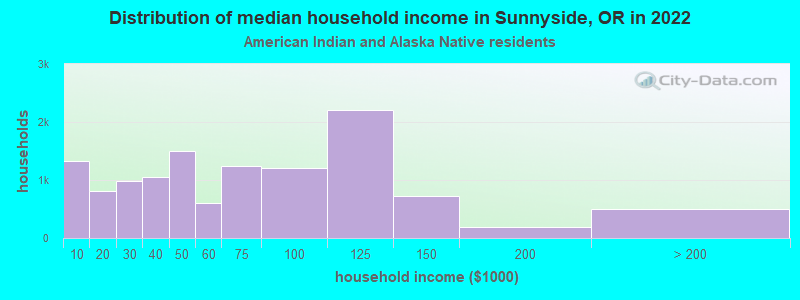
- $88,994American Indian and Alaska Native householders
- $86,400Asian householders
- $93,821Native Hawaiian and other Pacific Islander householders
- $159,776Some other race householders
- $76,201Two or more races householders
- $106,922Hispanic or Latino race householders
- Median 2022 house value
- $632,606White Non-Hispanic householders
- $834,711Asian householders
- $470,099Two or more races householders
- $712,751Hispanic or Latino householders
Household income for White non-Hispanic householders
Household income for Black householders
Household income for American Indian and Alaska Native householders
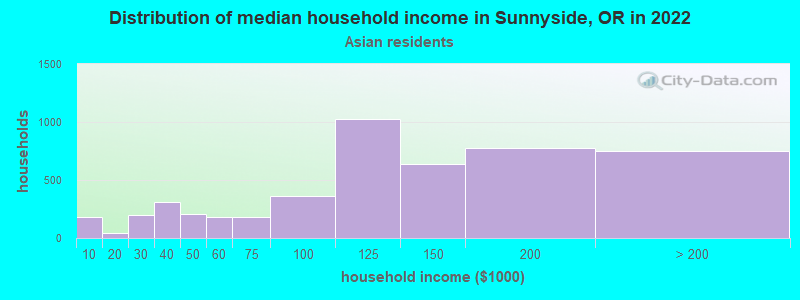
Household income for Asian householders
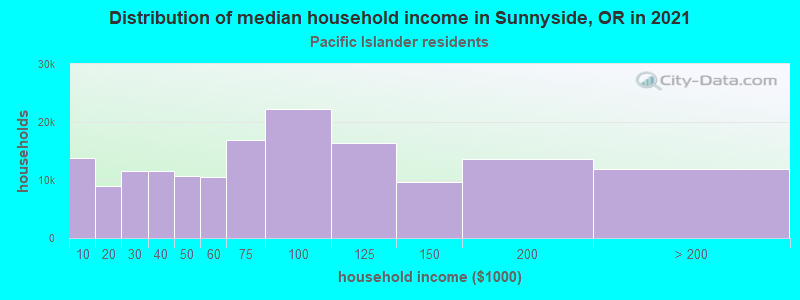
Household income for Native Hawaiian and other Pacific Islander householders
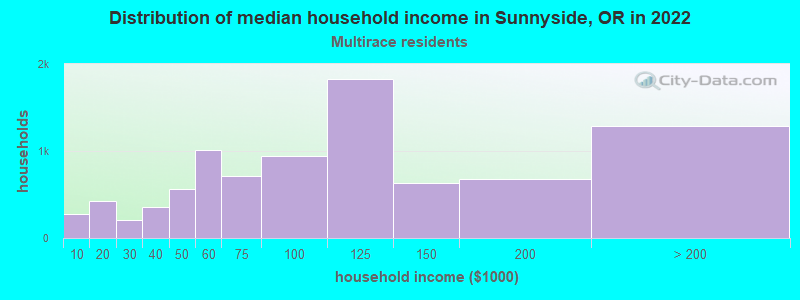
Household income for Two or more races householders
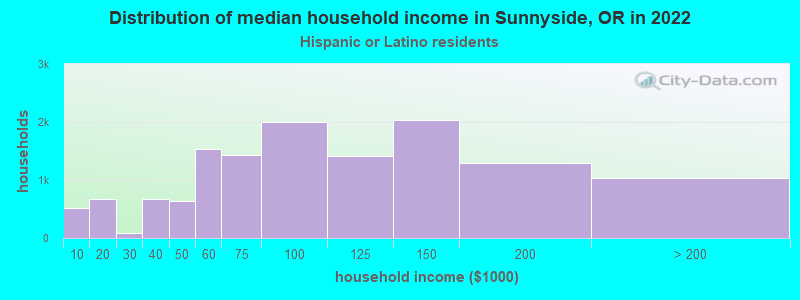
Household income for Hispanic or Latino race householders
Foreign-born residents in Sunnyside
1,198 residents are foreign born (8.4% Europe, 6.1% Asia, 2.8% Latin America).
| This city: | 17.6% |
| Oregon: | 8.5% |
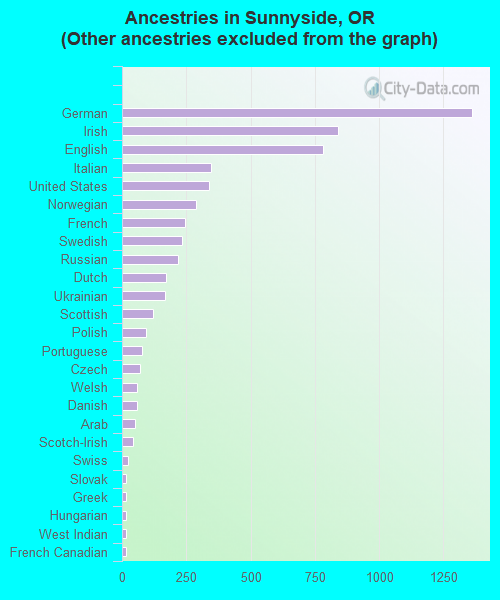
Ancestries in Sunnyside

- 1,70523.2%Other
- 1,35918.5%German
- 83911.4%Irish
- 78310.6%English
- 3474.7%Italian
- 3384.6%United States
- 2863.9%Norwegian
- 2443.3%French
- 2323.2%Swedish
- 2183.0%Russian
- 1722.3%Dutch
- 1682.3%Ukrainian
- 1211.6%Scottish
- 931.3%Polish
- 771.0%Portuguese
- 711.0%Czech
- 590.8%Welsh
- 570.8%Danish
- 520.7%Arab
- 410.6%Scotch-Irish
- 250.3%Swiss
- 170.2%Slovak
- 160.2%Greek
- 160.2%Hungarian
- 150.2%West Indian
- 140.2%French Canadian
Zip codes: 97015.