Races in Summerlin South, Nevada (NV) Detailed Stats
Data:
Races - White alone (%)
Races - White alone (% change since 2000)
Races - Black alone (%)
Races - Black alone (% change since 2000)
Races - American Indian alone (%)
Races - American Indian alone (% change since 2000)
Races - Asian alone (%)
Races - Asian alone (% change since 2000)
Races - Hispanic (%)
Races - Hispanic (% change since 2000)
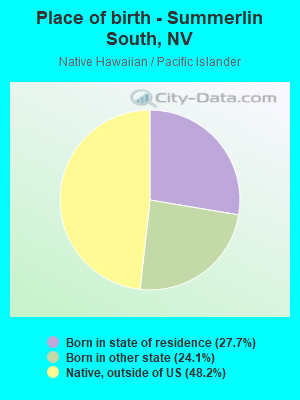
Races - Native Hawaiian and Other Pacific Islander alone (%)
Races - Native Hawaiian and Other Pacific Islander alone (% change since 2000)
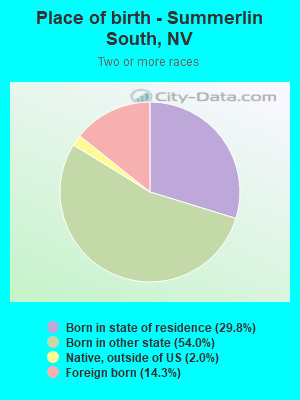
Races - Two or more races(%)
Races - Two or more races(% change since 2000)
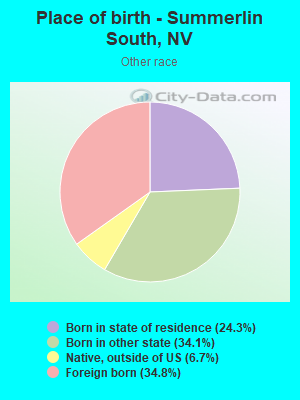
Races - Other race alone (%)
Races - Other race alone (% change since 2000)
Racial diversity
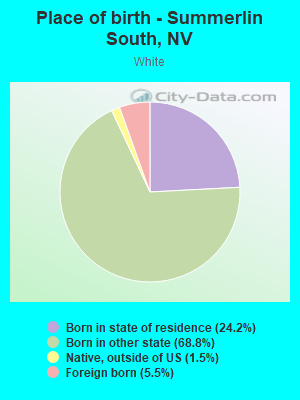
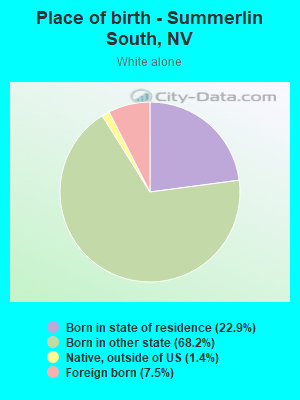
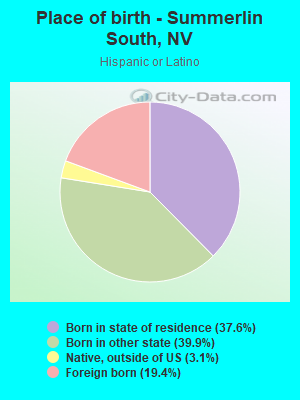
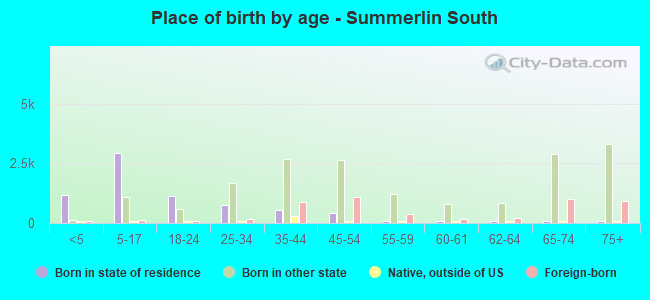
Place of birth - Born in state of residence (%)
Place of birth - Born in state of residence (%) - White
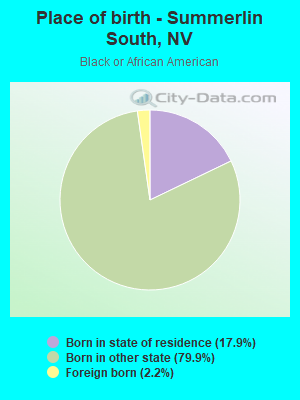
Place of birth - Born in state of residence (%) - Black or African American
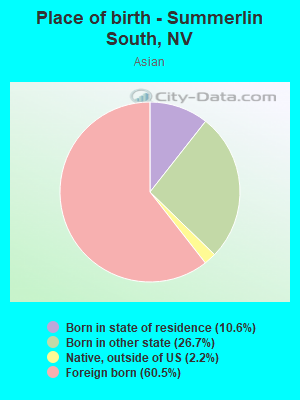
Place of birth - Born in state of residence (%) - Asian
Place of birth - Born in state of residence (%) - Hispanic or Latino
Place of birth - Born in state of residence (%) - American Indian and Alaska Native
Place of birth - Born in state of residence (%) - Multirace
Place of birth - Born in state of residence (%) - Other Race
Place of birth - Born in other state (%)
Place of birth - Born in other state (%) - White
Place of birth - Born in other state (%) - Black or African American
Place of birth - Born in other state (%) - Asian
Place of birth - Born in other state (%) - Hispanic or Latino
Place of birth - Born in other state (%) - American Indian and Alaska Native
Place of birth - Born in other state (%) - Multirace
Place of birth - Born in other state (%) - Other Race
Place of birth - Native, outside of US (%)
Place of birth - Native, outside of US (%) - White
Place of birth - Native, outside of US (%) - Black or African American
Place of birth - Native, outside of US (%) - Asian
Place of birth - Native, outside of US (%) - Hispanic or Latino
Place of birth - Native, outside of US (%) - American Indian and Alaska Native
Place of birth - Native, outside of US (%) - Multirace
Place of birth - Native, outside of US (%) - Other Race
Place of birth - Foreign born (%)
Place of birth - Foreign born (%) - White
Place of birth - Foreign born (%) - Black or African American
Place of birth - Foreign born (%) - Asian
Place of birth - Foreign born (%) - Hispanic or Latino
Place of birth - Foreign born (%) - American Indian and Alaska Native
Place of birth - Foreign born (%) - Multirace
Place of birth - Foreign born (%) - Other Race
Residents speaking English at home (%)
Residents speaking English at home - Born in the United States (%)
Residents speaking English at home - Native, born elsewhere (%)
Residents speaking English at home - Foreign born (%)
Residents speaking Spanish at home (%)
Residents speaking Spanish at home - Born in the United States (%)
Residents speaking Spanish at home - Native, born elsewhere (%)
Residents speaking Spanish at home - Foreign born (%)
Residents speaking other language at home (%)
Residents speaking other language at home - Born in the United States (%)
Residents speaking other language at home - Native, born elsewhere (%)
Residents speaking other language at home - Foreign born (%)
Marital status - Never married (%)
Marital status - Now married (%)
Marital status - Separated (%)
Marital status - Widowed (%)
Marital status - Divorced (%)
Ancestries Reported - Arab (%)
Ancestries Reported - Czech (%)
Ancestries Reported - Danish (%)
Ancestries Reported - Dutch (%)
Ancestries Reported - English (%)
Ancestries Reported - French (%)
Ancestries Reported - French Canadian (%)
Ancestries Reported - German (%)
Ancestries Reported - Greek (%)
Ancestries Reported - Hungarian (%)
Ancestries Reported - Irish (%)
Ancestries Reported - Italian (%)
Ancestries Reported - Lithuanian (%)
Ancestries Reported - Norwegian (%)
Ancestries Reported - Polish (%)
Ancestries Reported - Portuguese (%)
Ancestries Reported - Russian (%)
Ancestries Reported - Scotch-Irish (%)
Ancestries Reported - Scottish (%)
Ancestries Reported - Slovak (%)
Ancestries Reported - Subsaharan African (%)
Ancestries Reported - Swedish (%)
Ancestries Reported - Swiss (%)
Ancestries Reported - Ukrainian (%)
Ancestries Reported - United States (%)
Ancestries Reported - Welsh (%)
Ancestries Reported - West Indian (%)
Ancestries Reported - Other (%)
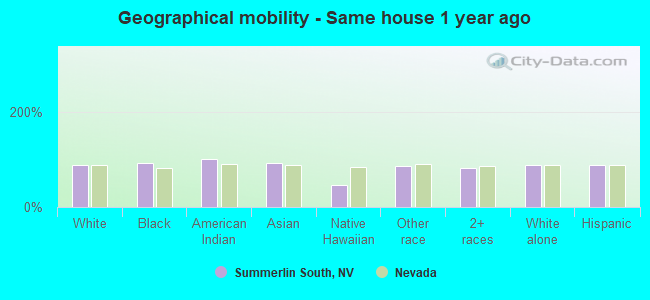
Geographical mobility - Same house 1 year ago (%)
Geographical mobility - Same house 1 year ago (%) - White
Geographical mobility - Same house 1 year ago (%) - Black or African American
Geographical mobility - Same house 1 year ago (%) - Asian
Geographical mobility - Same house 1 year ago (%) - Hispanic or Latino
Geographical mobility - Same house 1 year ago (%) - American Indian and Alaska Native
Geographical mobility - Same house 1 year ago (%) - Multirace
Geographical mobility - Same house 1 year ago (%) - Other Race
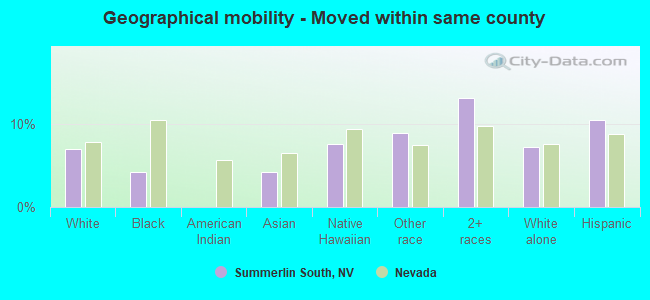
Geographical mobility - Moved within same county (%)
Geographical mobility - Moved within same county (%) - White
Geographical mobility - Moved within same county (%) - Black or African American
Geographical mobility - Moved within same county (%) - Asian
Geographical mobility - Moved within same county (%) - Hispanic or Latino
Geographical mobility - Moved within same county (%) - American Indian and Alaska Native
Geographical mobility - Moved within same county (%) - Multirace
Geographical mobility - Moved within same county (%) - Other Race
Geographical mobility - Moved from different county within same state (%)
Geographical mobility - Moved from different county within same state (%) - White
Geographical mobility - Moved from different county within same state (%) - Black or African American
Geographical mobility - Moved from different county within same state (%) - Asian
Geographical mobility - Moved from different county within same state (%) - Hispanic or Latino
Geographical mobility - Moved from different county within same state (%) - American Indian and Alaska Native
Geographical mobility - Moved from different county within same state (%) - Multirace
Geographical mobility - Moved from different county within same state (%) - Other Race
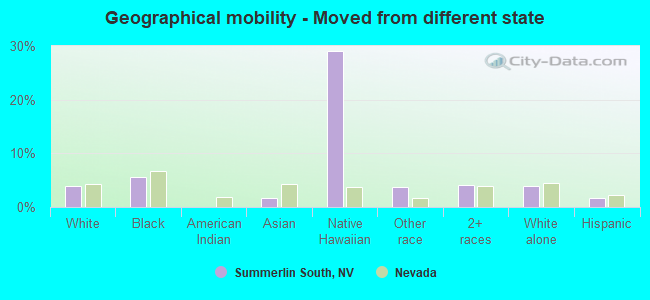
Geographical mobility - Moved from different state (%)
Geographical mobility - Moved from different state (%) - White
Geographical mobility - Moved from different state (%) - Black or African American
Geographical mobility - Moved from different state (%) - Asian
Geographical mobility - Moved from different state (%) - Hispanic or Latino
Geographical mobility - Moved from different state (%) - American Indian and Alaska Native
Geographical mobility - Moved from different state (%) - Multirace
Geographical mobility - Moved from different state (%) - Other Race
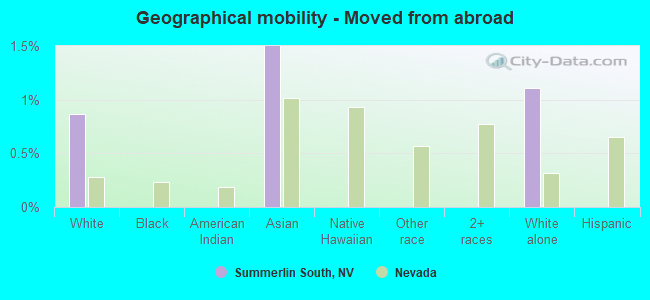
Geographical mobility - Moved from abroad (%)
Geographical mobility - Moved from abroad (%) - White
Geographical mobility - Moved from abroad (%) - Black or African American
Geographical mobility - Moved from abroad (%) - Asian
Geographical mobility - Moved from abroad (%) - Hispanic or Latino
Geographical mobility - Moved from abroad (%) - American Indian and Alaska Native
Geographical mobility - Moved from abroad (%) - Multirace
Geographical mobility - Moved from abroad (%) - Other Race
Place of birth for the foreign-born population - Ireland (%)
Place of birth for the foreign-born population - Denmark (%)
Place of birth for the foreign-born population - Norway (%)
Place of birth for the foreign-born population - Sweden (%)
Place of birth for the foreign-born population - United Kingdom (%)
Place of birth for the foreign-born population - England (%)
Place of birth for the foreign-born population - Scotland (%)
Place of birth for the foreign-born population - Other Northern Europe (%)
Place of birth for the foreign-born population - Austria (%)
Place of birth for the foreign-born population - Belgium (%)
Place of birth for the foreign-born population - France (%)
Place of birth for the foreign-born population - Germany (%)
Place of birth for the foreign-born population - Netherlands (%)
Place of birth for the foreign-born population - Switzerland (%)
Place of birth for the foreign-born population - Other Western Europe (%)
Place of birth for the foreign-born population - Greece (%)
Place of birth for the foreign-born population - Italy (%)
Place of birth for the foreign-born population - Portugal (%)
Place of birth for the foreign-born population - Spain (%)
Place of birth for the foreign-born population - Other Southern Europe (%)
Place of birth for the foreign-born population - Albania (%)
Place of birth for the foreign-born population - Belarus (%)
Place of birth for the foreign-born population - Bosnia and Herzegovina (%)
Place of birth for the foreign-born population - Bulgaria (%)
Place of birth for the foreign-born population - Croatia (%)
Place of birth for the foreign-born population - Czechoslovakia (%)
Place of birth for the foreign-born population - Hungary (%)
Place of birth for the foreign-born population - Latvia (%)
Place of birth for the foreign-born population - Lithuania (%)
Place of birth for the foreign-born population - North Macedonia (Macedonia) (%)
Place of birth for the foreign-born population - Moldova (%)
Place of birth for the foreign-born population - Poland (%)
Place of birth for the foreign-born population - Romania (%)
Place of birth for the foreign-born population - Russia (%)
Place of birth for the foreign-born population - Serbia (%)
Place of birth for the foreign-born population - Ukraine (%)
Place of birth for the foreign-born population - Other Eastern Europe (%)
Place of birth for the foreign-born population - China (%)
Place of birth for the foreign-born population - Hong Kong (%)
Place of birth for the foreign-born population - Taiwan (%)
Place of birth for the foreign-born population - Japan (%)
Place of birth for the foreign-born population - Korea (%)
Place of birth for the foreign-born population - Other Eastern Asia (%)
Place of birth for the foreign-born population - Afghanistan (%)
Place of birth for the foreign-born population - Bangladesh (%)
Place of birth for the foreign-born population - India (%)
Place of birth for the foreign-born population - Iran (%)
Place of birth for the foreign-born population - Kazakhstan (%)
Place of birth for the foreign-born population - Nepal (%)
Place of birth for the foreign-born population - Pakistan (%)
Place of birth for the foreign-born population - Sri Lanka (%)
Place of birth for the foreign-born population - Uzbekistan (%)
Place of birth for the foreign-born population - Other South Central Asia (%)
Place of birth for the foreign-born population - Burma (%)
Place of birth for the foreign-born population - Cambodia (%)
Place of birth for the foreign-born population - Indonesia (%)
Place of birth for the foreign-born population - Laos (%)
Place of birth for the foreign-born population - Malaysia (%)
Place of birth for the foreign-born population - Philippines (%)
Place of birth for the foreign-born population - Singapore (%)
Place of birth for the foreign-born population - Thailand (%)
Place of birth for the foreign-born population - Vietnam (%)
Place of birth for the foreign-born population - Other South Eastern Asia (%)
Place of birth for the foreign-born population - Armenia (%)
Place of birth for the foreign-born population - Iraq (%)
Place of birth for the foreign-born population - Israel (%)
Place of birth for the foreign-born population - Jordan (%)
Place of birth for the foreign-born population - Kuwait (%)
Place of birth for the foreign-born population - Lebanon (%)
Place of birth for the foreign-born population - Saudi Arabia (%)
Place of birth for the foreign-born population - Syria (%)
Place of birth for the foreign-born population - Turkey (%)
Place of birth for the foreign-born population - Yemen (%)
Place of birth for the foreign-born population - Other Western Asia (%)
Place of birth for the foreign-born population - Eritrea (%)
Place of birth for the foreign-born population - Ethiopia (%)
Place of birth for the foreign-born population - Kenya (%)
Place of birth for the foreign-born population - Somalia (%)
Place of birth for the foreign-born population - Uganda (%)
Place of birth for the foreign-born population - Zimbabwe (%)
Place of birth for the foreign-born population - Other Eastern Africa (%)
Place of birth for the foreign-born population - Cameroon (%)
Place of birth for the foreign-born population - Congo (%)
Place of birth for the foreign-born population - Democratic Republic of Congo (Zaire) (%)
Place of birth for the foreign-born population - Other Middle Africa (%)
Place of birth for the foreign-born population - Egypt (%)
Place of birth for the foreign-born population - Morocco (%)
Place of birth for the foreign-born population - Sudan (%)
Place of birth for the foreign-born population - Other Northern Africa (%)
Place of birth for the foreign-born population - South Africa (%)
Place of birth for the foreign-born population - Other Southern Africa (%)
Place of birth for the foreign-born population - Cabo Verde (%)
Place of birth for the foreign-born population - Ghana (%)
Place of birth for the foreign-born population - Liberia (%)
Place of birth for the foreign-born population - Nigeria (%)
Place of birth for the foreign-born population - Senegal (%)
Place of birth for the foreign-born population - Sierra Leone (%)
Place of birth for the foreign-born population - Other Western Africa (%)
Place of birth for the foreign-born population - Australia (%)
Place of birth for the foreign-born population - New Zealand (%)
Place of birth for the foreign-born population - Fiji (%)
Place of birth for the foreign-born population - Micronesia (%)
Place of birth for the foreign-born population - Bahamas (%)
Place of birth for the foreign-born population - Barbados (%)
Place of birth for the foreign-born population - Cuba (%)
Place of birth for the foreign-born population - Dominica (%)
Place of birth for the foreign-born population - Dominican Republic (%)
Place of birth for the foreign-born population - Grenada (%)
Place of birth for the foreign-born population - Haiti (%)
Place of birth for the foreign-born population - Jamaica (%)
Place of birth for the foreign-born population - St. Vincent and the Grenadines (%)
Place of birth for the foreign-born population - Trinidad and Tobago (%)
Place of birth for the foreign-born population - West Indies (%)
Place of birth for the foreign-born population - Other Caribbean (%)
Place of birth for the foreign-born population - Belize (%)
Place of birth for the foreign-born population - Costa Rica (%)
Place of birth for the foreign-born population - El Salvador (%)
Place of birth for the foreign-born population - Guatemala (%)
Place of birth for the foreign-born population - Honduras (%)
Place of birth for the foreign-born population - Mexico (%)
Place of birth for the foreign-born population - Nicaragua (%)
Place of birth for the foreign-born population - Panama (%)
Place of birth for the foreign-born population - Other Central America (%)
Place of birth for the foreign-born population - Argentina (%)
Place of birth for the foreign-born population - Bolivia (%)
Place of birth for the foreign-born population - Brazil (%)
Place of birth for the foreign-born population - Chile (%)
Place of birth for the foreign-born population - Colombia (%)
Place of birth for the foreign-born population - Ecuador (%)
Place of birth for the foreign-born population - Guyana (%)
Place of birth for the foreign-born population - Peru (%)
Place of birth for the foreign-born population - Uruguay (%)
Place of birth for the foreign-born population - Venezuela (%)
Place of birth for the foreign-born population - Other South America (%)
Place of birth for the foreign-born population - Canada (%)
Place of birth for the foreign-born population - Other Northern America (%)
Place of birth for the foreign-born population - Other (%)
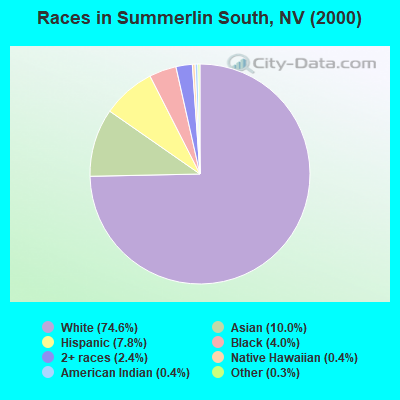
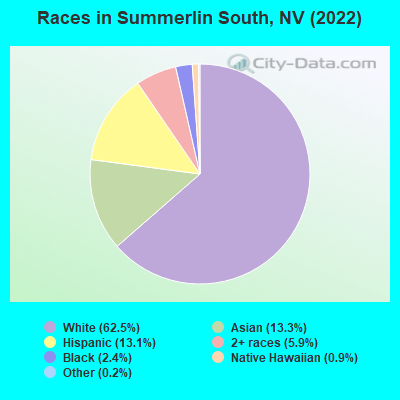
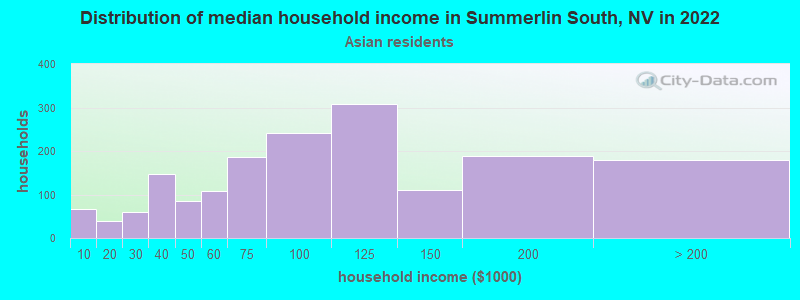
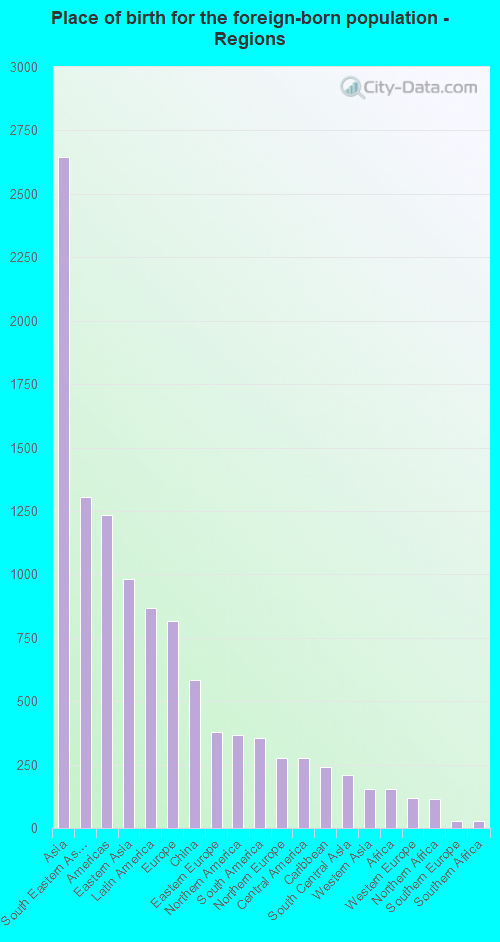
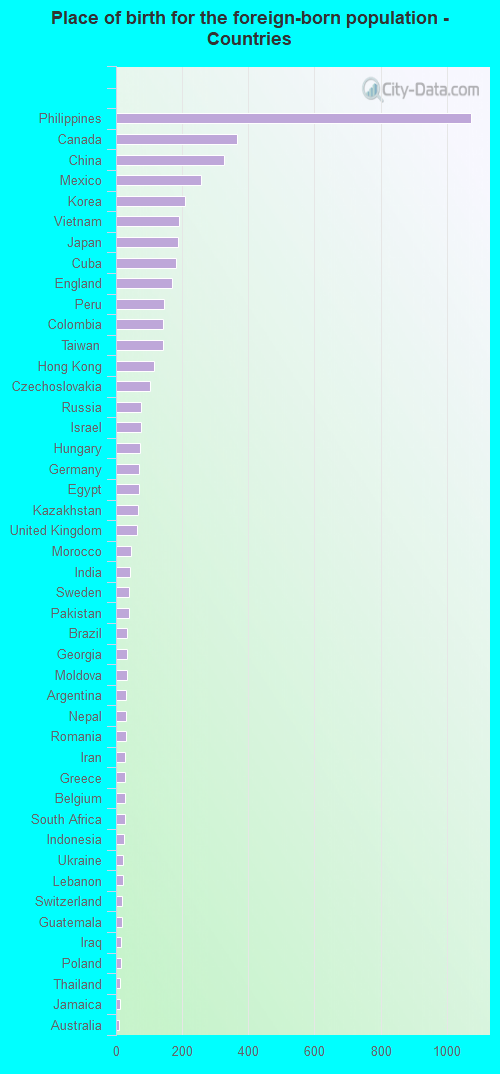
According to 2022 data, the most numerous races in Summerlin South, NV are White alone (19,055 residents), Hispanic (3,977 residents), and Black alone (746 residents). 81.5% of Summerlin South residents speak English at home. 16.0% of Summerlin South, NV residents are foreign-born (8.7% born in Asia, 2.9% born in Latin America, 2.7% born in Europe), which is 12.8% less than the foreign-born rate of 18.0% across the entire state of Nevada.
Race distribution in Summerlin South
2000 2022
1,303,001 65.2% White alone 393,970 19.7% Hispanic 131,509 6.6% Black alone 88,593 4.4% Asian alone 49,231 2.5% Two or more races 21,397 1.1% American Indian alone 7,769 0.4% Native Hawaiian and Other 2,787 0.1% Other race alone
1,410,145 44.4% White alone 961,357 30.3% Hispanic 286,471 9.0% Black alone 281,149 8.8% Asian alone 182,151 5.7% Two or more races 20,102 0.6% Native Hawaiian and Other 18,781 0.6% Other race alone 17,616 0.6% American Indian alone
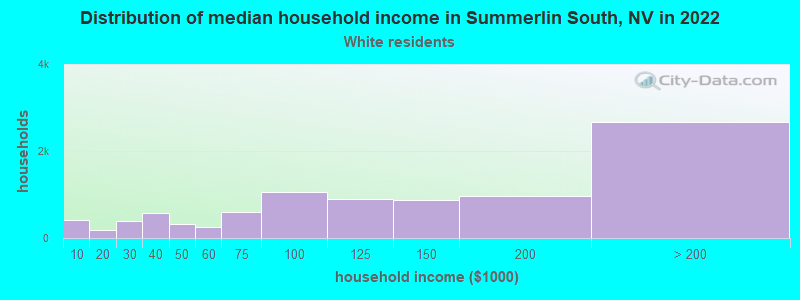
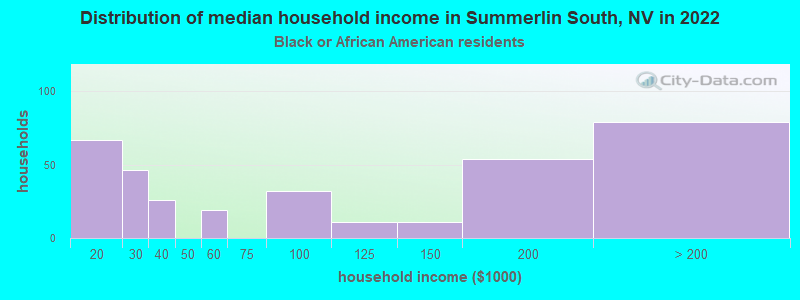
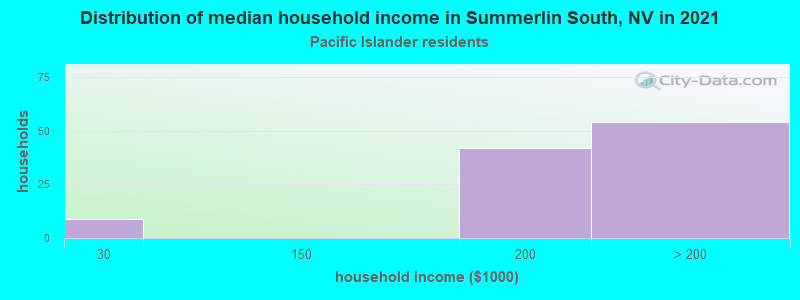
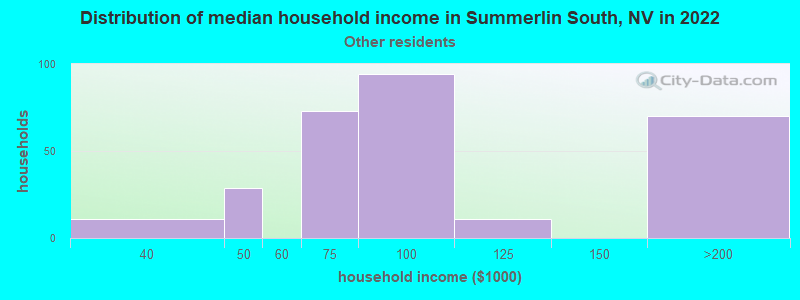
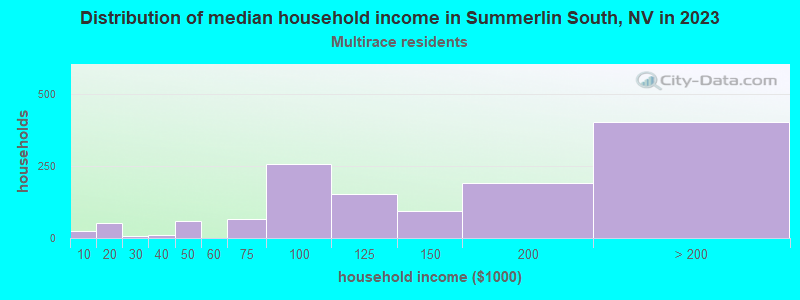
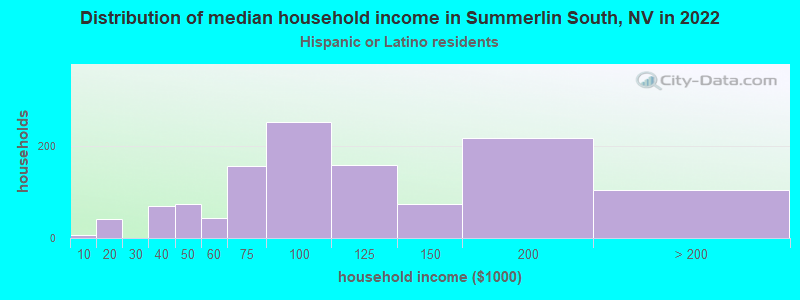
Income and house value in Summerlin South Median household income in 2022 $119,504 White non-Hispanic householders$93,964 Asian householders$158,208 Native Hawaiian and other Pacific Islander householders$90,075 Some other race householders$113,788 Two or more races householders$93,638 Hispanic or Latino race householdersMedian 2022 house value $695,233 White Non-Hispanic householders$631,039 Black or African American householders $711,382 Asian householders$553,521 Some other race householders$778,806 Two or more races householders$646,784 Hispanic or Latino householders
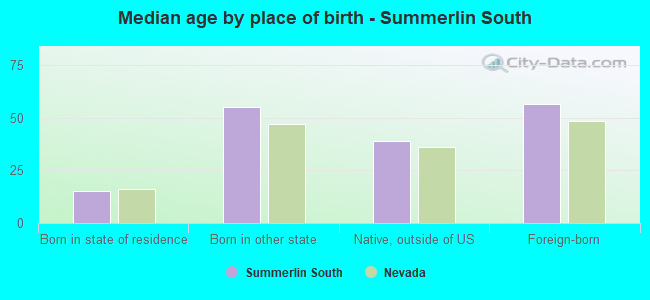
Median age by race in Summerlin South
51.6 Median age for White residents49.0 54.9 58.7 Median age for Black or African American residents41.1 61.8 40.9 Median age for American Indian / Alaska Native residents-662,824,206.8 -660,886,319.2 48.7 Median age for Asian residents40.8 54.0 42.7 Median age for Native Hawaiian / Pacific Islander residents41.4 38.2 43.9 Median age for Other race residents43.1 47.0 24.9 Median age for Two or more races residents20.1 34.6 51.1 Median age for White alone residents48.4 53.8 34.6 Median age for Hispanic or Latino residents34.2 36.5
Owner/renter occupied households by race in Summerlin South
House owners and renters - White residents 6,876 75.2% Owner occupied2,271 24.8% Renter occupiedHouse owners and renters - Black or African American residents 269 75.9% Owner occupied85 24.1% Renter occupiedHouse owners and renters - American Indian / Alaska Native residents 8 100.0% Owner occupiedHouse owners and renters - Asian residents 1,380 78.9% Owner occupied369 21.1% Renter occupiedHouse owners and renters - Native Hawaiian / Pacific Islander residents 41 39.1% Owner occupied64 60.9% Renter occupiedHouse owners and renters - Other race residents 102 35.5% Owner occupied185 64.5% Renter occupiedHouse owners and renters - Two or more races residents 845 74.2% Owner occupied294 25.8% Renter occupiedHouse owners and renters - White alone residents 7,059 76.2% Owner occupied2,201 23.8% Renter occupiedHouse owners and renters - Hispanic or Latino residents 608 51.4% Owner occupied575 48.6% Renter occupied
Language usage in Summerlin South
English speakers - Total 81.5% of residents of Summerlin South speak English at home.
7.0% of residents speak Spanish at home 1,675 82.6% Speak English very well352 17.4% Speak English less than very well11.2% of residents speak other language at home 2,533 77.8% Speak English very well722 22.2% Speak English less than very well
English speakers - Born in the United States 93.0% of residents of Summerlin South speak English at home.
4.6% of residents speak Spanish at home 719 89.0% Speak English very well89 11.0% Speak English less than very well2.3% of residents speak other language at home 352 86.9% Speak English very well53 13.1% Speak English less than very well
English speakers - Native, born elsewhere 76.0% of residents of Summerlin South speak English at home.
15.6% of residents speak Spanish at home 99 100.0% Speak English very well5.0% of residents speak other language at home 25 78.1% Speak English very well7 21.9% Speak English less than very well
English speakers - Foreign-born 31.0% of residents of Summerlin South speak English at home.
15.5% of residents speak Spanish at home 543 72.3% Speak English very well208 27.7% Speak English less than very well52.2% of residents speak other language at home 1,905 75.3% Speak English very well625 24.7% Speak English less than very well
White (Caucasian) - Speak only English Native:
99.2% (17,108)Foreign-born:
72.1% (740)
White (Caucasian) - Speak another language Native:
2.9% (494)Foreign-born:
41.9% (430)
Black or African American - Speak only English Native:
97.7% (701)Foreign-born:
55.9% (10)
Black or African American - Speak another language Native:
2.4% (17)Foreign-born:
40.9% (7)
Asian - Speak only English Native:
71.0% (1,099)Foreign-born:
26.1% (646)
Asian - Speak another language Native:
28.9% (447)Foreign-born:
74.3% (1,842)
Other race - Speak only English Native:
62.3% (405)Foreign-born:
3.4% (13)
Other race - Speak another language Native:
35.4% (230)Foreign-born:
96.7% (386)
Two or more races - Speak only English Native:
69.5% (1,893)Foreign-born:
17.7% (96)
Two or more races - Speak another language Native:
30.1% (819)Foreign-born:
81.4% (444)
White alone - Speak only English Native:
97.9% (16,732)Foreign-born:
56.0% (800)
White alone - Speak another language Native:
2.0% (344)Foreign-born:
43.3% (619)
Hispanic or Latino - Speak only English Native:
60.1% (1,736)Foreign-born:
4.7% (37)
Hispanic or Latino - Speak another language Native:
40.1% (1,158)Foreign-born:
95.1% (736)
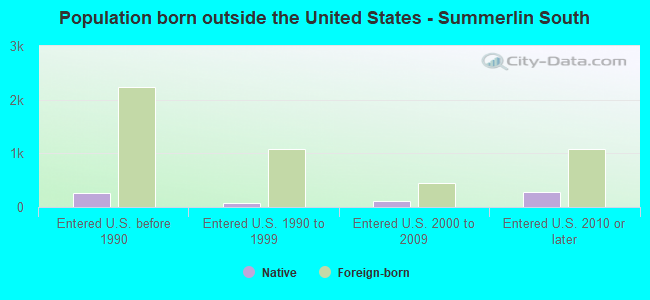
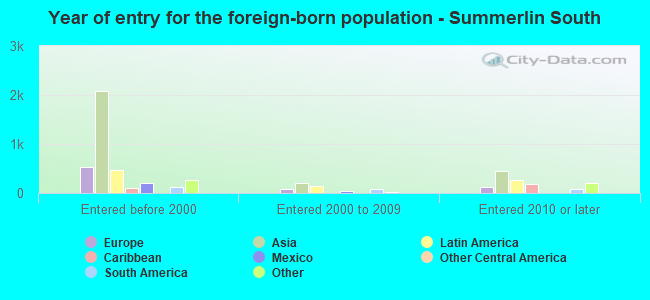
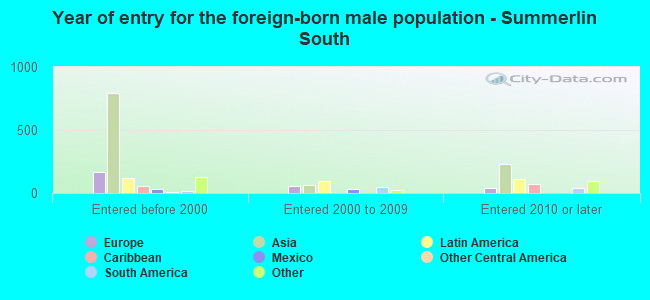
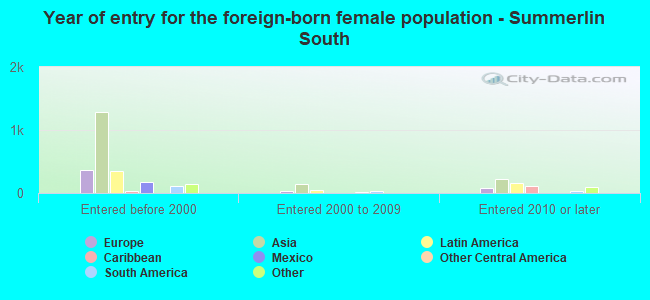
Foreign-born residents in Summerlin South 4,863 residents are foreign born (8.7% Asia , 2.9% Latin America , 2.7% Europe ).
This city:
16.0%Nevada:
19.1%
Marital status for residents in Summerlin South Marital status - White (Caucasian) population 15 years and over
Males 24.4% Never married58.2% Now married0.7% Separated3.8% Widowed12.9% DivorcedFemales 15.9% Never married53.8% Now married0.8% Separated12.3% Widowed17.2% DivorcedWomen who gave birth in the past 12 months Now married:
100.0% (282)Unmarried:
0.0% (0)
Women who did not give birth in the past 12 months Now married:
51.2% (1,486)Unmarried:
48.8% (1,416)
Marital status - Black or African American population 15 years and over
Males 36.8% Never married45.5% Now married0.0% Separated0.9% Widowed16.8% DivorcedFemales 35.3% Never married28.7% Now married0.0% Separated21.1% Widowed14.8% DivorcedWomen who did not give birth in the past 12 months Now married:
10.2% (9)Unmarried:
89.8% (81)
Marital status - American Indian / Alaska Native population 15 years and over
Males 0.0% Never married100.0% Now married0.0% Separated0.0% Widowed0.0% DivorcedFemales 100.0% Never married0.0% Now married0.0% Separated0.0% Widowed0.0% DivorcedWomen who did not give birth in the past 12 months Now married:
0.0% (0)Unmarried:
100.0% (40)
Marital status - Asian population 15 years and over
Males 37.5% Never married51.0% Now married0.6% Separated4.0% Widowed6.9% DivorcedFemales 23.5% Never married55.7% Now married0.0% Separated6.6% Widowed14.2% DivorcedWomen who gave birth in the past 12 months Now married:
100.0% (13)Unmarried:
0.0% (0)
Women who did not give birth in the past 12 months Now married:
46.6% (399)Unmarried:
53.4% (456)
Marital status - Native Hawaiian / Pacific Islander population 15 years and over
Males 75.5% Never married24.5% Now married0.0% Separated0.0% Widowed0.0% DivorcedFemales 97.3% Never married2.7% Now married0.0% Separated0.0% Widowed0.0% DivorcedWomen who did not give birth in the past 12 months Now married:
2.7% (2)Unmarried:
97.3% (77)
Marital status - Other race population 15 years and over
Males 46.1% Never married51.9% Now married0.0% Separated1.9% Widowed0.0% DivorcedFemales 19.5% Never married44.2% Now married0.0% Separated16.3% Widowed20.0% DivorcedWomen who did not give birth in the past 12 months Now married:
36.0% (117)Unmarried:
64.0% (207)
Marital status - Two or more races population 15 years and over
Males 41.7% Never married54.3% Now married0.0% Separated0.0% Widowed3.9% DivorcedFemales 29.4% Never married61.3% Now married0.0% Separated1.5% Widowed7.8% DivorcedWomen who gave birth in the past 12 months Now married:
100.0% (70)Unmarried:
0.0% (0)
Women who did not give birth in the past 12 months Now married:
54.0% (499)Unmarried:
46.0% (425)
Marital status - White alone, not Hispanic / Latino population 15 years and over
Males 24.0% Never married58.9% Now married0.7% Separated3.5% Widowed12.9% DivorcedFemales 14.6% Never married54.5% Now married0.9% Separated12.5% Widowed17.5% DivorcedWomen who gave birth in the past 12 months Now married:
100.0% (305)Unmarried:
0.0% (0)
Women who did not give birth in the past 12 months Now married:
53.5% (1,585)Unmarried:
46.5% (1,378)
Marital status - Hispanic or Latino population 15 years and over
Males 35.9% Never married51.6% Now married0.0% Separated5.3% Widowed7.3% DivorcedFemales 27.4% Never married47.8% Now married0.0% Separated11.6% Widowed13.3% DivorcedWomen who gave birth in the past 12 months Now married:
100.0% (61)Unmarried:
0.0% (0)
Women who did not give birth in the past 12 months Now married:
40.2% (399)Unmarried:
59.8% (594)
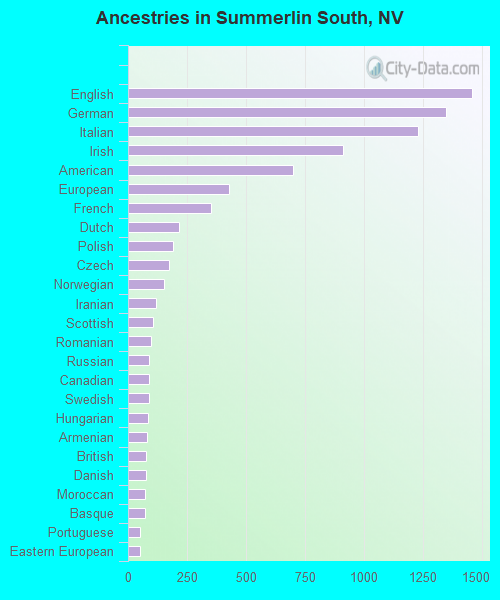
Ancestries in Summerlin South
1,458 9.4% English1,347 8.7% German1,230 7.9% Italian913 5.9% Irish700 4.5% American427 2.8% European351 2.3% French217 1.4% Dutch191 1.2% Polish174 1.1% Czech154 1.0% Norwegian117 0.8% Iranian108 0.7% Scottish97 0.6% Romanian90 0.6% Russian89 0.6% Canadian88 0.6% Swedish83 0.5% Hungarian82 0.5% Armenian78 0.5% British75 0.5% Danish72 0.5% Moroccan71 0.5% Basque52 0.3% Portuguese51 0.3% Eastern European48 0.3% Greek48 0.3% Scotch-Irish42 0.3% Lithuanian41 0.3% Ukrainian40 0.3% Belgian38 0.2% Bulgarian34 0.2% Israeli29 0.2% Egyptian29 0.2% Croatian23 0.1% Lebanese23 0.1% Swiss21 0.1% Austrian16 0.1% Australian13 0.08% Jamaican12 0.08% Scandinavian12 0.08% Slavic12 0.08% Yugoslavian11 0.07% Brazilian10 0.06% Serbian9 0.06% Welsh8 0.05% Slovene8 0.05% Turkish7 0.05% French Canadian7 0.05% African6 0.04% Czechoslovakian5 0.03% Slovak5 0.03% Ethiopian
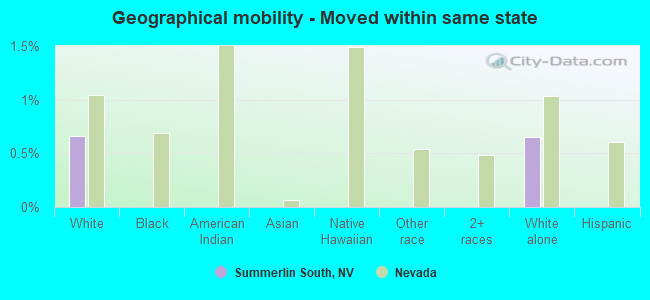
Geographical mobility in Summerlin South Same house 1 year ago 16,153 87.8% White (Caucasian)704 92.4% Black or African American60 100.0% American Indian / Alaska Native3,816 93.3% Asian126 46.2% Native Hawaiian / Pacific Islander970 86.0% Other race3,080 81.4% Two or more races16,464 87.1% White alone, not Hispanic / Latino3,440 87.5% Hispanic or LatinoMoved within same county 1,291 7.0% White / Caucasian32 4.2% Black or African American172 4.2% Asian21 7.6% Native Hawaiian / Pacific Islander101 8.9% Other race501 13.2% Two or more races1,381 7.3% White alone, not Hispanic / Latino415 10.6% Hispanic or LatinoMoved within same state 121 0.7% White / Caucasian124 0.7% White alone, not Hispanic / LatinoMoved from different state 712 3.9% White / Caucasian43 5.6% Black or African American66 1.6% Asian80 29.2% Native Hawaiian / Pacific Islander42 3.7% Other race158 4.2% Two or more races747 4.0% White alone, not Hispanic / Latino67 1.7% Hispanic or LatinoMoved from abroad 160 0.9% White67 1.6% Asian210 1.1% White alone, not Hispanic / Latino
Children Nativity (place of birth) in Summerlin South
Children under 6 years - Living with two parents Both parents native 1,027 100.0% NativeBoth parents foreign-born 13 100.0% NativeOne native, one foreign-born parent 296 98.3% Native5 1.7% Foreign-bornChildren under 6 years - Living with one parent Native parent 378 100.0% NativeChildren 6 to 17 years - Living with two parents Both parents native 1,569 99.8% Native3 0.2% Foreign-bornBoth parents foreign-born 121 50.2% Native120 49.8% Foreign-bornOne native, one foreign-born parent 578 100.0% NativeChildren 6 to 17 years - Living with one parent Native parent 771 100.0% NativeForeign-born parent 241 52.9% Native215 47.1% Foreign-born
Grandparents responsible for own grandchildren in Summerlin South
Grandparents (30 to 59 years) White / Caucasian 9 100.0% Responsible for grandchildrenAsian 18 100.0% Responsible for grandchildrenWhite alone, not Hispanic / Latino 15 100.0% Responsible for grandchildrenGrandparents (60 years and over) White / Caucasian 24 19.3% Responsible for grandchildren100 80.7% Not responsible for grandchildrenAsian 47 46.4% Responsible for grandchildren54 53.6% Not responsible for grandchildrenWhite alone, not Hispanic / Latino 29 20.6% Responsible for grandchildren112 79.4% Not responsible for grandchildren