Races in Sullivan, New York (NY) Detailed Stats
Ancestries, Foreign-born residents, place of birth

Recent posts about races in Sullivan, New York on our local forum with over 2,400,000 registered users:
 | smaller Upstate NY cities and towns/African American communities (5987 replies) |
| Sullivan County population growth leads state (38 replies) |
| Crane watch map (347 replies) |
| Native American culture in NY State (1089 replies) |
| Perfect Place to Buy an Affordable Lake House — and It's Just 2 Hours From NYC (3 replies) |
| For those interested in state political issues (426 replies) |
Latest news about races in Sullivan, NY collected exclusively by city-data.com from local newspapers, TV, and radio stations
2.6% of Sullivan, NY residents are foreign-born (1.5% born in Europe, 0.6% born in North America, 0.5% born in Asia), which is 758.9% less than the foreign-born rate of 22.0% across the entire state of New York.
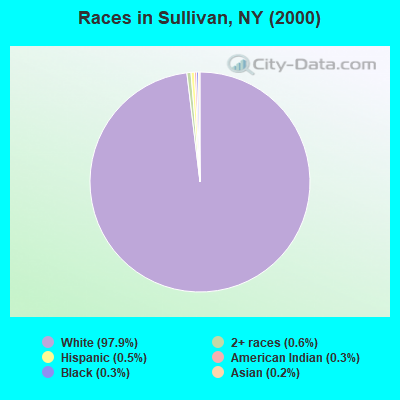
Race distribution in Sullivan

- 14,67797.9%White alone
- 970.6%Two or more races
- 810.5%Hispanic
- 450.3%Black alone
- 500.3%American Indian alone
- 340.2%Asian alone
- 70.05%Other race alone
2000
2022
-
- 11,760,98162.0%White alone
- 2,867,58315.1%Hispanic
- 2,812,62314.8%Black alone
- 1,035,9265.5%Asian alone
- 366,1161.9%Two or more races
- 75,4990.4%Other race alone
- 52,4990.3%American Indian alone
- 5,2300.03%Native Hawaiian and Other
Pacific Islander alone

-
- 10,408,93352.9%White alone
- 3,867,29919.7%Hispanic
- 2,633,84013.4%Black alone
- 1,776,2869.0%Asian alone
- 732,6703.7%Two or more races
- 216,1101.1%Other race alone
- 35,0820.2%American Indian alone
- 6,9310.04%Native Hawaiian and Other
Pacific Islander alone

Income and house value in Sullivan
- Median household income in 2022
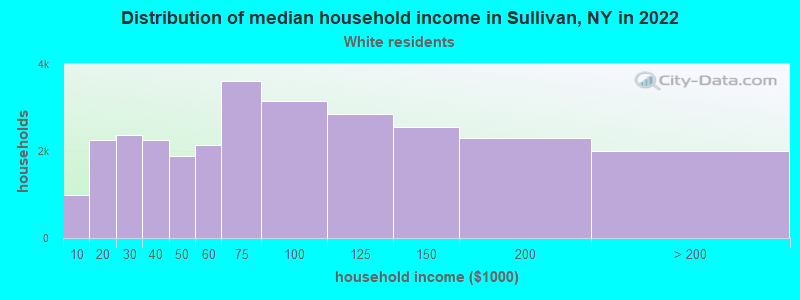
- $76,420White non-Hispanic householders
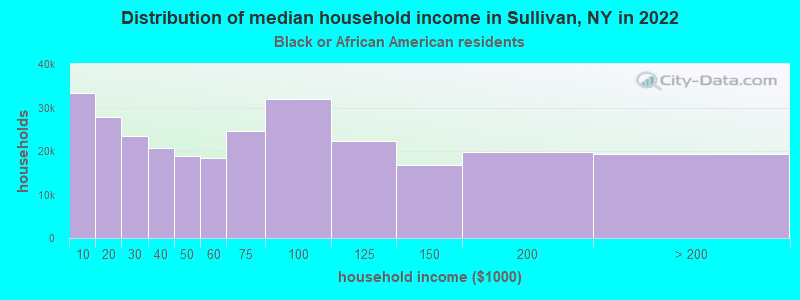
- $90,616Black householders
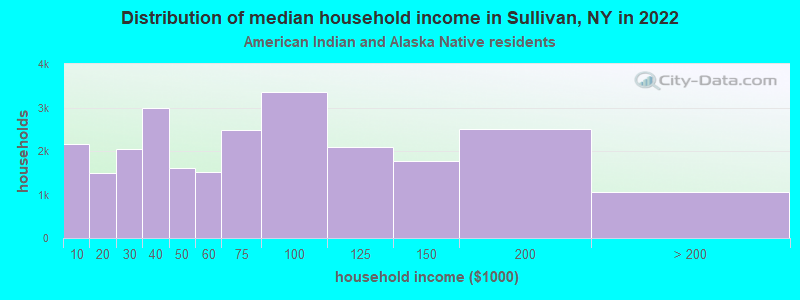
- $68,819American Indian and Alaska Native householders
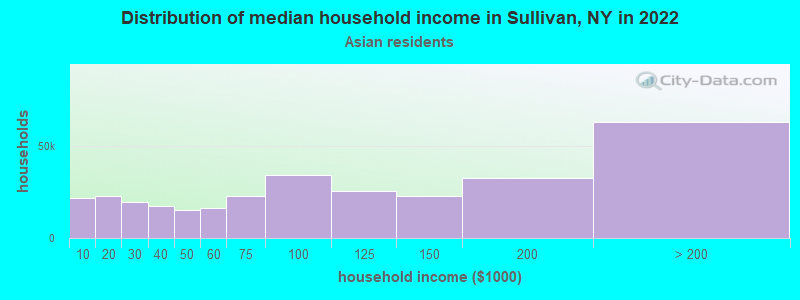
- $93,774Asian householders
- $150,150Some other race householders
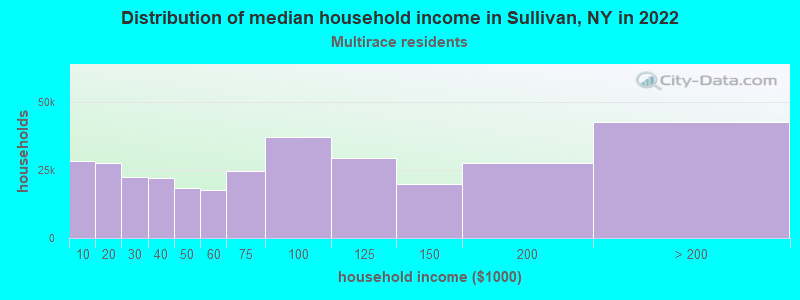
- $69,975Two or more races householders
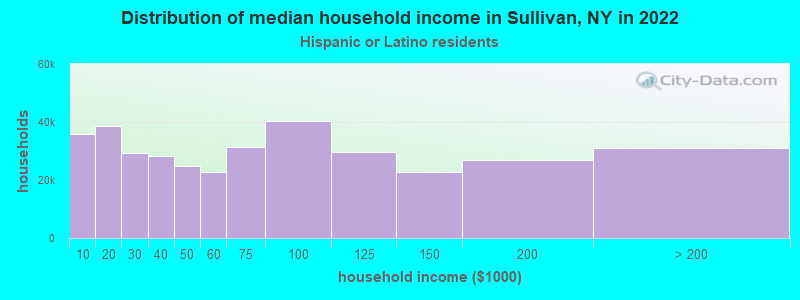
- $30,902Hispanic or Latino race householders
- Median 2022 house value
- $172,646White Non-Hispanic householders
- $114,542Asian householders
- $135,368Some other race householders
- $197,846Two or more races householders
- $135,368Hispanic or Latino householders
Household income for White non-Hispanic householders
Household income for Black householders
Household income for American Indian and Alaska Native householders
Household income for Asian householders
Household income for Two or more races householders
Household income for Hispanic or Latino race householders
Foreign-born residents in Sullivan
384 residents are foreign born (1.5% Europe, 0.6% North America, 0.5% Asia).
| This city: | 2.6% |
| New York: | 20.4% |
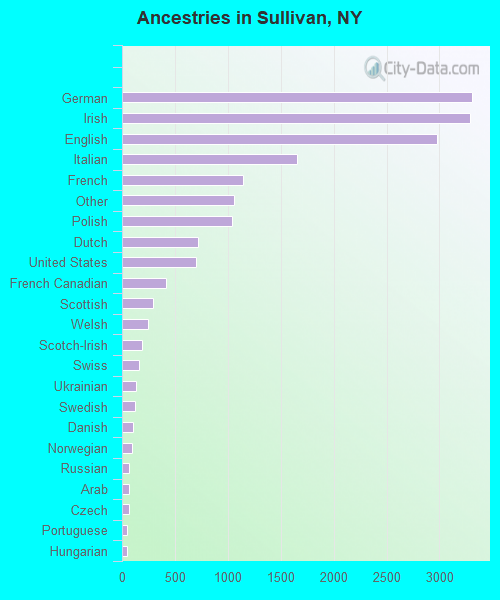
Ancestries in Sullivan

- 3,30318.4%German
- 3,29118.3%Irish
- 2,97916.6%English
- 1,6529.2%Italian
- 1,1436.4%French
- 1,0605.9%Other
- 1,0375.8%Polish
- 7214.0%Dutch
- 7023.9%United States
- 4152.3%French Canadian
- 2941.6%Scottish
- 2461.4%Welsh
- 1851.0%Scotch-Irish
- 1600.9%Swiss
- 1300.7%Ukrainian
- 1230.7%Swedish
- 1080.6%Danish
- 900.5%Norwegian
- 680.4%Russian
- 670.4%Arab
- 620.3%Czech
- 470.3%Portuguese
- 460.3%Hungarian
- 100.06%Greek
- 60.03%Slovak
- 50.03%Lithuanian
Zip codes: 13037.