Races in Sugar Land, Texas (TX) Detailed Stats
Data:
Races - White alone (%)
Races - White alone (% change since 2000)
Races - Black alone (%)
Races - Black alone (% change since 2000)
Races - American Indian alone (%)
Races - American Indian alone (% change since 2000)
Races - Asian alone (%)
Races - Asian alone (% change since 2000)
Races - Hispanic (%)
Races - Hispanic (% change since 2000)
Races - Native Hawaiian and Other Pacific Islander alone (%)
Races - Native Hawaiian and Other Pacific Islander alone (% change since 2000)
Races - Two or more races(%)
Races - Two or more races(% change since 2000)
Races - Other race alone (%)
Races - Other race alone (% change since 2000)
Racial diversity
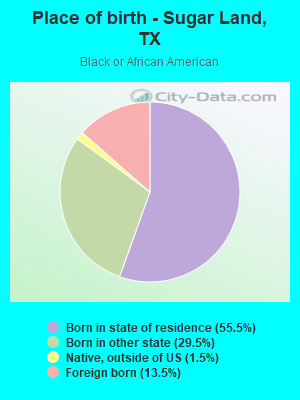
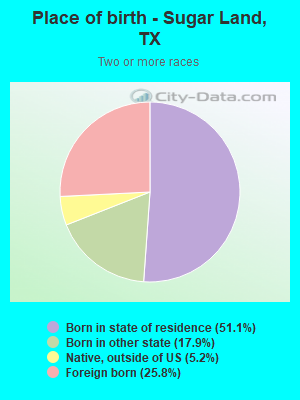
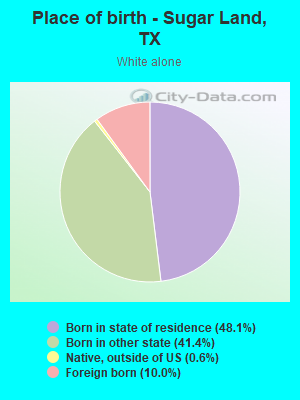
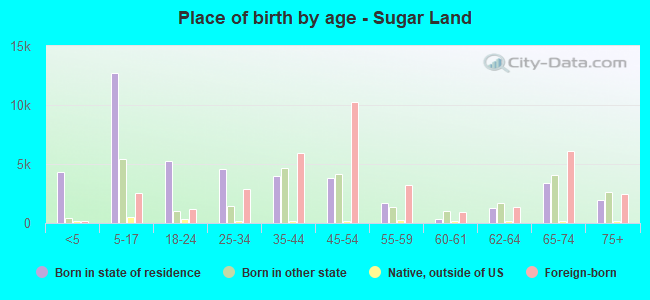
Place of birth - Born in state of residence (%)
Place of birth - Born in state of residence (%) - White
Place of birth - Born in state of residence (%) - Black or African American
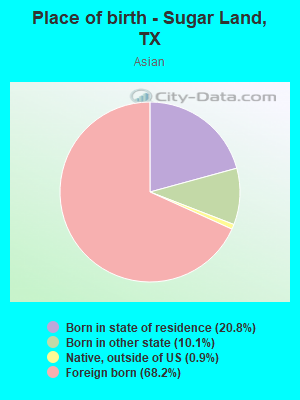
Place of birth - Born in state of residence (%) - Asian
Place of birth - Born in state of residence (%) - Hispanic or Latino
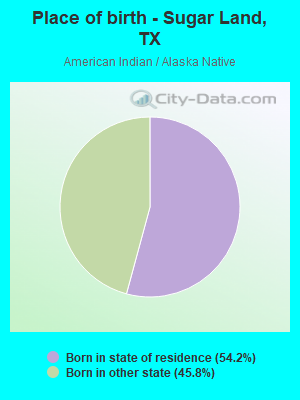
Place of birth - Born in state of residence (%) - American Indian and Alaska Native
Place of birth - Born in state of residence (%) - Multirace
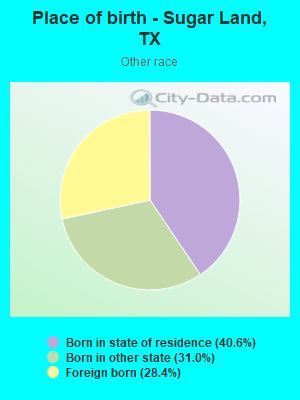
Place of birth - Born in state of residence (%) - Other Race
Place of birth - Born in other state (%)
Place of birth - Born in other state (%) - White
Place of birth - Born in other state (%) - Black or African American
Place of birth - Born in other state (%) - Asian
Place of birth - Born in other state (%) - Hispanic or Latino
Place of birth - Born in other state (%) - American Indian and Alaska Native
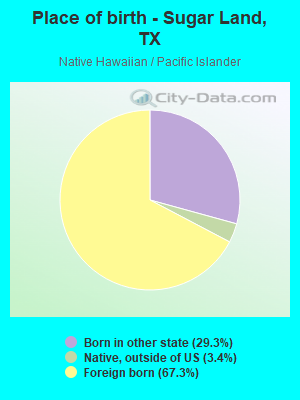
Place of birth - Born in other state (%) - Multirace
Place of birth - Born in other state (%) - Other Race
Place of birth - Native, outside of US (%)
Place of birth - Native, outside of US (%) - White
Place of birth - Native, outside of US (%) - Black or African American
Place of birth - Native, outside of US (%) - Asian
Place of birth - Native, outside of US (%) - Hispanic or Latino
Place of birth - Native, outside of US (%) - American Indian and Alaska Native
Place of birth - Native, outside of US (%) - Multirace
Place of birth - Native, outside of US (%) - Other Race
Place of birth - Foreign born (%)
Place of birth - Foreign born (%) - White
Place of birth - Foreign born (%) - Black or African American
Place of birth - Foreign born (%) - Asian
Place of birth - Foreign born (%) - Hispanic or Latino
Place of birth - Foreign born (%) - American Indian and Alaska Native
Place of birth - Foreign born (%) - Multirace
Place of birth - Foreign born (%) - Other Race
Residents speaking English at home (%)
Residents speaking English at home - Born in the United States (%)
Residents speaking English at home - Native, born elsewhere (%)
Residents speaking English at home - Foreign born (%)
Residents speaking Spanish at home (%)
Residents speaking Spanish at home - Born in the United States (%)
Residents speaking Spanish at home - Native, born elsewhere (%)
Residents speaking Spanish at home - Foreign born (%)
Residents speaking other language at home (%)
Residents speaking other language at home - Born in the United States (%)
Residents speaking other language at home - Native, born elsewhere (%)
Residents speaking other language at home - Foreign born (%)
Marital status - Never married (%)
Marital status - Now married (%)
Marital status - Separated (%)
Marital status - Widowed (%)
Marital status - Divorced (%)
Ancestries Reported - Arab (%)
Ancestries Reported - Czech (%)
Ancestries Reported - Danish (%)
Ancestries Reported - Dutch (%)
Ancestries Reported - English (%)
Ancestries Reported - French (%)
Ancestries Reported - French Canadian (%)
Ancestries Reported - German (%)
Ancestries Reported - Greek (%)
Ancestries Reported - Hungarian (%)
Ancestries Reported - Irish (%)
Ancestries Reported - Italian (%)
Ancestries Reported - Lithuanian (%)
Ancestries Reported - Norwegian (%)
Ancestries Reported - Polish (%)
Ancestries Reported - Portuguese (%)
Ancestries Reported - Russian (%)
Ancestries Reported - Scotch-Irish (%)
Ancestries Reported - Scottish (%)
Ancestries Reported - Slovak (%)
Ancestries Reported - Subsaharan African (%)
Ancestries Reported - Swedish (%)
Ancestries Reported - Swiss (%)
Ancestries Reported - Ukrainian (%)
Ancestries Reported - United States (%)
Ancestries Reported - Welsh (%)
Ancestries Reported - West Indian (%)
Ancestries Reported - Other (%)
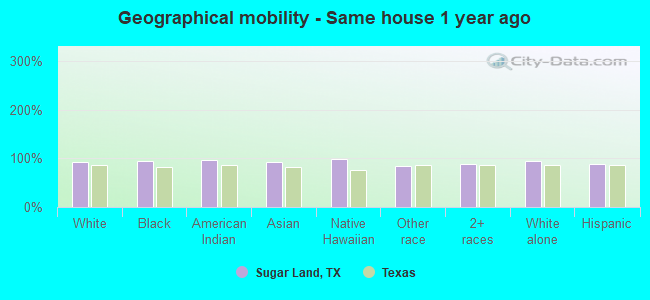
Geographical mobility - Same house 1 year ago (%)
Geographical mobility - Same house 1 year ago (%) - White
Geographical mobility - Same house 1 year ago (%) - Black or African American
Geographical mobility - Same house 1 year ago (%) - Asian
Geographical mobility - Same house 1 year ago (%) - Hispanic or Latino
Geographical mobility - Same house 1 year ago (%) - American Indian and Alaska Native
Geographical mobility - Same house 1 year ago (%) - Multirace
Geographical mobility - Same house 1 year ago (%) - Other Race
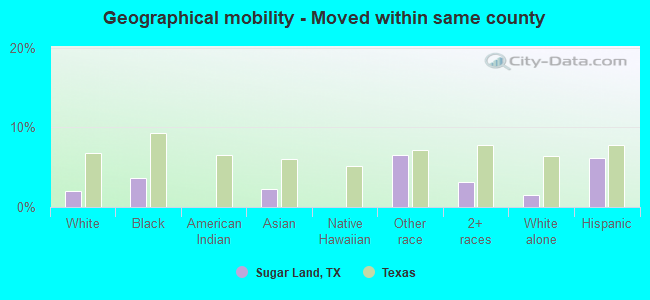
Geographical mobility - Moved within same county (%)
Geographical mobility - Moved within same county (%) - White
Geographical mobility - Moved within same county (%) - Black or African American
Geographical mobility - Moved within same county (%) - Asian
Geographical mobility - Moved within same county (%) - Hispanic or Latino
Geographical mobility - Moved within same county (%) - American Indian and Alaska Native
Geographical mobility - Moved within same county (%) - Multirace
Geographical mobility - Moved within same county (%) - Other Race
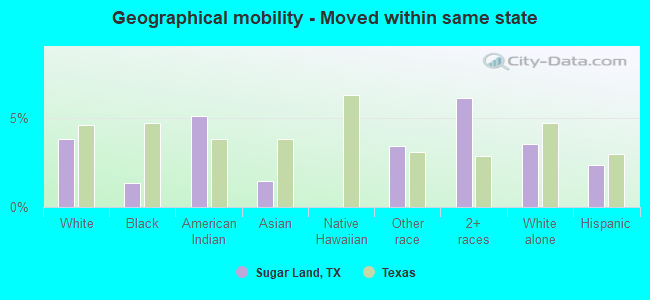
Geographical mobility - Moved from different county within same state (%)
Geographical mobility - Moved from different county within same state (%) - White
Geographical mobility - Moved from different county within same state (%) - Black or African American
Geographical mobility - Moved from different county within same state (%) - Asian
Geographical mobility - Moved from different county within same state (%) - Hispanic or Latino
Geographical mobility - Moved from different county within same state (%) - American Indian and Alaska Native
Geographical mobility - Moved from different county within same state (%) - Multirace
Geographical mobility - Moved from different county within same state (%) - Other Race
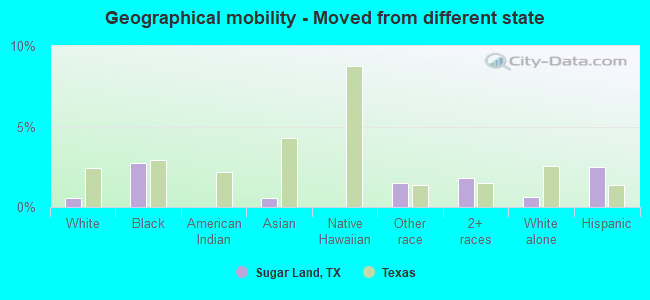
Geographical mobility - Moved from different state (%)
Geographical mobility - Moved from different state (%) - White
Geographical mobility - Moved from different state (%) - Black or African American
Geographical mobility - Moved from different state (%) - Asian
Geographical mobility - Moved from different state (%) - Hispanic or Latino
Geographical mobility - Moved from different state (%) - American Indian and Alaska Native
Geographical mobility - Moved from different state (%) - Multirace
Geographical mobility - Moved from different state (%) - Other Race
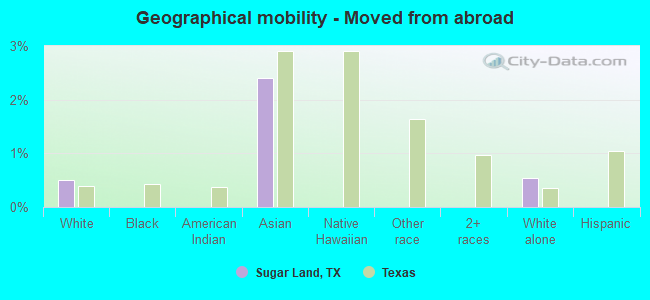
Geographical mobility - Moved from abroad (%)
Geographical mobility - Moved from abroad (%) - White
Geographical mobility - Moved from abroad (%) - Black or African American
Geographical mobility - Moved from abroad (%) - Asian
Geographical mobility - Moved from abroad (%) - Hispanic or Latino
Geographical mobility - Moved from abroad (%) - American Indian and Alaska Native
Geographical mobility - Moved from abroad (%) - Multirace
Geographical mobility - Moved from abroad (%) - Other Race
Place of birth for the foreign-born population - Ireland (%)
Place of birth for the foreign-born population - Denmark (%)
Place of birth for the foreign-born population - Norway (%)
Place of birth for the foreign-born population - Sweden (%)
Place of birth for the foreign-born population - United Kingdom (%)
Place of birth for the foreign-born population - England (%)
Place of birth for the foreign-born population - Scotland (%)
Place of birth for the foreign-born population - Other Northern Europe (%)
Place of birth for the foreign-born population - Austria (%)
Place of birth for the foreign-born population - Belgium (%)
Place of birth for the foreign-born population - France (%)
Place of birth for the foreign-born population - Germany (%)
Place of birth for the foreign-born population - Netherlands (%)
Place of birth for the foreign-born population - Switzerland (%)
Place of birth for the foreign-born population - Other Western Europe (%)
Place of birth for the foreign-born population - Greece (%)
Place of birth for the foreign-born population - Italy (%)
Place of birth for the foreign-born population - Portugal (%)
Place of birth for the foreign-born population - Spain (%)
Place of birth for the foreign-born population - Other Southern Europe (%)
Place of birth for the foreign-born population - Albania (%)
Place of birth for the foreign-born population - Belarus (%)
Place of birth for the foreign-born population - Bosnia and Herzegovina (%)
Place of birth for the foreign-born population - Bulgaria (%)
Place of birth for the foreign-born population - Croatia (%)
Place of birth for the foreign-born population - Czechoslovakia (%)
Place of birth for the foreign-born population - Hungary (%)
Place of birth for the foreign-born population - Latvia (%)
Place of birth for the foreign-born population - Lithuania (%)
Place of birth for the foreign-born population - North Macedonia (Macedonia) (%)
Place of birth for the foreign-born population - Moldova (%)
Place of birth for the foreign-born population - Poland (%)
Place of birth for the foreign-born population - Romania (%)
Place of birth for the foreign-born population - Russia (%)
Place of birth for the foreign-born population - Serbia (%)
Place of birth for the foreign-born population - Ukraine (%)
Place of birth for the foreign-born population - Other Eastern Europe (%)
Place of birth for the foreign-born population - China (%)
Place of birth for the foreign-born population - Hong Kong (%)
Place of birth for the foreign-born population - Taiwan (%)
Place of birth for the foreign-born population - Japan (%)
Place of birth for the foreign-born population - Korea (%)
Place of birth for the foreign-born population - Other Eastern Asia (%)
Place of birth for the foreign-born population - Afghanistan (%)
Place of birth for the foreign-born population - Bangladesh (%)
Place of birth for the foreign-born population - India (%)
Place of birth for the foreign-born population - Iran (%)
Place of birth for the foreign-born population - Kazakhstan (%)
Place of birth for the foreign-born population - Nepal (%)
Place of birth for the foreign-born population - Pakistan (%)
Place of birth for the foreign-born population - Sri Lanka (%)
Place of birth for the foreign-born population - Uzbekistan (%)
Place of birth for the foreign-born population - Other South Central Asia (%)
Place of birth for the foreign-born population - Burma (%)
Place of birth for the foreign-born population - Cambodia (%)
Place of birth for the foreign-born population - Indonesia (%)
Place of birth for the foreign-born population - Laos (%)
Place of birth for the foreign-born population - Malaysia (%)
Place of birth for the foreign-born population - Philippines (%)
Place of birth for the foreign-born population - Singapore (%)
Place of birth for the foreign-born population - Thailand (%)
Place of birth for the foreign-born population - Vietnam (%)
Place of birth for the foreign-born population - Other South Eastern Asia (%)
Place of birth for the foreign-born population - Armenia (%)
Place of birth for the foreign-born population - Iraq (%)
Place of birth for the foreign-born population - Israel (%)
Place of birth for the foreign-born population - Jordan (%)
Place of birth for the foreign-born population - Kuwait (%)
Place of birth for the foreign-born population - Lebanon (%)
Place of birth for the foreign-born population - Saudi Arabia (%)
Place of birth for the foreign-born population - Syria (%)
Place of birth for the foreign-born population - Turkey (%)
Place of birth for the foreign-born population - Yemen (%)
Place of birth for the foreign-born population - Other Western Asia (%)
Place of birth for the foreign-born population - Eritrea (%)
Place of birth for the foreign-born population - Ethiopia (%)
Place of birth for the foreign-born population - Kenya (%)
Place of birth for the foreign-born population - Somalia (%)
Place of birth for the foreign-born population - Uganda (%)
Place of birth for the foreign-born population - Zimbabwe (%)
Place of birth for the foreign-born population - Other Eastern Africa (%)
Place of birth for the foreign-born population - Cameroon (%)
Place of birth for the foreign-born population - Congo (%)
Place of birth for the foreign-born population - Democratic Republic of Congo (Zaire) (%)
Place of birth for the foreign-born population - Other Middle Africa (%)
Place of birth for the foreign-born population - Egypt (%)
Place of birth for the foreign-born population - Morocco (%)
Place of birth for the foreign-born population - Sudan (%)
Place of birth for the foreign-born population - Other Northern Africa (%)
Place of birth for the foreign-born population - South Africa (%)
Place of birth for the foreign-born population - Other Southern Africa (%)
Place of birth for the foreign-born population - Cabo Verde (%)
Place of birth for the foreign-born population - Ghana (%)
Place of birth for the foreign-born population - Liberia (%)
Place of birth for the foreign-born population - Nigeria (%)
Place of birth for the foreign-born population - Senegal (%)
Place of birth for the foreign-born population - Sierra Leone (%)
Place of birth for the foreign-born population - Other Western Africa (%)
Place of birth for the foreign-born population - Australia (%)
Place of birth for the foreign-born population - New Zealand (%)
Place of birth for the foreign-born population - Fiji (%)
Place of birth for the foreign-born population - Micronesia (%)
Place of birth for the foreign-born population - Bahamas (%)
Place of birth for the foreign-born population - Barbados (%)
Place of birth for the foreign-born population - Cuba (%)
Place of birth for the foreign-born population - Dominica (%)
Place of birth for the foreign-born population - Dominican Republic (%)
Place of birth for the foreign-born population - Grenada (%)
Place of birth for the foreign-born population - Haiti (%)
Place of birth for the foreign-born population - Jamaica (%)
Place of birth for the foreign-born population - St. Vincent and the Grenadines (%)
Place of birth for the foreign-born population - Trinidad and Tobago (%)
Place of birth for the foreign-born population - West Indies (%)
Place of birth for the foreign-born population - Other Caribbean (%)
Place of birth for the foreign-born population - Belize (%)
Place of birth for the foreign-born population - Costa Rica (%)
Place of birth for the foreign-born population - El Salvador (%)
Place of birth for the foreign-born population - Guatemala (%)
Place of birth for the foreign-born population - Honduras (%)
Place of birth for the foreign-born population - Mexico (%)
Place of birth for the foreign-born population - Nicaragua (%)
Place of birth for the foreign-born population - Panama (%)
Place of birth for the foreign-born population - Other Central America (%)
Place of birth for the foreign-born population - Argentina (%)
Place of birth for the foreign-born population - Bolivia (%)
Place of birth for the foreign-born population - Brazil (%)
Place of birth for the foreign-born population - Chile (%)
Place of birth for the foreign-born population - Colombia (%)
Place of birth for the foreign-born population - Ecuador (%)
Place of birth for the foreign-born population - Guyana (%)
Place of birth for the foreign-born population - Peru (%)
Place of birth for the foreign-born population - Uruguay (%)
Place of birth for the foreign-born population - Venezuela (%)
Place of birth for the foreign-born population - Other South America (%)
Place of birth for the foreign-born population - Canada (%)
Place of birth for the foreign-born population - Other Northern America (%)
Place of birth for the foreign-born population - Other (%)
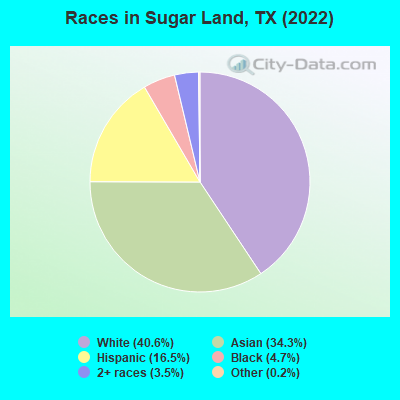
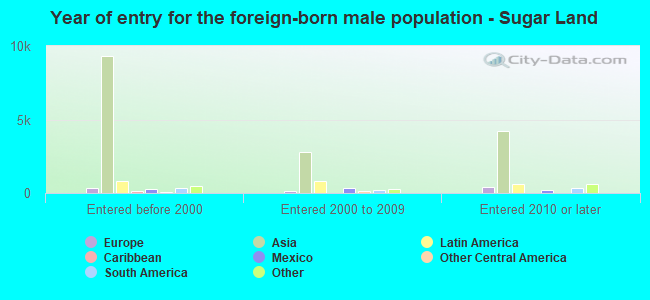
According to 2022 data, the most numerous races in Sugar Land, TX are Hispanic (18,095 residents), White alone (44,386 residents), and Black alone (5,190 residents). 58.3% of Sugar Land residents speak English at home. 34.2% of Sugar Land, TX residents are foreign-born (27.2% born in Asia, 3.7% born in Latin America), which is 50.3% greater than the foreign-born rate of 17.0% across the entire state of Texas.
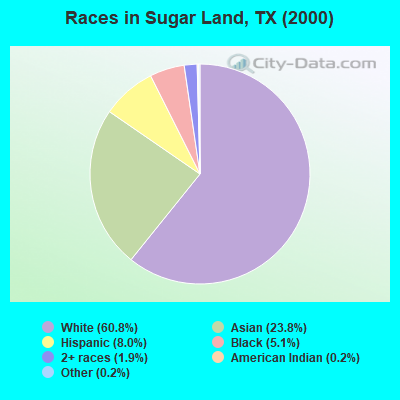
Race distribution in Sugar Land
2000 2022
38,526 60.8% White alone 15,042 23.8% Asian alone 5,053 8.0% Hispanic 3,242 5.1% Black alone 1,226 1.9% Two or more races 109 0.2% Other race alone 112 0.2% American Indian alone 18 0.03% Native Hawaiian and Other
44,386 40.6% White alone 37,535 34.3% Asian alone 18,095 16.5% Hispanic 5,190 4.7% Black alone 3,840 3.5% Two or more races 247 0.2% Other race alone 102 0.09% American Indian alone
2000 2022
10,933,313 52.4% White alone 6,669,666 32.0% Hispanic 2,364,255 11.3% Black alone 554,445 2.7% Asian alone 230,567 1.1% Two or more races 68,859 0.3% American Indian alone 19,958 0.10% Other race alone 10,757 0.05% Native Hawaiian and Other
12,070,642 40.2% Hispanic 11,683,430 38.9% White alone 3,508,706 11.7% Black alone 1,608,173 5.4% Asian alone 956,560 3.2% Two or more races 125,763 0.4% Other race alone 47,023 0.2% American Indian alone 29,275 0.10% Native Hawaiian and Other
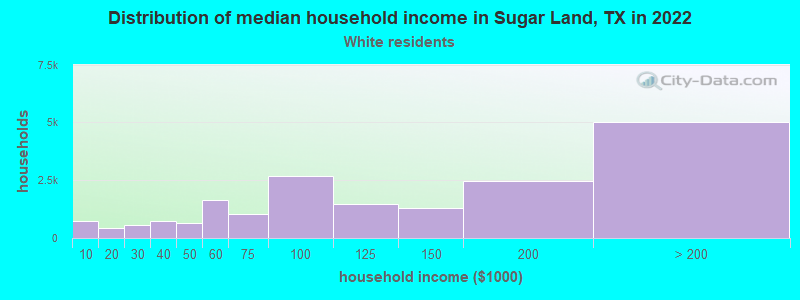
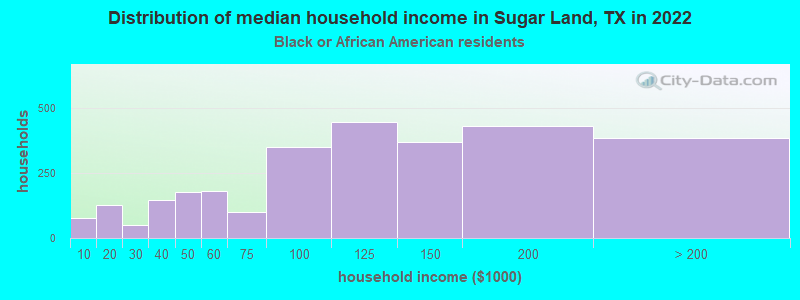
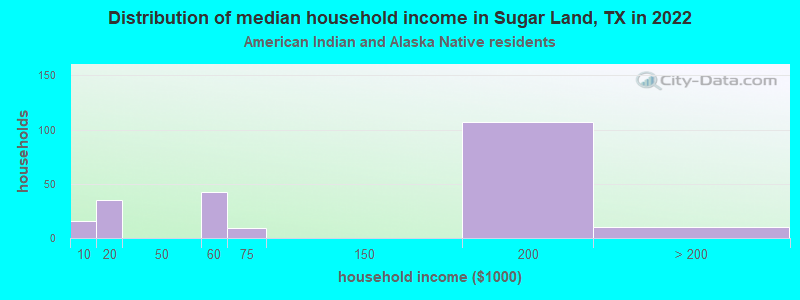
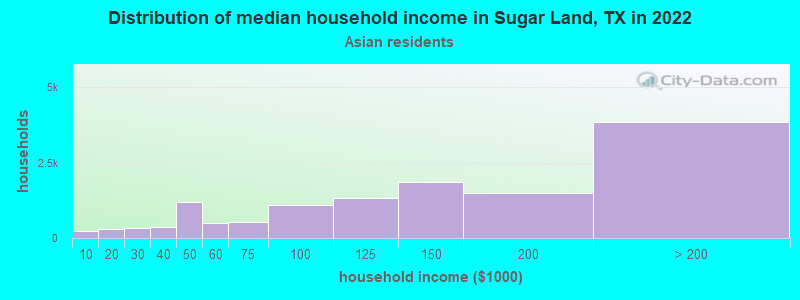
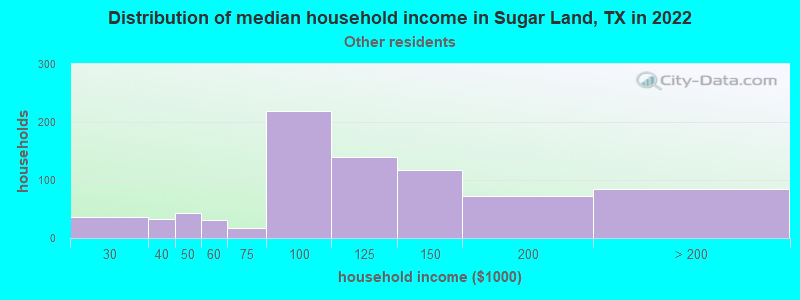
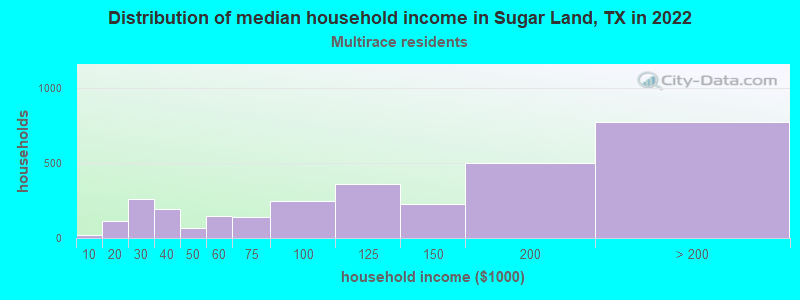
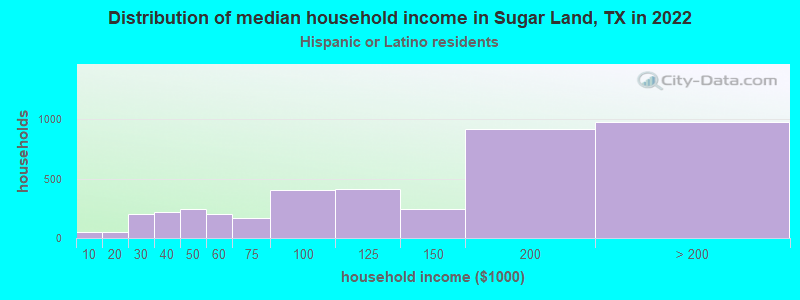
Income and house value in Sugar Land Median household income in 2022 $120,762 White non-Hispanic householders$135,303 Black householders$136,165 Asian householders$112,886 Some other race householders$161,905 Two or more races householders$133,667 Hispanic or Latino race householdersMedian 2022 house value $397,448 White Non-Hispanic householders$378,857 Black or African American householders$321,325 American Indian or Alaska Native householders $427,596 Asian householders$223,847 Some other race householders$384,384 Two or more races householders$250,729 Hispanic or Latino householders
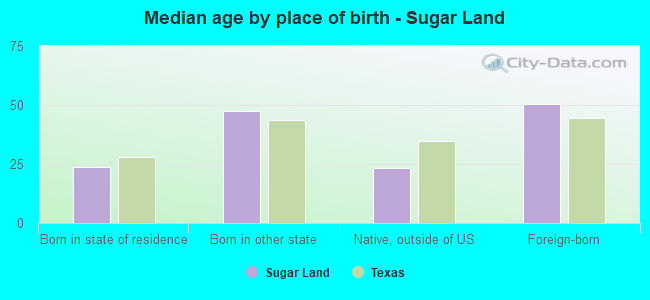
Median age by race in Sugar Land
47.0 Median age for White residents45.9 47.3 42.3 Median age for Black or African American residents39.9 42.7 -666,666,666.0 Median age for American Indian / Alaska Native residents-666,666,666.0 -666,666,666.0 43.5 Median age for Asian residents43.5 43.6 -666,666,666.0 Median age for Native Hawaiian / Pacific Islander residents-666,666,666.0 -666,666,666.0 44.3 Median age for Other race residents41.8 44.3 33.1 Median age for Two or more races residents22.7 37.4 47.2 Median age for White alone residents46.9 47.5 37.4 Median age for Hispanic or Latino residents23.2 39.3
Owner/renter occupied households by race in Sugar Land
House owners and renters - White residents 15,910 84.7% Owner occupied2,882 15.3% Renter occupiedHouse owners and renters - Black or African American residents 2,090 73.8% Owner occupied744 26.2% Renter occupiedHouse owners and renters - American Indian / Alaska Native residents 162 86.3% Owner occupied26 13.7% Renter occupiedHouse owners and renters - Asian residents 10,872 83.5% Owner occupied2,153 16.5% Renter occupiedHouse owners and renters - Native Hawaiian / Pacific Islander residents 8 19.2% Owner occupied33 80.8% Renter occupiedHouse owners and renters - Other race residents 633 77.9% Owner occupied180 22.1% Renter occupiedHouse owners and renters - Two or more races residents 3,340 70.3% Owner occupied1,408 29.7% Renter occupiedHouse owners and renters - White alone residents 15,309 85.8% Owner occupied2,538 14.2% Renter occupiedHouse owners and renters - Hispanic or Latino residents 3,769 69.6% Owner occupied1,645 30.4% Renter occupied
Language usage in Sugar Land
English speakers - Total 58.3% of residents of Sugar Land speak English at home.
8.3% of residents speak Spanish at home 7,012 80.3% Speak English very well1,717 19.7% Speak English less than very well33.3% of residents speak other language at home 24,278 69.6% Speak English very well10,599 30.4% Speak English less than very well
English speakers - Born in the United States 85.6% of residents of Sugar Land speak English at home.
6.9% of residents speak Spanish at home 1,619 85.7% Speak English very well271 14.3% Speak English less than very well7.5% of residents speak other language at home 1,842 89.9% Speak English very well207 10.1% Speak English less than very well
English speakers - Native, born elsewhere 62.4% of residents of Sugar Land speak English at home.
16.0% of residents speak Spanish at home 238 100.0% Speak English very well21.6% of residents speak other language at home 259 80.7% Speak English very well62 19.3% Speak English less than very well
English speakers - Foreign-born 17.4% of residents of Sugar Land speak English at home.
10.2% of residents speak Spanish at home 2,606 69.2% Speak English very well1,160 30.8% Speak English less than very well72.4% of residents speak other language at home 17,021 63.9% Speak English very well9,621 36.1% Speak English less than very well
White (Caucasian) - Speak only English Native:
96.2% (38,682)Foreign-born:
31.8% (1,638)
White (Caucasian) - Speak another language Native:
3.8% (1,528)Foreign-born:
68.2% (3,521)
Black or African American - Speak only English Native:
98.3% (6,787)Foreign-born:
58.4% (663)
Black or African American - Speak another language Native:
2.0% (140)Foreign-born:
41.8% (475)
Asian - Speak only English Native:
43.9% (5,025)Foreign-born:
12.3% (3,210)
Asian - Speak another language Native:
56.1% (6,434)Foreign-born:
87.7% (22,936)
Native Hawaiian / Pacific Islander - Speak only English Native:
98.9% (6)Foreign-born:
33.7% (31)
Other race - Speak only English Native:
49.3% (938)Foreign-born:
12.3% (146)
Other race - Speak another language Native:
47.6% (904)Foreign-born:
83.6% (993)
Two or more races - Speak only English Native:
62.0% (6,210)Foreign-born:
23.4% (961)
Two or more races - Speak another language Native:
38.0% (3,810)Foreign-born:
76.6% (3,151)
White alone - Speak only English Native:
97.7% (37,264)Foreign-born:
35.2% (1,564)
White alone - Speak another language Native:
2.3% (863)Foreign-born:
64.8% (2,874)
Hispanic or Latino - Speak only English Native:
53.6% (6,171)Foreign-born:
21.8% (1,044)
Hispanic or Latino - Speak another language Native:
46.4% (5,344)Foreign-born:
78.2% (3,741)
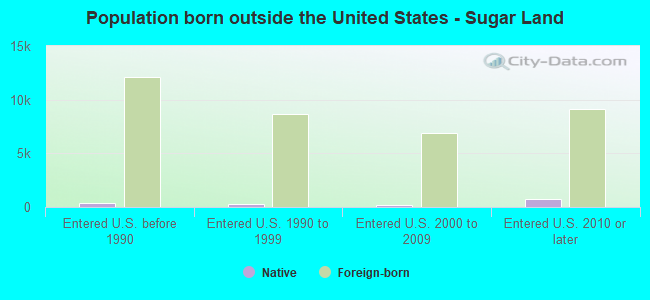
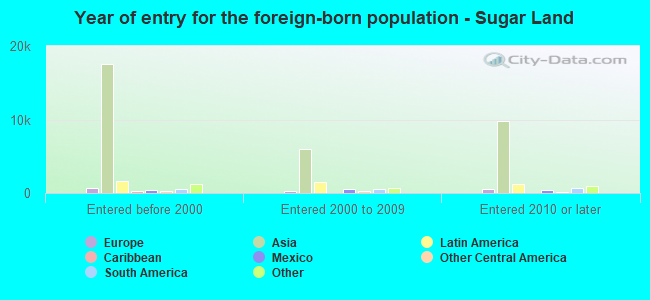
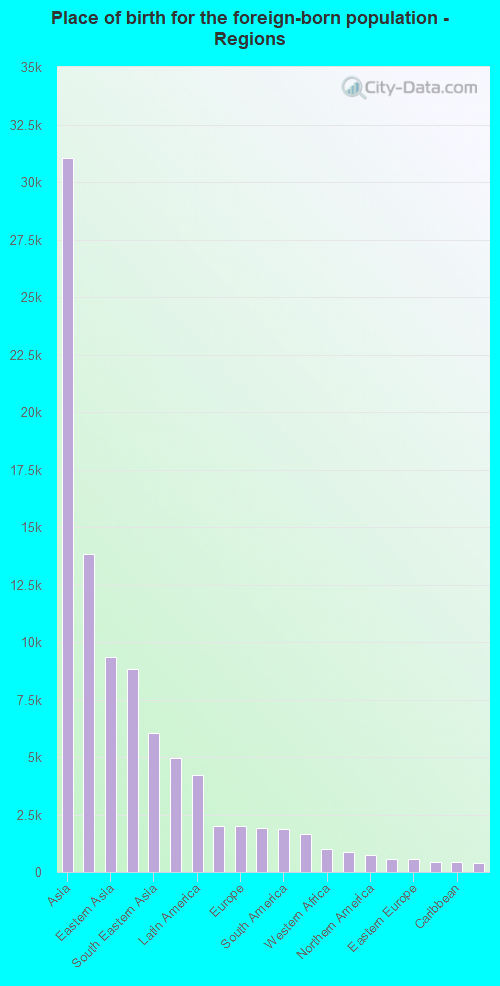
Foreign-born residents in Sugar Land 40,199 residents are foreign born (27.2% Asia , 3.7% Latin America ).
This city:
34.2%Texas:
17.1%
Marital status for residents in Sugar Land Marital status - White (Caucasian) population 15 years and over
Males 22.7% Never married71.5% Now married0.2% Separated1.6% Widowed3.9% DivorcedFemales 19.6% Never married61.3% Now married1.1% Separated7.0% Widowed11.0% DivorcedWomen who gave birth in the past 12 months Now married:
89.1% (366)Unmarried:
10.9% (45)
Women who did not give birth in the past 12 months Now married:
55.3% (4,714)Unmarried:
44.7% (3,811)
Marital status - Black or African American population 15 years and over
Males 42.9% Never married47.7% Now married3.4% Separated0.0% Widowed5.9% DivorcedFemales 24.8% Never married47.1% Now married4.0% Separated0.5% Widowed23.6% DivorcedWomen who gave birth in the past 12 months Now married:
100.0% (74)Unmarried:
0.0% (0)
Women who did not give birth in the past 12 months Now married:
32.9% (753)Unmarried:
67.1% (1,538)
Marital status - American Indian / Alaska Native population 15 years and over
Males 14.1% Never married76.5% Now married0.0% Separated0.0% Widowed9.4% DivorcedFemales 47.4% Never married52.6% Now married0.0% Separated0.0% Widowed0.0% DivorcedWomen who did not give birth in the past 12 months Now married:
44.9% (32)Unmarried:
55.1% (39)
Marital status - Asian population 15 years and over
Males 26.9% Never married70.6% Now married0.3% Separated0.0% Widowed2.2% DivorcedFemales 17.0% Never married70.1% Now married2.4% Separated5.2% Widowed5.3% DivorcedWomen who gave birth in the past 12 months Now married:
100.0% (39)Unmarried:
0.0% (0)
Women who did not give birth in the past 12 months Now married:
67.0% (6,424)Unmarried:
33.0% (3,161)
Marital status - Native Hawaiian / Pacific Islander population 15 years and over
Males 0.0% Never married100.0% Now married0.0% Separated0.0% Widowed0.0% DivorcedFemales 46.6% Never married53.4% Now married0.0% Separated0.0% Widowed0.0% DivorcedWomen who did not give birth in the past 12 months Now married:
49.1% (32)Unmarried:
50.9% (33)
Marital status - Other race population 15 years and over
Males 60.4% Never married35.5% Now married0.9% Separated0.0% Widowed3.3% DivorcedFemales 20.7% Never married53.3% Now married3.1% Separated1.9% Widowed21.0% DivorcedWomen who did not give birth in the past 12 months Now married:
68.5% (727)Unmarried:
31.5% (335)
Marital status - Two or more races population 15 years and over
Males 40.2% Never married54.1% Now married4.1% Separated0.0% Widowed1.6% DivorcedFemales 32.8% Never married57.2% Now married0.0% Separated4.3% Widowed5.7% DivorcedWomen who gave birth in the past 12 months Now married:
100.0% (72)Unmarried:
0.0% (0)
Women who did not give birth in the past 12 months Now married:
41.9% (1,496)Unmarried:
58.1% (2,078)
Marital status - White alone, not Hispanic / Latino population 15 years and over
Males 22.3% Never married71.7% Now married0.2% Separated1.7% Widowed4.1% DivorcedFemales 19.2% Never married61.4% Now married0.5% Separated7.5% Widowed11.4% DivorcedWomen who gave birth in the past 12 months Now married:
89.1% (366)Unmarried:
10.9% (45)
Women who did not give birth in the past 12 months Now married:
53.6% (4,305)Unmarried:
46.4% (3,726)
Marital status - Hispanic or Latino population 15 years and over
Males 42.0% Never married56.2% Now married0.3% Separated0.0% Widowed1.5% DivorcedFemales 28.5% Never married54.1% Now married4.9% Separated2.7% Widowed9.8% DivorcedWomen who gave birth in the past 12 months Now married:
78.8% (134)Unmarried:
21.2% (36)
Women who did not give birth in the past 12 months Now married:
57.6% (2,724)Unmarried:
42.4% (2,009)
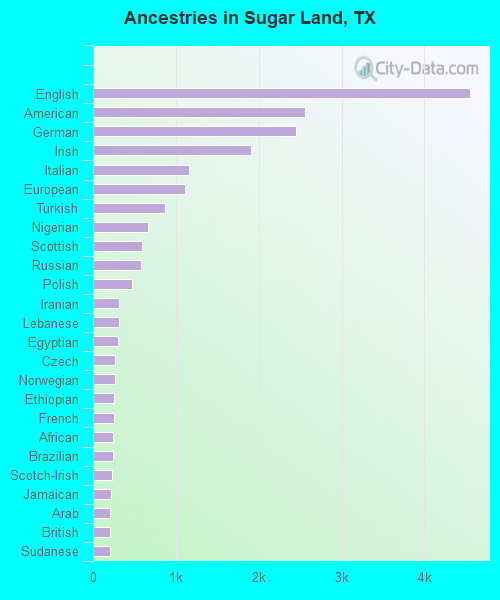
Ancestries in Sugar Land
4,551 6.7% English2,555 3.8% American2,444 3.6% German1,908 2.8% Irish1,158 1.7% Italian1,112 1.6% European869 1.3% Turkish666 1.0% Nigerian597 0.9% Scottish576 0.8% Russian470 0.7% Polish318 0.5% Iranian313 0.5% Lebanese298 0.4% Egyptian269 0.4% Czech260 0.4% Norwegian258 0.4% Ethiopian252 0.4% French247 0.4% African237 0.3% Brazilian224 0.3% Scotch-Irish220 0.3% Jamaican207 0.3% Arab202 0.3% British202 0.3% Sudanese197 0.3% Canadian193 0.3% Swedish192 0.3% French Canadian181 0.3% Greek173 0.3% Welsh125 0.2% Jordanian122 0.2% Czechoslovakian120 0.2% Dutch108 0.2% Portuguese104 0.2% Eastern European100 0.1% Danish82 0.1% Armenian63 0.09% Zimbabwean57 0.08% Scandinavian47 0.07% Ghanaian47 0.07% Haitian43 0.06% Swiss40 0.06% Austrian38 0.06% Cajun36 0.05% Romanian33 0.05% Croatian33 0.05% Belgian24 0.04% Slovak23 0.03% Northern European22 0.03% German Russian21 0.03% Hungarian19 0.03% Lithuanian19 0.03% Ukrainian17 0.03% Palestinian16 0.02% Finnish16 0.02% Trinidadian and Tobagonian11 0.02% Australian8 0.01% Somali
Geographical mobility in Sugar Land Same house 1 year ago 43,701 93.0% White (Caucasian)7,615 93.7% Black or African American291 96.6% American Indian / Alaska Native43,079 93.1% Asian135 98.2% Native Hawaiian / Pacific Islander2,595 84.7% Other race12,334 88.2% Two or more races41,268 93.8% White alone, not Hispanic / Latino16,116 89.1% Hispanic or LatinoMoved within same county 960 2.0% White / Caucasian297 3.7% Black or African American1,058 2.3% Asian201 6.6% Other race438 3.1% Two or more races649 1.5% White alone, not Hispanic / Latino1,110 6.1% Hispanic or LatinoMoved within same state 1,796 3.8% White / Caucasian108 1.3% Black or African American15 5.1% American Indian / Alaska Native676 1.5% Asian105 3.4% Other race854 6.1% Two or more races1,560 3.5% White alone, not Hispanic / Latino422 2.3% Hispanic or LatinoMoved from different state 272 0.6% White / Caucasian224 2.8% Black or African American270 0.6% Asian46 1.5% Other race256 1.8% Two or more races272 0.6% White alone, not Hispanic / Latino447 2.5% Hispanic or LatinoMoved from abroad 238 0.5% White1,117 2.4% Asian238 0.5% White alone, not Hispanic / Latino
Children Nativity (place of birth) in Sugar Land
Children under 6 years - Living with two parents Both parents native 3,082 100.0% NativeBoth parents foreign-born 1,078 95.1% Native56 4.9% Foreign-bornOne native, one foreign-born parent 995 100.0% NativeChildren under 6 years - Living with one parent Native parent 447 100.0% NativeChildren 6 to 17 years - Living with two parents Both parents native 5,484 98.6% Native77 1.4% Foreign-bornBoth parents foreign-born 5,661 70.8% Native2,336 29.2% Foreign-bornOne native, one foreign-born parent 3,117 100.0% NativeChildren 6 to 17 years - Living with one parent Native parent 2,264 100.0% NativeForeign-born parent 747 52.1% Native687 47.9% Foreign-born
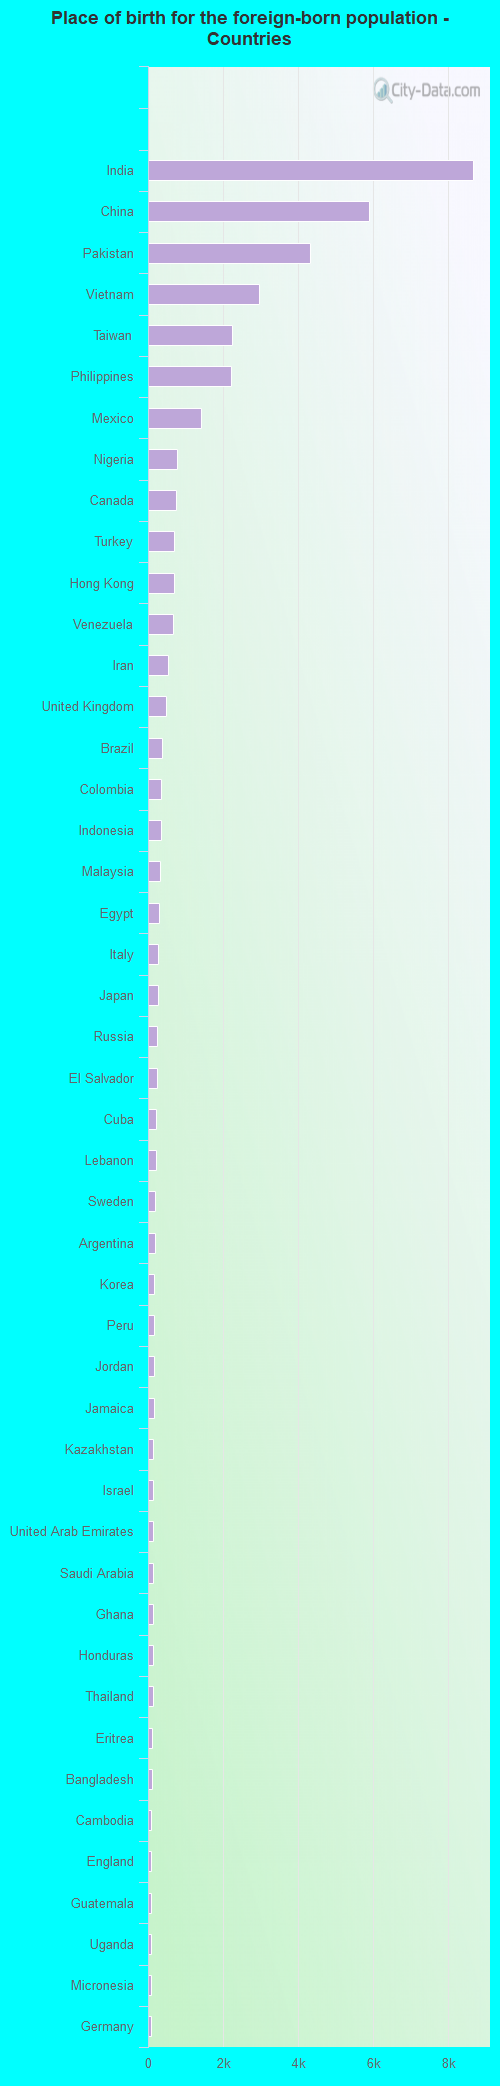
Place of birth for residents in Sugar Land 31,047 Asia13,833 South Central Asia9,362 Eastern Asia8,825 China6,057 South Eastern Asia4,958 Americas4,201 Latin America2,021 Africa2,015 Europe1,908 Central America1,864 South America1,663 Western Asia1,019 Western Africa868 Northern Europe757 Northern America566 Northern Africa549 Eastern Europe433 Southern Europe428 Caribbean397 Eastern Africa164 Western Europe155 Oceania59 Australia and New Zealand Subregion11 Middle Africa8,647 India5,897 China4,306 Pakistan2,963 Vietnam2,240 Taiwan2,198 Philippines1,409 Mexico766 Nigeria757 Canada702 Turkey687 Hong Kong665 Venezuela532 Iran472 United Kingdom362 Brazil341 Colombia334 Indonesia324 Malaysia302 Egypt279 Italy276 Japan246 Russia240 El Salvador220 Cuba215 Lebanon198 Sweden186 Argentina172 Korea152 Peru152 Jordan151 Jamaica138 Kazakhstan133 Israel129 United Arab Emirates128 Saudi Arabia124 Ghana122 Honduras121 Thailand113 Eritrea99 Bangladesh90 Cambodia88 England88 Guatemala81 Uganda80 Micronesia80 Germany77 Poland72 Sierra Leone66 Greece62 Sri Lanka61 Kenya58 Chile56 Ukraine50 Australia48 Iraq48 Portugal45 Denmark45 Zimbabwe44 Armenia43 Ecuador39 Ethiopia38 Spain36 Sudan34 Syria32 France31 Liberia31 Latvia30 Norway27 Afghanistan27 Grenada27 Romania27 Trinidad and Tobago25 Bolivia25 Kuwait24 Singapore24 Senegal23 Tanzania21 Croatia21 Morocco20 Costa Rica18 Nepal17 Hungary16 Belgium15 Fiji14 Somalia14 Nicaragua14 Austria14 Scotland14 Yemen13 Azerbaijan13 Panama11 Switzerland11 Uruguay9 Netherlands8 New Zealand8 Ireland7 Algeria3 Bulgaria
Grandparents responsible for own grandchildren in Sugar Land
Grandparents (30 to 59 years) White / Caucasian 57 60.7% Responsible for grandchildren37 39.3% Not responsible for grandchildrenBlack or African American 61 100.0% Responsible for grandchildrenAsian 19 51.8% Responsible for grandchildren18 48.2% Not responsible for grandchildrenTwo or more races 5 100.0% Not responsible for grandchildrenWhite alone, not Hispanic / Latino 15 42.3% Responsible for grandchildren20 57.7% Not responsible for grandchildrenHispanic or Latino 62 62.6% Responsible for grandchildren37 37.4% Not responsible for grandchildrenGrandparents (60 years and over) White / Caucasian 78 12.9% Responsible for grandchildren522 87.1% Not responsible for grandchildrenBlack or African American 7 8.8% Responsible for grandchildren75 91.2% Not responsible for grandchildrenAsian 193 11.3% Responsible for grandchildren1,520 88.7% Not responsible for grandchildrenTwo or more races 8 100.0% Not responsible for grandchildrenWhite alone, not Hispanic / Latino 111 16.1% Responsible for grandchildren575 83.9% Not responsible for grandchildrenHispanic or Latino 33 100.0% Not responsible for grandchildren