Races in Sugar Camp, Wisconsin (WI) Detailed Stats
Ancestries, Foreign-born residents, place of birth

Discuss Sugar Camp, Wisconsin races on our local forum with over 2,400,000 registered users
1.3% of Sugar Camp, WI residents are foreign-born , which is 287.2% less than the foreign-born rate of 5.0% across the entire state of Wisconsin.
Race distribution in Sugar Camp

- 1,75598.5%White alone
- 100.6%American Indian alone
- 70.4%Hispanic
- 50.3%Asian alone
- 40.2%Two or more races

2000
2022
-
- 4,681,63087.3%White alone
- 300,2455.6%Black alone
- 192,9213.6%Hispanic
- 87,9951.6%Asian alone
- 51,9211.0%Two or more races
- 43,9800.8%American Indian alone
- 3,6370.07%Other race alone
- 1,3460.03%Native Hawaiian and Other
Pacific Islander alone

-
- 4,654,03179.0%White alone
- 447,0227.6%Hispanic
- 345,6785.9%Black alone
- 217,5323.7%Two or more races
- 172,2422.9%Asian alone
- 33,7620.6%American Indian alone
- 19,6800.3%Other race alone
- 2,5920.04%Native Hawaiian and Other
Pacific Islander alone

Income and house value in Sugar Camp
- Median household income in 2022
- $63,135White non-Hispanic householders
- $53,533American Indian and Alaska Native householders
- $145,303Asian householders
- Median 2022 house value
- $253,156White Non-Hispanic householders
- $147,447American Indian or Alaska Native householders
Household income for White non-Hispanic householders

Household income for American Indian and Alaska Native householders

Household income for Asian householders

Foreign-born residents in Sugar Camp
23 residents are foreign born
| This city: | 1.3% |
| Wisconsin: | 3.6% |
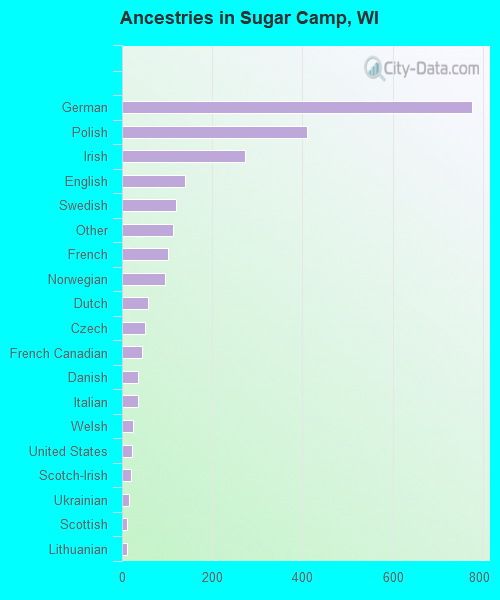
Ancestries in Sugar Camp

- 77532.7%German
- 41017.3%Polish
- 27311.5%Irish
- 1395.9%English
- 1205.1%Swedish
- 1144.8%Other
- 1014.3%French
- 954.0%Norwegian
- 582.4%Dutch
- 522.2%Czech
- 451.9%French Canadian
- 361.5%Danish
- 351.5%Italian
- 241.0%Welsh
- 220.9%United States
- 200.8%Scotch-Irish
- 160.7%Ukrainian
- 110.5%Scottish
- 100.4%Lithuanian
- 50.2%Greek
- 40.2%Hungarian
- 20.08%Russian
- 10.04%Swiss
Zip codes: 54501.