Races in Stroudsburg, Pennsylvania (PA) Detailed Stats
Data:
Races - White alone (%)
Races - White alone (% change since 2000)
Races - Black alone (%)
Races - Black alone (% change since 2000)
Races - American Indian alone (%)
Races - American Indian alone (% change since 2000)
Races - Asian alone (%)
Races - Asian alone (% change since 2000)
Races - Hispanic (%)
Races - Hispanic (% change since 2000)
Races - Native Hawaiian and Other Pacific Islander alone (%)
Races - Native Hawaiian and Other Pacific Islander alone (% change since 2000)
Races - Two or more races(%)
Races - Two or more races(% change since 2000)
Races - Other race alone (%)
Races - Other race alone (% change since 2000)
Racial diversity
Place of birth - Born in state of residence (%)
Place of birth - Born in state of residence (%) - White
Place of birth - Born in state of residence (%) - Black or African American
Place of birth - Born in state of residence (%) - Asian
Place of birth - Born in state of residence (%) - Hispanic or Latino
Place of birth - Born in state of residence (%) - American Indian and Alaska Native
Place of birth - Born in state of residence (%) - Multirace
Place of birth - Born in state of residence (%) - Other Race
Place of birth - Born in other state (%)
Place of birth - Born in other state (%) - White
Place of birth - Born in other state (%) - Black or African American
Place of birth - Born in other state (%) - Asian
Place of birth - Born in other state (%) - Hispanic or Latino
Place of birth - Born in other state (%) - American Indian and Alaska Native
Place of birth - Born in other state (%) - Multirace
Place of birth - Born in other state (%) - Other Race
Place of birth - Native, outside of US (%)
Place of birth - Native, outside of US (%) - White
Place of birth - Native, outside of US (%) - Black or African American
Place of birth - Native, outside of US (%) - Asian
Place of birth - Native, outside of US (%) - Hispanic or Latino
Place of birth - Native, outside of US (%) - American Indian and Alaska Native
Place of birth - Native, outside of US (%) - Multirace
Place of birth - Native, outside of US (%) - Other Race
Place of birth - Foreign born (%)
Place of birth - Foreign born (%) - White
Place of birth - Foreign born (%) - Black or African American
Place of birth - Foreign born (%) - Asian
Place of birth - Foreign born (%) - Hispanic or Latino
Place of birth - Foreign born (%) - American Indian and Alaska Native
Place of birth - Foreign born (%) - Multirace
Place of birth - Foreign born (%) - Other Race
Residents speaking English at home (%)
Residents speaking English at home - Born in the United States (%)
Residents speaking English at home - Native, born elsewhere (%)
Residents speaking English at home - Foreign born (%)
Residents speaking Spanish at home (%)
Residents speaking Spanish at home - Born in the United States (%)
Residents speaking Spanish at home - Native, born elsewhere (%)
Residents speaking Spanish at home - Foreign born (%)
Residents speaking other language at home (%)
Residents speaking other language at home - Born in the United States (%)
Residents speaking other language at home - Native, born elsewhere (%)
Residents speaking other language at home - Foreign born (%)
Marital status - Never married (%)
Marital status - Now married (%)
Marital status - Separated (%)
Marital status - Widowed (%)
Marital status - Divorced (%)
Ancestries Reported - Arab (%)
Ancestries Reported - Czech (%)
Ancestries Reported - Danish (%)
Ancestries Reported - Dutch (%)
Ancestries Reported - English (%)
Ancestries Reported - French (%)
Ancestries Reported - French Canadian (%)
Ancestries Reported - German (%)
Ancestries Reported - Greek (%)
Ancestries Reported - Hungarian (%)
Ancestries Reported - Irish (%)
Ancestries Reported - Italian (%)
Ancestries Reported - Lithuanian (%)
Ancestries Reported - Norwegian (%)
Ancestries Reported - Polish (%)
Ancestries Reported - Portuguese (%)
Ancestries Reported - Russian (%)
Ancestries Reported - Scotch-Irish (%)
Ancestries Reported - Scottish (%)
Ancestries Reported - Slovak (%)
Ancestries Reported - Subsaharan African (%)
Ancestries Reported - Swedish (%)
Ancestries Reported - Swiss (%)
Ancestries Reported - Ukrainian (%)
Ancestries Reported - United States (%)
Ancestries Reported - Welsh (%)
Ancestries Reported - West Indian (%)
Ancestries Reported - Other (%)
Geographical mobility - Same house 1 year ago (%)
Geographical mobility - Same house 1 year ago (%) - White
Geographical mobility - Same house 1 year ago (%) - Black or African American
Geographical mobility - Same house 1 year ago (%) - Asian
Geographical mobility - Same house 1 year ago (%) - Hispanic or Latino
Geographical mobility - Same house 1 year ago (%) - American Indian and Alaska Native
Geographical mobility - Same house 1 year ago (%) - Multirace
Geographical mobility - Same house 1 year ago (%) - Other Race
Geographical mobility - Moved within same county (%)
Geographical mobility - Moved within same county (%) - White
Geographical mobility - Moved within same county (%) - Black or African American
Geographical mobility - Moved within same county (%) - Asian
Geographical mobility - Moved within same county (%) - Hispanic or Latino
Geographical mobility - Moved within same county (%) - American Indian and Alaska Native
Geographical mobility - Moved within same county (%) - Multirace
Geographical mobility - Moved within same county (%) - Other Race
Geographical mobility - Moved from different county within same state (%)
Geographical mobility - Moved from different county within same state (%) - White
Geographical mobility - Moved from different county within same state (%) - Black or African American
Geographical mobility - Moved from different county within same state (%) - Asian
Geographical mobility - Moved from different county within same state (%) - Hispanic or Latino
Geographical mobility - Moved from different county within same state (%) - American Indian and Alaska Native
Geographical mobility - Moved from different county within same state (%) - Multirace
Geographical mobility - Moved from different county within same state (%) - Other Race
Geographical mobility - Moved from different state (%)
Geographical mobility - Moved from different state (%) - White
Geographical mobility - Moved from different state (%) - Black or African American
Geographical mobility - Moved from different state (%) - Asian
Geographical mobility - Moved from different state (%) - Hispanic or Latino
Geographical mobility - Moved from different state (%) - American Indian and Alaska Native
Geographical mobility - Moved from different state (%) - Multirace
Geographical mobility - Moved from different state (%) - Other Race
Geographical mobility - Moved from abroad (%)
Geographical mobility - Moved from abroad (%) - White
Geographical mobility - Moved from abroad (%) - Black or African American
Geographical mobility - Moved from abroad (%) - Asian
Geographical mobility - Moved from abroad (%) - Hispanic or Latino
Geographical mobility - Moved from abroad (%) - American Indian and Alaska Native
Geographical mobility - Moved from abroad (%) - Multirace
Geographical mobility - Moved from abroad (%) - Other Race
Place of birth for the foreign-born population - Ireland (%)
Place of birth for the foreign-born population - Denmark (%)
Place of birth for the foreign-born population - Norway (%)
Place of birth for the foreign-born population - Sweden (%)
Place of birth for the foreign-born population - United Kingdom (%)
Place of birth for the foreign-born population - England (%)
Place of birth for the foreign-born population - Scotland (%)
Place of birth for the foreign-born population - Other Northern Europe (%)
Place of birth for the foreign-born population - Austria (%)
Place of birth for the foreign-born population - Belgium (%)
Place of birth for the foreign-born population - France (%)
Place of birth for the foreign-born population - Germany (%)
Place of birth for the foreign-born population - Netherlands (%)
Place of birth for the foreign-born population - Switzerland (%)
Place of birth for the foreign-born population - Other Western Europe (%)
Place of birth for the foreign-born population - Greece (%)
Place of birth for the foreign-born population - Italy (%)
Place of birth for the foreign-born population - Portugal (%)
Place of birth for the foreign-born population - Spain (%)
Place of birth for the foreign-born population - Other Southern Europe (%)
Place of birth for the foreign-born population - Albania (%)
Place of birth for the foreign-born population - Belarus (%)
Place of birth for the foreign-born population - Bosnia and Herzegovina (%)
Place of birth for the foreign-born population - Bulgaria (%)
Place of birth for the foreign-born population - Croatia (%)
Place of birth for the foreign-born population - Czechoslovakia (%)
Place of birth for the foreign-born population - Hungary (%)
Place of birth for the foreign-born population - Latvia (%)
Place of birth for the foreign-born population - Lithuania (%)
Place of birth for the foreign-born population - North Macedonia (Macedonia) (%)
Place of birth for the foreign-born population - Moldova (%)
Place of birth for the foreign-born population - Poland (%)
Place of birth for the foreign-born population - Romania (%)
Place of birth for the foreign-born population - Russia (%)
Place of birth for the foreign-born population - Serbia (%)
Place of birth for the foreign-born population - Ukraine (%)
Place of birth for the foreign-born population - Other Eastern Europe (%)
Place of birth for the foreign-born population - China (%)
Place of birth for the foreign-born population - Hong Kong (%)
Place of birth for the foreign-born population - Taiwan (%)
Place of birth for the foreign-born population - Japan (%)
Place of birth for the foreign-born population - Korea (%)
Place of birth for the foreign-born population - Other Eastern Asia (%)
Place of birth for the foreign-born population - Afghanistan (%)
Place of birth for the foreign-born population - Bangladesh (%)
Place of birth for the foreign-born population - India (%)
Place of birth for the foreign-born population - Iran (%)
Place of birth for the foreign-born population - Kazakhstan (%)
Place of birth for the foreign-born population - Nepal (%)
Place of birth for the foreign-born population - Pakistan (%)
Place of birth for the foreign-born population - Sri Lanka (%)
Place of birth for the foreign-born population - Uzbekistan (%)
Place of birth for the foreign-born population - Other South Central Asia (%)
Place of birth for the foreign-born population - Burma (%)
Place of birth for the foreign-born population - Cambodia (%)
Place of birth for the foreign-born population - Indonesia (%)
Place of birth for the foreign-born population - Laos (%)
Place of birth for the foreign-born population - Malaysia (%)
Place of birth for the foreign-born population - Philippines (%)
Place of birth for the foreign-born population - Singapore (%)
Place of birth for the foreign-born population - Thailand (%)
Place of birth for the foreign-born population - Vietnam (%)
Place of birth for the foreign-born population - Other South Eastern Asia (%)
Place of birth for the foreign-born population - Armenia (%)
Place of birth for the foreign-born population - Iraq (%)
Place of birth for the foreign-born population - Israel (%)
Place of birth for the foreign-born population - Jordan (%)
Place of birth for the foreign-born population - Kuwait (%)
Place of birth for the foreign-born population - Lebanon (%)
Place of birth for the foreign-born population - Saudi Arabia (%)
Place of birth for the foreign-born population - Syria (%)
Place of birth for the foreign-born population - Turkey (%)
Place of birth for the foreign-born population - Yemen (%)
Place of birth for the foreign-born population - Other Western Asia (%)
Place of birth for the foreign-born population - Eritrea (%)
Place of birth for the foreign-born population - Ethiopia (%)
Place of birth for the foreign-born population - Kenya (%)
Place of birth for the foreign-born population - Somalia (%)
Place of birth for the foreign-born population - Uganda (%)
Place of birth for the foreign-born population - Zimbabwe (%)
Place of birth for the foreign-born population - Other Eastern Africa (%)
Place of birth for the foreign-born population - Cameroon (%)
Place of birth for the foreign-born population - Congo (%)
Place of birth for the foreign-born population - Democratic Republic of Congo (Zaire) (%)
Place of birth for the foreign-born population - Other Middle Africa (%)
Place of birth for the foreign-born population - Egypt (%)
Place of birth for the foreign-born population - Morocco (%)
Place of birth for the foreign-born population - Sudan (%)
Place of birth for the foreign-born population - Other Northern Africa (%)
Place of birth for the foreign-born population - South Africa (%)
Place of birth for the foreign-born population - Other Southern Africa (%)
Place of birth for the foreign-born population - Cabo Verde (%)
Place of birth for the foreign-born population - Ghana (%)
Place of birth for the foreign-born population - Liberia (%)
Place of birth for the foreign-born population - Nigeria (%)
Place of birth for the foreign-born population - Senegal (%)
Place of birth for the foreign-born population - Sierra Leone (%)
Place of birth for the foreign-born population - Other Western Africa (%)
Place of birth for the foreign-born population - Australia (%)
Place of birth for the foreign-born population - New Zealand (%)
Place of birth for the foreign-born population - Fiji (%)
Place of birth for the foreign-born population - Micronesia (%)
Place of birth for the foreign-born population - Bahamas (%)
Place of birth for the foreign-born population - Barbados (%)
Place of birth for the foreign-born population - Cuba (%)
Place of birth for the foreign-born population - Dominica (%)
Place of birth for the foreign-born population - Dominican Republic (%)
Place of birth for the foreign-born population - Grenada (%)
Place of birth for the foreign-born population - Haiti (%)
Place of birth for the foreign-born population - Jamaica (%)
Place of birth for the foreign-born population - St. Vincent and the Grenadines (%)
Place of birth for the foreign-born population - Trinidad and Tobago (%)
Place of birth for the foreign-born population - West Indies (%)
Place of birth for the foreign-born population - Other Caribbean (%)
Place of birth for the foreign-born population - Belize (%)
Place of birth for the foreign-born population - Costa Rica (%)
Place of birth for the foreign-born population - El Salvador (%)
Place of birth for the foreign-born population - Guatemala (%)
Place of birth for the foreign-born population - Honduras (%)
Place of birth for the foreign-born population - Mexico (%)
Place of birth for the foreign-born population - Nicaragua (%)
Place of birth for the foreign-born population - Panama (%)
Place of birth for the foreign-born population - Other Central America (%)
Place of birth for the foreign-born population - Argentina (%)
Place of birth for the foreign-born population - Bolivia (%)
Place of birth for the foreign-born population - Brazil (%)
Place of birth for the foreign-born population - Chile (%)
Place of birth for the foreign-born population - Colombia (%)
Place of birth for the foreign-born population - Ecuador (%)
Place of birth for the foreign-born population - Guyana (%)
Place of birth for the foreign-born population - Peru (%)
Place of birth for the foreign-born population - Uruguay (%)
Place of birth for the foreign-born population - Venezuela (%)
Place of birth for the foreign-born population - Other South America (%)
Place of birth for the foreign-born population - Canada (%)
Place of birth for the foreign-born population - Other Northern America (%)
Place of birth for the foreign-born population - Other (%)
Latest news about races in Stroudsburg, PA collected exclusively by city-data.com from local newspapers, TV, and radio stations
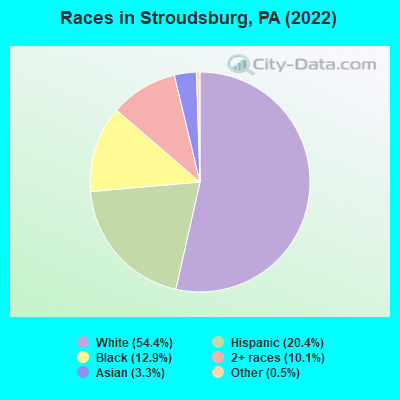
According to 2022 data, the most numerous races in Stroudsburg, PA are White alone (3,190 residents), Black alone (756 residents), and Hispanic (1,198 residents). 79.9% of Stroudsburg residents speak English at home. 13.0% of Stroudsburg, PA residents are foreign-born (5.7% born in Asia, 4.5% born in Latin America, 2.0% born in Europe), which is 46.0% greater than the foreign-born rate of 7.0% across the entire state of Pennsylvania.
Race distribution in Stroudsburg
2000 2022
10,322,455 84.1% White alone 1,202,437 9.8% Black alone 394,088 3.2% Hispanic 218,296 1.8% Asian alone 113,097 0.9% Two or more races 13,086 0.1% Other race alone 14,904 0.1% American Indian alone 2,691 0.02% Native Hawaiian and Other
9,487,228 73.1% White alone 1,311,581 10.1% Black alone 1,115,997 8.6% Hispanic 493,942 3.8% Two or more races 487,124 3.8% Asian alone 63,582 0.5% Other race alone 10,130 0.08% American Indian alone 2,424 0.02% Native Hawaiian and Other
Income and house value in Stroudsburg Median household income in 2022 $59,173 White non-Hispanic householders$50,208 Black householders$79,462 Some other race householders$66,182 Two or more races householders$60,709 Hispanic or Latino race householdersMedian 2022 house value $238,586 White Non-Hispanic householders$393,122 Black or African American householders $123,300 Asian householders$462,376 Some other race householders$167,072 Two or more races householders$346,885 Hispanic or Latino householders
Median age by race in Stroudsburg
57.7 Median age for White residents49.6 63.1 54.0 Median age for Black or African American residents69.9 29.0 -592,592,592.0 Median age for American Indian / Alaska Native residents-570,536,828.4 -577,519,379.3 35.3 Median age for Asian residents21.9 -716,294,457.5 -680,432,644.4 Median age for Native Hawaiian / Pacific Islander residents-666,666,666.0 -666,666,666.0 60.4 Median age for Other race residents53.8 52.2 33.8 Median age for Two or more races residents30.1 39.9 55.5 Median age for White alone residents47.8 64.7 48.1 Median age for Hispanic or Latino residents50.2 55.3
Owner/renter occupied households by race in Stroudsburg
House owners and renters - White residents 800 49.4% Owner occupied818 50.6% Renter occupiedHouse owners and renters - Black or African American residents 188 57.4% Owner occupied140 42.6% Renter occupiedHouse owners and renters - Asian residents 51 73.7% Owner occupied18 26.3% Renter occupiedHouse owners and renters - Other race residents 84 55.3% Owner occupied68 44.7% Renter occupiedHouse owners and renters - Two or more races residents 28 17.1% Owner occupied134 82.9% Renter occupiedHouse owners and renters - White alone residents 720 49.1% Owner occupied745 50.9% Renter occupiedHouse owners and renters - Hispanic or Latino residents 176 41.3% Owner occupied251 58.7% Renter occupied
Language usage in Stroudsburg
English speakers - Total 79.9% of residents of Stroudsburg speak English at home.
11.2% of residents speak Spanish at home 400 64.1% Speak English very well224 35.9% Speak English less than very well8.5% of residents speak other language at home 323 68.4% Speak English very well149 31.6% Speak English less than very well
English speakers - Born in the United States 96.4% of residents of Stroudsburg speak English at home.
3.0% of residents speak Spanish at home 66 98.5% Speak English very well1 1.5% Speak English less than very well1.3% of residents speak other language at home 30 100.0% Speak English very well
English speakers - Native, born elsewhere 39.0% of residents of Stroudsburg speak English at home.
61.6% of residents speak Spanish at home 168 80.0% Speak English very well42 20.0% Speak English less than very well
English speakers - Foreign-born 18.6% of residents of Stroudsburg speak English at home.
31.2% of residents speak Spanish at home 144 50.2% Speak English very well143 49.8% Speak English less than very well48.8% of residents speak other language at home 272 60.6% Speak English very well177 39.4% Speak English less than very well
White (Caucasian) - Speak only English Native:
96.2% (2,978)Foreign-born:
14.5% (45)
White (Caucasian) - Speak another language Native:
4.1% (126)Foreign-born:
83.8% (262)
Black or African American - Speak only English Native:
100.0% (618)Foreign-born:
100.0% (46)
Other race - Speak another language Native:
100.0% (426)Foreign-born:
100.0% (118)
Two or more races - Speak only English Native:
100.0% (623)Foreign-born:
57.4% (125)
White alone - Speak only English Native:
97.4% (2,742)Foreign-born:
18.1% (52)
White alone - Speak another language Native:
2.7% (75)Foreign-born:
81.3% (232)
Hispanic or Latino - Speak only English Native:
55.1% (440)Foreign-born:
31.5% (131)
Hispanic or Latino - Speak another language Native:
44.1% (352)Foreign-born:
71.6% (296)
Foreign-born residents in Stroudsburg 760 residents are foreign born (5.7% Asia , 4.5% Latin America , 2.0% Europe ).
This city:
13.0%Pennsylvania:
7.3%
Marital status for residents in Stroudsburg Marital status - White (Caucasian) population 15 years and over
Males 39.3% Never married37.6% Now married3.0% Separated4.0% Widowed16.1% DivorcedFemales 27.0% Never married39.7% Now married1.6% Separated17.6% Widowed14.1% DivorcedWomen who gave birth in the past 12 months Now married:
33.9% (18)Unmarried:
66.1% (35)
Women who did not give birth in the past 12 months Now married:
33.2% (175)Unmarried:
66.8% (352)
Marital status - Black or African American population 15 years and over
Males 29.2% Never married31.7% Now married17.8% Separated11.1% Widowed10.2% DivorcedFemales 35.2% Never married0.5% Now married0.0% Separated7.9% Widowed56.5% DivorcedWomen who did not give birth in the past 12 months Now married:
0.0% (0)Unmarried:
100.0% (99)
Marital status - Asian population 15 years and over
Males 56.4% Never married43.6% Now married0.0% Separated0.0% Widowed0.0% DivorcedFemales 0.0% Never married100.0% Now married0.0% Separated0.0% Widowed0.0% DivorcedWomen who did not give birth in the past 12 months Now married:
100.0% (45)Unmarried:
0.0% (0)
Marital status - Other race population 15 years and over
Males 0.0% Never married67.3% Now married0.0% Separated12.4% Widowed20.4% DivorcedFemales 25.0% Never married25.0% Now married0.0% Separated50.0% Widowed0.0% DivorcedWomen who did not give birth in the past 12 months Now married:
38.7% (57)Unmarried:
61.3% (91)
Marital status - Two or more races population 15 years and over
Males 81.7% Never married18.3% Now married0.0% Separated0.0% Widowed0.0% DivorcedFemales 22.2% Never married77.8% Now married0.0% Separated0.0% Widowed0.0% DivorcedWomen who did not give birth in the past 12 months Now married:
67.4% (107)Unmarried:
32.6% (52)
Marital status - White alone, not Hispanic / Latino population 15 years and over
Males 42.4% Never married32.7% Now married4.0% Separated5.3% Widowed15.7% DivorcedFemales 28.8% Never married36.4% Now married1.7% Separated17.9% Widowed15.2% DivorcedWomen who gave birth in the past 12 months Now married:
33.9% (19)Unmarried:
66.1% (38)
Women who did not give birth in the past 12 months Now married:
28.2% (147)Unmarried:
71.8% (375)
Marital status - Hispanic or Latino population 15 years and over
Males 21.0% Never married64.0% Now married0.0% Separated2.6% Widowed12.4% DivorcedFemales 9.2% Never married60.2% Now married0.0% Separated30.6% Widowed0.0% DivorcedWomen who did not give birth in the past 12 months Now married:
78.0% (195)Unmarried:
22.0% (55)
Ancestries in Stroudsburg
367 12.1% Italian328 10.8% Irish293 9.7% American149 4.9% Greek121 4.0% English86 2.8% German62 2.0% Polish62 2.0% Turkish50 1.6% Scotch-Irish34 1.1% Soviet Union34 1.1% Ukrainian25 0.8% Palestinian20 0.7% Russian20 0.7% Slovak17 0.6% West Indian12 0.4% French10 0.3% Northern European2 0.07% British
Children Nativity (place of birth) in Stroudsburg
Children under 6 years - Living with two parents Both parents native 110 100.0% NativeChildren under 6 years - Living with one parent Native parent 207 100.0% NativeChildren 6 to 17 years - Living with two parents Both parents native 132 100.0% NativeBoth parents foreign-born 50 100.0% NativeChildren 6 to 17 years - Living with one parent Native parent 196 100.0% NativeForeign-born parent 140 52.9% Native125 47.1% Foreign-born
Grandparents responsible for own grandchildren in Stroudsburg
Grandparents (30 to 59 years) White / Caucasian 111 100.0% Not responsible for grandchildrenWhite alone, not Hispanic / Latino 121 100.0% Not responsible for grandchildren
Grandparents (60 years and over) White / Caucasian 27 100.0% Not responsible for grandchildrenWhite alone, not Hispanic / Latino 31 100.0% Not responsible for grandchildren