Races in Streamwood, Illinois (IL) Detailed Stats
Data:
Races - White alone (%)
Races - White alone (% change since 2000)
Races - Black alone (%)
Races - Black alone (% change since 2000)
Races - American Indian alone (%)
Races - American Indian alone (% change since 2000)
Races - Asian alone (%)
Races - Asian alone (% change since 2000)
Races - Hispanic (%)
Races - Hispanic (% change since 2000)
Races - Native Hawaiian and Other Pacific Islander alone (%)
Races - Native Hawaiian and Other Pacific Islander alone (% change since 2000)
Races - Two or more races(%)
Races - Two or more races(% change since 2000)
Races - Other race alone (%)
Races - Other race alone (% change since 2000)
Racial diversity
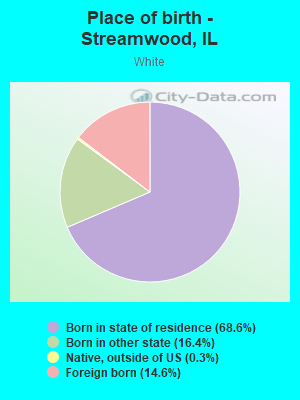
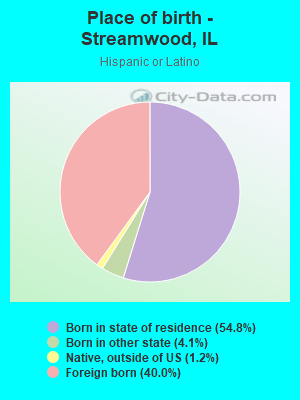
Place of birth - Born in state of residence (%)
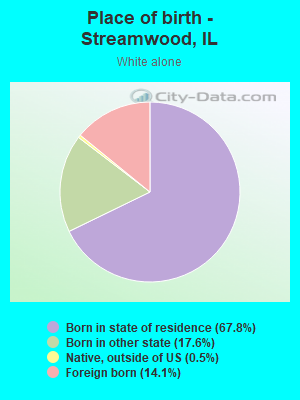
Place of birth - Born in state of residence (%) - White
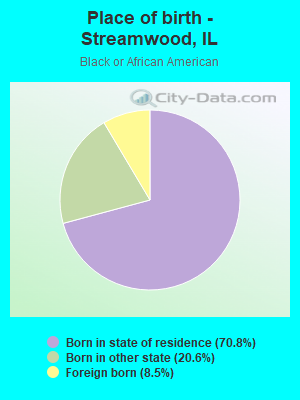
Place of birth - Born in state of residence (%) - Black or African American
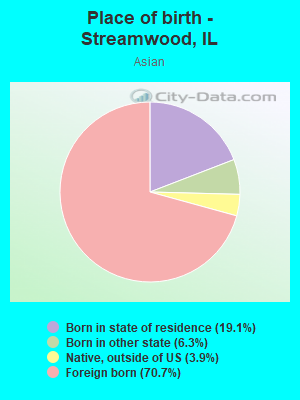
Place of birth - Born in state of residence (%) - Asian
Place of birth - Born in state of residence (%) - Hispanic or Latino
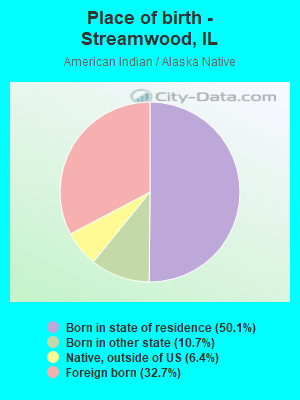
Place of birth - Born in state of residence (%) - American Indian and Alaska Native
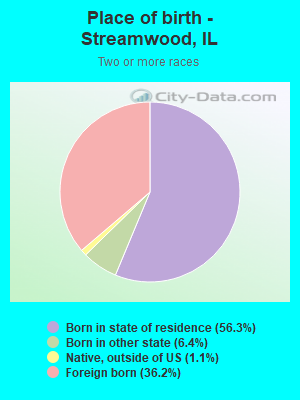
Place of birth - Born in state of residence (%) - Multirace
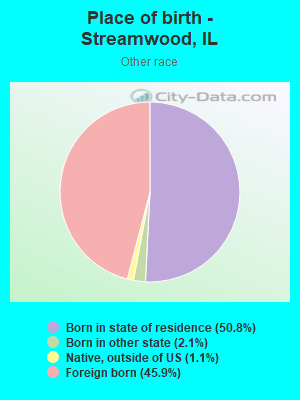
Place of birth - Born in state of residence (%) - Other Race
Place of birth - Born in other state (%)
Place of birth - Born in other state (%) - White
Place of birth - Born in other state (%) - Black or African American
Place of birth - Born in other state (%) - Asian
Place of birth - Born in other state (%) - Hispanic or Latino
Place of birth - Born in other state (%) - American Indian and Alaska Native
Place of birth - Born in other state (%) - Multirace
Place of birth - Born in other state (%) - Other Race
Place of birth - Native, outside of US (%)
Place of birth - Native, outside of US (%) - White
Place of birth - Native, outside of US (%) - Black or African American
Place of birth - Native, outside of US (%) - Asian
Place of birth - Native, outside of US (%) - Hispanic or Latino
Place of birth - Native, outside of US (%) - American Indian and Alaska Native
Place of birth - Native, outside of US (%) - Multirace
Place of birth - Native, outside of US (%) - Other Race
Place of birth - Foreign born (%)
Place of birth - Foreign born (%) - White
Place of birth - Foreign born (%) - Black or African American
Place of birth - Foreign born (%) - Asian
Place of birth - Foreign born (%) - Hispanic or Latino
Place of birth - Foreign born (%) - American Indian and Alaska Native
Place of birth - Foreign born (%) - Multirace
Place of birth - Foreign born (%) - Other Race
Residents speaking English at home (%)
Residents speaking English at home - Born in the United States (%)
Residents speaking English at home - Native, born elsewhere (%)
Residents speaking English at home - Foreign born (%)
Residents speaking Spanish at home (%)
Residents speaking Spanish at home - Born in the United States (%)
Residents speaking Spanish at home - Native, born elsewhere (%)
Residents speaking Spanish at home - Foreign born (%)
Residents speaking other language at home (%)
Residents speaking other language at home - Born in the United States (%)
Residents speaking other language at home - Native, born elsewhere (%)
Residents speaking other language at home - Foreign born (%)
Marital status - Never married (%)
Marital status - Now married (%)
Marital status - Separated (%)
Marital status - Widowed (%)
Marital status - Divorced (%)
Ancestries Reported - Arab (%)
Ancestries Reported - Czech (%)
Ancestries Reported - Danish (%)
Ancestries Reported - Dutch (%)
Ancestries Reported - English (%)
Ancestries Reported - French (%)
Ancestries Reported - French Canadian (%)
Ancestries Reported - German (%)
Ancestries Reported - Greek (%)
Ancestries Reported - Hungarian (%)
Ancestries Reported - Irish (%)
Ancestries Reported - Italian (%)
Ancestries Reported - Lithuanian (%)
Ancestries Reported - Norwegian (%)
Ancestries Reported - Polish (%)
Ancestries Reported - Portuguese (%)
Ancestries Reported - Russian (%)
Ancestries Reported - Scotch-Irish (%)
Ancestries Reported - Scottish (%)
Ancestries Reported - Slovak (%)
Ancestries Reported - Subsaharan African (%)
Ancestries Reported - Swedish (%)
Ancestries Reported - Swiss (%)
Ancestries Reported - Ukrainian (%)
Ancestries Reported - United States (%)
Ancestries Reported - Welsh (%)
Ancestries Reported - West Indian (%)
Ancestries Reported - Other (%)
Geographical mobility - Same house 1 year ago (%)
Geographical mobility - Same house 1 year ago (%) - White
Geographical mobility - Same house 1 year ago (%) - Black or African American
Geographical mobility - Same house 1 year ago (%) - Asian
Geographical mobility - Same house 1 year ago (%) - Hispanic or Latino
Geographical mobility - Same house 1 year ago (%) - American Indian and Alaska Native
Geographical mobility - Same house 1 year ago (%) - Multirace
Geographical mobility - Same house 1 year ago (%) - Other Race
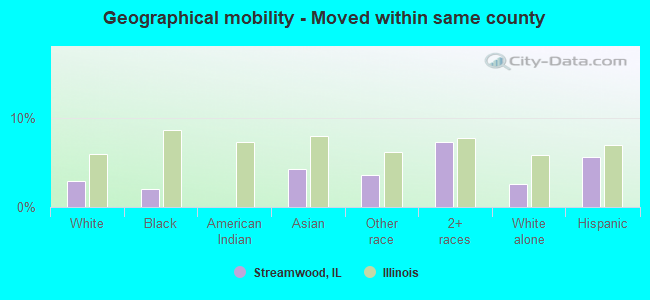
Geographical mobility - Moved within same county (%)
Geographical mobility - Moved within same county (%) - White
Geographical mobility - Moved within same county (%) - Black or African American
Geographical mobility - Moved within same county (%) - Asian
Geographical mobility - Moved within same county (%) - Hispanic or Latino
Geographical mobility - Moved within same county (%) - American Indian and Alaska Native
Geographical mobility - Moved within same county (%) - Multirace
Geographical mobility - Moved within same county (%) - Other Race
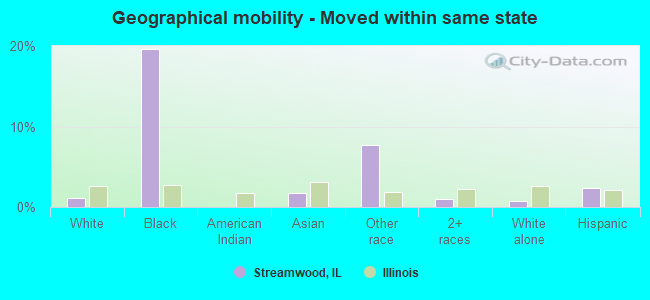
Geographical mobility - Moved from different county within same state (%)
Geographical mobility - Moved from different county within same state (%) - White
Geographical mobility - Moved from different county within same state (%) - Black or African American
Geographical mobility - Moved from different county within same state (%) - Asian
Geographical mobility - Moved from different county within same state (%) - Hispanic or Latino
Geographical mobility - Moved from different county within same state (%) - American Indian and Alaska Native
Geographical mobility - Moved from different county within same state (%) - Multirace
Geographical mobility - Moved from different county within same state (%) - Other Race
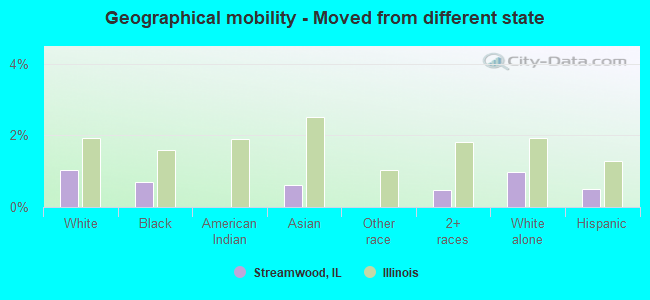
Geographical mobility - Moved from different state (%)
Geographical mobility - Moved from different state (%) - White
Geographical mobility - Moved from different state (%) - Black or African American
Geographical mobility - Moved from different state (%) - Asian
Geographical mobility - Moved from different state (%) - Hispanic or Latino
Geographical mobility - Moved from different state (%) - American Indian and Alaska Native
Geographical mobility - Moved from different state (%) - Multirace
Geographical mobility - Moved from different state (%) - Other Race
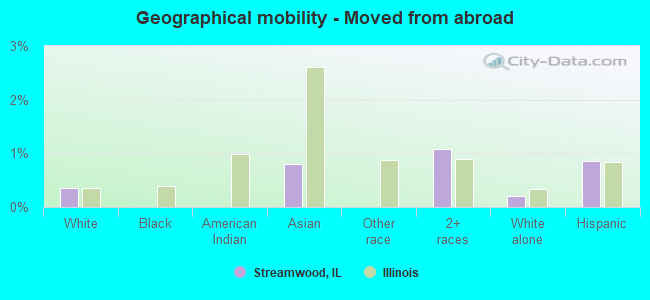
Geographical mobility - Moved from abroad (%)
Geographical mobility - Moved from abroad (%) - White
Geographical mobility - Moved from abroad (%) - Black or African American
Geographical mobility - Moved from abroad (%) - Asian
Geographical mobility - Moved from abroad (%) - Hispanic or Latino
Geographical mobility - Moved from abroad (%) - American Indian and Alaska Native
Geographical mobility - Moved from abroad (%) - Multirace
Geographical mobility - Moved from abroad (%) - Other Race
Place of birth for the foreign-born population - Ireland (%)
Place of birth for the foreign-born population - Denmark (%)
Place of birth for the foreign-born population - Norway (%)
Place of birth for the foreign-born population - Sweden (%)
Place of birth for the foreign-born population - United Kingdom (%)
Place of birth for the foreign-born population - England (%)
Place of birth for the foreign-born population - Scotland (%)
Place of birth for the foreign-born population - Other Northern Europe (%)
Place of birth for the foreign-born population - Austria (%)
Place of birth for the foreign-born population - Belgium (%)
Place of birth for the foreign-born population - France (%)
Place of birth for the foreign-born population - Germany (%)
Place of birth for the foreign-born population - Netherlands (%)
Place of birth for the foreign-born population - Switzerland (%)
Place of birth for the foreign-born population - Other Western Europe (%)
Place of birth for the foreign-born population - Greece (%)
Place of birth for the foreign-born population - Italy (%)
Place of birth for the foreign-born population - Portugal (%)
Place of birth for the foreign-born population - Spain (%)
Place of birth for the foreign-born population - Other Southern Europe (%)
Place of birth for the foreign-born population - Albania (%)
Place of birth for the foreign-born population - Belarus (%)
Place of birth for the foreign-born population - Bosnia and Herzegovina (%)
Place of birth for the foreign-born population - Bulgaria (%)
Place of birth for the foreign-born population - Croatia (%)
Place of birth for the foreign-born population - Czechoslovakia (%)
Place of birth for the foreign-born population - Hungary (%)
Place of birth for the foreign-born population - Latvia (%)
Place of birth for the foreign-born population - Lithuania (%)
Place of birth for the foreign-born population - North Macedonia (Macedonia) (%)
Place of birth for the foreign-born population - Moldova (%)
Place of birth for the foreign-born population - Poland (%)
Place of birth for the foreign-born population - Romania (%)
Place of birth for the foreign-born population - Russia (%)
Place of birth for the foreign-born population - Serbia (%)
Place of birth for the foreign-born population - Ukraine (%)
Place of birth for the foreign-born population - Other Eastern Europe (%)
Place of birth for the foreign-born population - China (%)
Place of birth for the foreign-born population - Hong Kong (%)
Place of birth for the foreign-born population - Taiwan (%)
Place of birth for the foreign-born population - Japan (%)
Place of birth for the foreign-born population - Korea (%)
Place of birth for the foreign-born population - Other Eastern Asia (%)
Place of birth for the foreign-born population - Afghanistan (%)
Place of birth for the foreign-born population - Bangladesh (%)
Place of birth for the foreign-born population - India (%)
Place of birth for the foreign-born population - Iran (%)
Place of birth for the foreign-born population - Kazakhstan (%)
Place of birth for the foreign-born population - Nepal (%)
Place of birth for the foreign-born population - Pakistan (%)
Place of birth for the foreign-born population - Sri Lanka (%)
Place of birth for the foreign-born population - Uzbekistan (%)
Place of birth for the foreign-born population - Other South Central Asia (%)
Place of birth for the foreign-born population - Burma (%)
Place of birth for the foreign-born population - Cambodia (%)
Place of birth for the foreign-born population - Indonesia (%)
Place of birth for the foreign-born population - Laos (%)
Place of birth for the foreign-born population - Malaysia (%)
Place of birth for the foreign-born population - Philippines (%)
Place of birth for the foreign-born population - Singapore (%)
Place of birth for the foreign-born population - Thailand (%)
Place of birth for the foreign-born population - Vietnam (%)
Place of birth for the foreign-born population - Other South Eastern Asia (%)
Place of birth for the foreign-born population - Armenia (%)
Place of birth for the foreign-born population - Iraq (%)
Place of birth for the foreign-born population - Israel (%)
Place of birth for the foreign-born population - Jordan (%)
Place of birth for the foreign-born population - Kuwait (%)
Place of birth for the foreign-born population - Lebanon (%)
Place of birth for the foreign-born population - Saudi Arabia (%)
Place of birth for the foreign-born population - Syria (%)
Place of birth for the foreign-born population - Turkey (%)
Place of birth for the foreign-born population - Yemen (%)
Place of birth for the foreign-born population - Other Western Asia (%)
Place of birth for the foreign-born population - Eritrea (%)
Place of birth for the foreign-born population - Ethiopia (%)
Place of birth for the foreign-born population - Kenya (%)
Place of birth for the foreign-born population - Somalia (%)
Place of birth for the foreign-born population - Uganda (%)
Place of birth for the foreign-born population - Zimbabwe (%)
Place of birth for the foreign-born population - Other Eastern Africa (%)
Place of birth for the foreign-born population - Cameroon (%)
Place of birth for the foreign-born population - Congo (%)
Place of birth for the foreign-born population - Democratic Republic of Congo (Zaire) (%)
Place of birth for the foreign-born population - Other Middle Africa (%)
Place of birth for the foreign-born population - Egypt (%)
Place of birth for the foreign-born population - Morocco (%)
Place of birth for the foreign-born population - Sudan (%)
Place of birth for the foreign-born population - Other Northern Africa (%)
Place of birth for the foreign-born population - South Africa (%)
Place of birth for the foreign-born population - Other Southern Africa (%)
Place of birth for the foreign-born population - Cabo Verde (%)
Place of birth for the foreign-born population - Ghana (%)
Place of birth for the foreign-born population - Liberia (%)
Place of birth for the foreign-born population - Nigeria (%)
Place of birth for the foreign-born population - Senegal (%)
Place of birth for the foreign-born population - Sierra Leone (%)
Place of birth for the foreign-born population - Other Western Africa (%)
Place of birth for the foreign-born population - Australia (%)
Place of birth for the foreign-born population - New Zealand (%)
Place of birth for the foreign-born population - Fiji (%)
Place of birth for the foreign-born population - Micronesia (%)
Place of birth for the foreign-born population - Bahamas (%)
Place of birth for the foreign-born population - Barbados (%)
Place of birth for the foreign-born population - Cuba (%)
Place of birth for the foreign-born population - Dominica (%)
Place of birth for the foreign-born population - Dominican Republic (%)
Place of birth for the foreign-born population - Grenada (%)
Place of birth for the foreign-born population - Haiti (%)
Place of birth for the foreign-born population - Jamaica (%)
Place of birth for the foreign-born population - St. Vincent and the Grenadines (%)
Place of birth for the foreign-born population - Trinidad and Tobago (%)
Place of birth for the foreign-born population - West Indies (%)
Place of birth for the foreign-born population - Other Caribbean (%)
Place of birth for the foreign-born population - Belize (%)
Place of birth for the foreign-born population - Costa Rica (%)
Place of birth for the foreign-born population - El Salvador (%)
Place of birth for the foreign-born population - Guatemala (%)
Place of birth for the foreign-born population - Honduras (%)
Place of birth for the foreign-born population - Mexico (%)
Place of birth for the foreign-born population - Nicaragua (%)
Place of birth for the foreign-born population - Panama (%)
Place of birth for the foreign-born population - Other Central America (%)
Place of birth for the foreign-born population - Argentina (%)
Place of birth for the foreign-born population - Bolivia (%)
Place of birth for the foreign-born population - Brazil (%)
Place of birth for the foreign-born population - Chile (%)
Place of birth for the foreign-born population - Colombia (%)
Place of birth for the foreign-born population - Ecuador (%)
Place of birth for the foreign-born population - Guyana (%)
Place of birth for the foreign-born population - Peru (%)
Place of birth for the foreign-born population - Uruguay (%)
Place of birth for the foreign-born population - Venezuela (%)
Place of birth for the foreign-born population - Other South America (%)
Place of birth for the foreign-born population - Canada (%)
Place of birth for the foreign-born population - Other Northern America (%)
Place of birth for the foreign-born population - Other (%)
Latest news about races in Streamwood, IL collected exclusively by city-data.com from local newspapers, TV, and radio stations
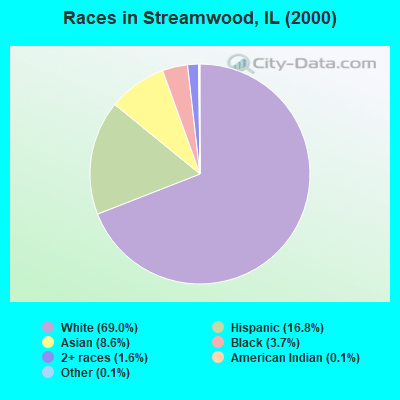
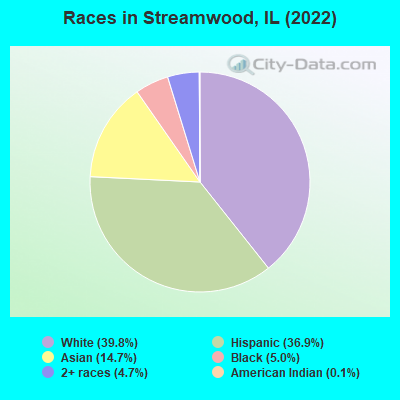
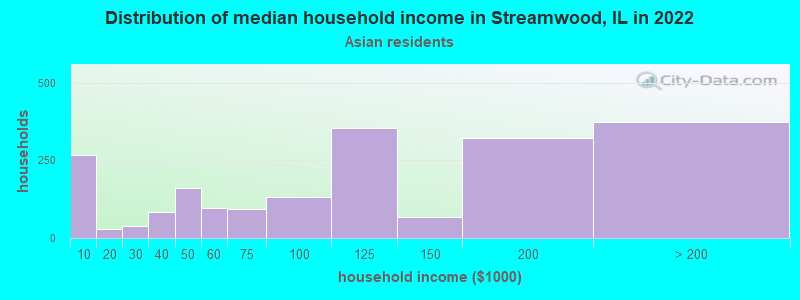
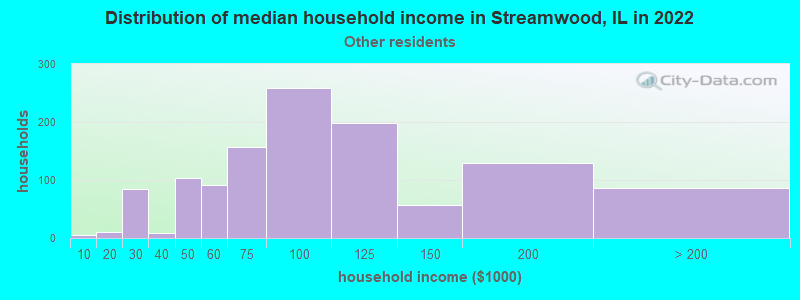
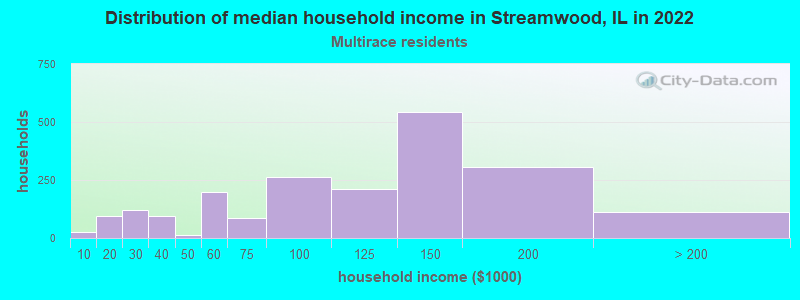
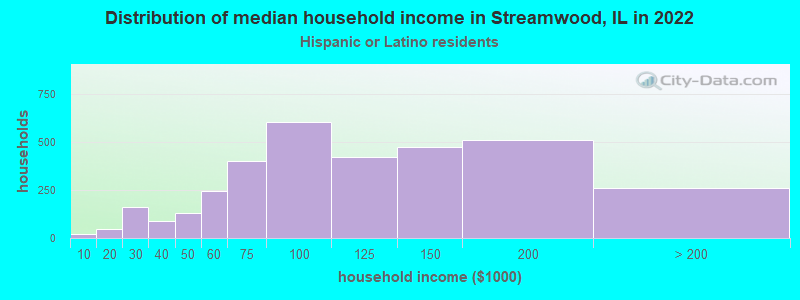
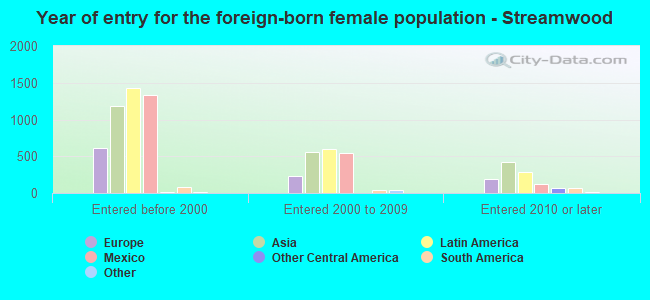
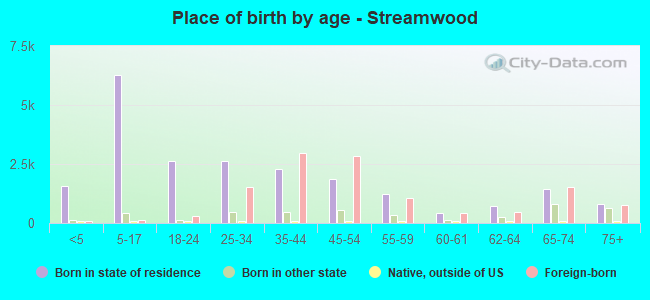
According to 2022 data, the most numerous races in Streamwood, IL are White alone (15,404 residents), Hispanic (14,269 residents), and Black alone (1,919 residents). 51.5% of Streamwood residents speak English at home. 31.1% of Streamwood, IL residents are foreign-born (14.5% born in Latin America, 10.5% born in Asia, 4.7% born in Europe), which is 54.9% greater than the foreign-born rate of 14.0% across the entire state of Illinois.
Race distribution in Streamwood
2000 2022
8,424,140 67.8% White alone 1,856,152 14.9% Black alone 1,530,262 12.3% Hispanic 419,916 3.4% Asian alone 153,996 1.2% Two or more races 13,479 0.1% Other race alone 18,232 0.1% American Indian alone 3,116 0.03% Native Hawaiian and Other
7,356,301 58.5% White alone 2,299,726 18.3% Hispanic 1,660,423 13.2% Black alone 747,296 5.9% Asian alone 458,599 3.6% Two or more races 45,386 0.4% Other race alone 10,405 0.08% American Indian alone 3,896 0.03% Native Hawaiian and Other
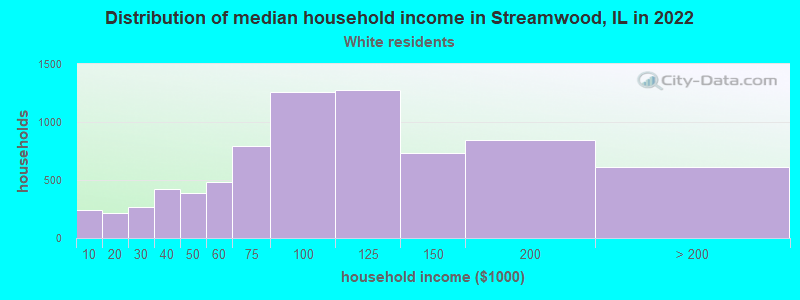
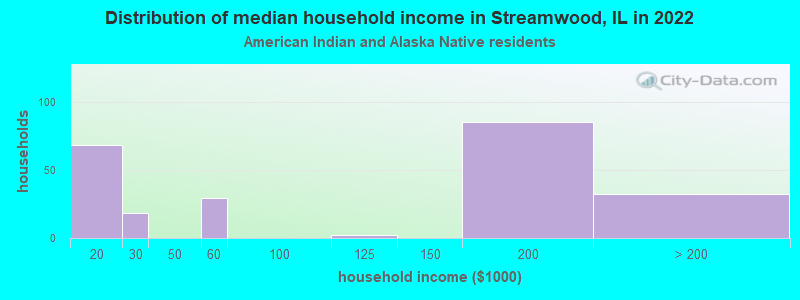
Income and house value in Streamwood Median household income in 2022 $90,769 White non-Hispanic householders$52,800 Black householders$104,472 Asian householders$89,431 Some other race householders$113,078 Two or more races householders$101,878 Hispanic or Latino race householdersMedian 2022 house value $249,797 White Non-Hispanic householders$261,024 Black or African American householders$100,515 American Indian or Alaska Native householders $308,388 Asian householders$244,359 Some other race householders$268,567 Two or more races householders$235,062 Hispanic or Latino householders
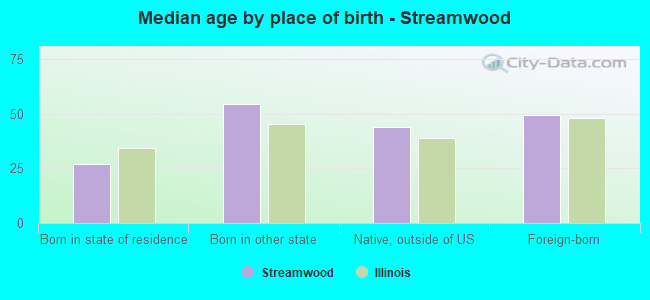
Median age by race in Streamwood
46.1 Median age for White residents44.9 47.5 26.8 Median age for Black or African American residents27.5 26.9 26.1 Median age for American Indian / Alaska Native residents41.0 22.8 51.0 Median age for Asian residents49.1 53.4 -687,999,999.3 Median age for Native Hawaiian / Pacific Islander residents-918,721,460.3 -610,229,276.3 29.4 Median age for Other race residents32.5 28.1 26.7 Median age for Two or more races residents29.0 18.0 50.7 Median age for White alone residents48.3 52.5 28.4 Median age for Hispanic or Latino residents33.4 25.7
Owner/renter occupied households by race in Streamwood
House owners and renters - White residents 6,675 88.8% Owner occupied838 11.2% Renter occupiedHouse owners and renters - Black or African American residents 302 46.5% Owner occupied347 53.5% Renter occupiedHouse owners and renters - American Indian / Alaska Native residents 218 85.1% Owner occupied38 14.9% Renter occupiedHouse owners and renters - Asian residents 2,111 96.8% Owner occupied70 3.2% Renter occupiedHouse owners and renters - Other race residents 889 75.4% Owner occupied289 24.6% Renter occupiedHouse owners and renters - Two or more races residents 1,791 82.1% Owner occupied390 17.9% Renter occupiedHouse owners and renters - White alone residents 6,317 89.2% Owner occupied769 10.8% Renter occupiedHouse owners and renters - Hispanic or Latino residents 2,805 82.5% Owner occupied594 17.5% Renter occupied
Language usage in Streamwood
English speakers - Total 51.5% of residents of Streamwood speak English at home.
29.4% of residents speak Spanish at home 7,126 65.7% Speak English very well3,728 34.3% Speak English less than very well19.4% of residents speak other language at home 4,598 64.3% Speak English very well2,550 35.7% Speak English less than very well
English speakers - Born in the United States 87.0% of residents of Streamwood speak English at home.
8.3% of residents speak Spanish at home 327 94.5% Speak English very well19 5.5% Speak English less than very well4.5% of residents speak other language at home 185 100.0% Speak English very well
English speakers - Native, born elsewhere 43.4% of residents of Streamwood speak English at home.
21.6% of residents speak Spanish at home 80 92.0% Speak English very well7 8.0% Speak English less than very well34.7% of residents speak other language at home 133 95.0% Speak English very well7 5.0% Speak English less than very well
English speakers - Foreign-born 6.2% of residents of Streamwood speak English at home.
47.4% of residents speak Spanish at home 2,426 42.8% Speak English very well3,240 57.2% Speak English less than very well46.8% of residents speak other language at home 3,147 56.2% Speak English very well2,454 43.8% Speak English less than very well
White (Caucasian) - Speak only English Native:
90.3% (12,876)Foreign-born:
9.1% (224)
White (Caucasian) - Speak another language Native:
10.1% (1,446)Foreign-born:
90.5% (2,239)
Black or African American - Speak only English Native:
99.9% (1,496)Foreign-born:
37.2% (64)
Black or African American - Speak another language Native:
0.1% (1)Foreign-born:
62.7% (108)
American Indian / Alaska Native - Speak another language Native:
56.6% (295)Foreign-born:
100.0% (279)
Asian - Speak only English Native:
58.3% (897)Foreign-born:
6.9% (276)
Asian - Speak another language Native:
41.8% (643)Foreign-born:
93.8% (3,769)
Other race - Speak only English Native:
28.6% (685)Foreign-born:
3.1% (67)
Other race - Speak another language Native:
71.8% (1,720)Foreign-born:
97.1% (2,089)
Two or more races - Speak only English Native:
42.6% (2,454)Foreign-born:
3.2% (121)
Two or more races - Speak another language Native:
58.5% (3,370)Foreign-born:
96.8% (3,619)
White alone - Speak only English Native:
93.3% (12,138)Foreign-born:
11.1% (241)
White alone - Speak another language Native:
6.6% (855)Foreign-born:
89.4% (1,943)
Hispanic or Latino - Speak only English Native:
34.4% (2,728)Foreign-born:
2.5% (141)
Hispanic or Latino - Speak another language Native:
65.7% (5,218)Foreign-born:
97.8% (5,536)
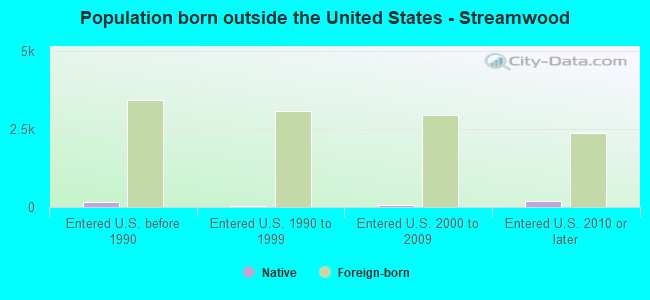
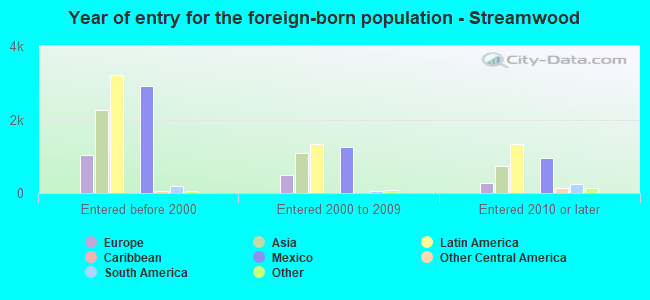
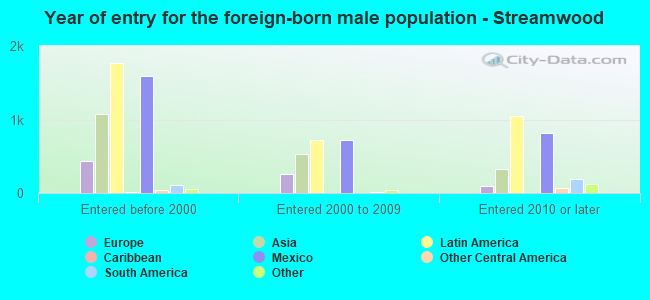
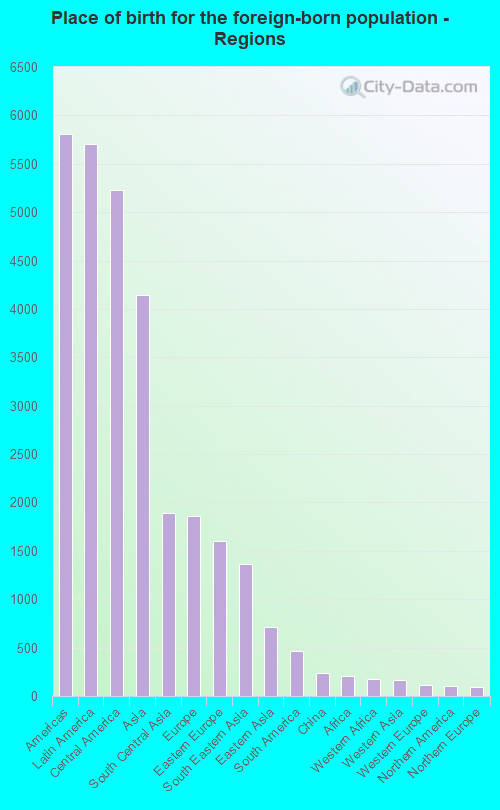
Foreign-born residents in Streamwood 12,015 residents are foreign born (14.5% Latin America , 10.5% Asia , 4.7% Europe ).
This city:
31.1%Illinois:
14.1%
Marital status for residents in Streamwood Marital status - White (Caucasian) population 15 years and over
Males 33.7% Never married54.2% Now married0.5% Separated2.6% Widowed9.0% DivorcedFemales 25.1% Never married54.1% Now married0.5% Separated8.5% Widowed11.8% DivorcedWomen who gave birth in the past 12 months Now married:
77.7% (153)Unmarried:
22.3% (44)
Women who did not give birth in the past 12 months Now married:
46.6% (1,630)Unmarried:
53.4% (1,867)
Marital status - Black or African American population 15 years and over
Males 65.0% Never married25.7% Now married0.0% Separated3.0% Widowed6.3% DivorcedFemales 59.2% Never married16.7% Now married4.7% Separated7.1% Widowed12.2% DivorcedWomen who gave birth in the past 12 months Now married:
63.6% (7)Unmarried:
36.4% (4)
Women who did not give birth in the past 12 months Now married:
26.9% (80)Unmarried:
73.1% (218)
Marital status - American Indian / Alaska Native population 15 years and over
Males 31.5% Never married30.6% Now married17.7% Separated0.0% Widowed20.2% DivorcedFemales 53.8% Never married26.0% Now married0.0% Separated0.0% Widowed20.2% DivorcedWomen who did not give birth in the past 12 months Now married:
19.9% (67)Unmarried:
80.1% (269)
Marital status - Asian population 15 years and over
Males 26.3% Never married69.1% Now married0.1% Separated2.3% Widowed2.2% DivorcedFemales 17.1% Never married66.0% Now married1.0% Separated10.2% Widowed5.6% DivorcedWomen who gave birth in the past 12 months Now married:
100.0% (52)Unmarried:
0.0% (0)
Women who did not give birth in the past 12 months Now married:
54.0% (590)Unmarried:
46.0% (503)
Marital status - Other race population 15 years and over
Males 46.5% Never married45.7% Now married1.9% Separated1.0% Widowed5.0% DivorcedFemales 43.5% Never married47.4% Now married0.5% Separated2.8% Widowed5.9% DivorcedWomen who gave birth in the past 12 months Now married:
100.0% (17)Unmarried:
0.0% (0)
Women who did not give birth in the past 12 months Now married:
45.2% (657)Unmarried:
54.8% (796)
Marital status - Two or more races population 15 years and over
Males 61.8% Never married28.7% Now married2.4% Separated1.5% Widowed5.6% DivorcedFemales 49.8% Never married40.5% Now married3.0% Separated1.1% Widowed5.5% DivorcedWomen who gave birth in the past 12 months Now married:
100.0% (12)Unmarried:
0.0% (0)
Women who did not give birth in the past 12 months Now married:
40.1% (835)Unmarried:
59.9% (1,248)
Marital status - White alone, not Hispanic / Latino population 15 years and over
Males 32.0% Never married55.1% Now married0.3% Separated2.9% Widowed9.7% DivorcedFemales 21.4% Never married54.9% Now married0.6% Separated10.0% Widowed13.2% DivorcedWomen who gave birth in the past 12 months Now married:
62.3% (82)Unmarried:
37.7% (49)
Women who did not give birth in the past 12 months Now married:
48.8% (1,400)Unmarried:
51.2% (1,470)
Marital status - Hispanic or Latino population 15 years and over
Males 53.1% Never married37.4% Now married2.5% Separated1.3% Widowed5.8% DivorcedFemales 46.4% Never married45.7% Now married1.3% Separated1.4% Widowed5.1% DivorcedWomen who gave birth in the past 12 months Now married:
100.0% (110)Unmarried:
0.0% (0)
Women who did not give birth in the past 12 months Now married:
41.9% (1,601)Unmarried:
58.1% (2,224)
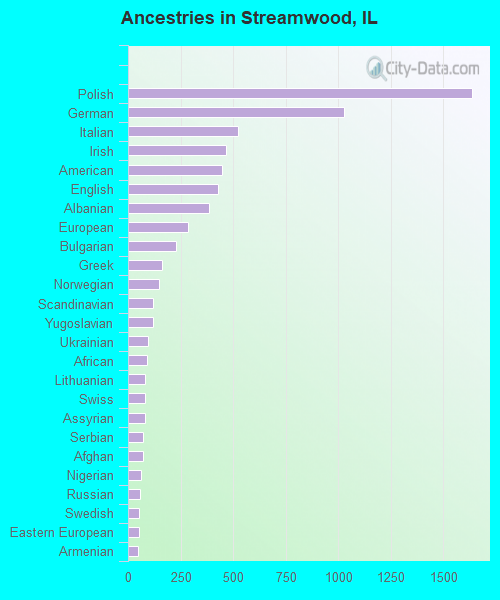
Ancestries in Streamwood
1,635 7.1% Polish1,026 4.4% German522 2.3% Italian464 2.0% Irish447 1.9% American426 1.8% English383 1.7% Albanian287 1.2% European228 1.0% Bulgarian162 0.7% Greek149 0.6% Norwegian121 0.5% Scandinavian118 0.5% Yugoslavian94 0.4% Ukrainian92 0.4% African83 0.4% Lithuanian82 0.4% Swiss80 0.3% Assyrian71 0.3% Serbian70 0.3% Afghan64 0.3% Nigerian56 0.2% Russian54 0.2% Swedish53 0.2% Eastern European49 0.2% Armenian49 0.2% Dutch45 0.2% British45 0.2% French Canadian41 0.2% Romanian36 0.2% Northern European33 0.1% Slavic30 0.1% Turkish29 0.1% Latvian27 0.1% French23 0.10% Czech13 0.06% Danish11 0.05% Icelander11 0.05% Slovak8 0.03% Macedonian7 0.03% Austrian4 0.02% Welsh
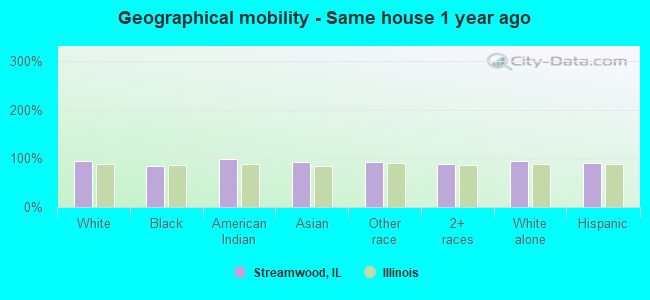
Geographical mobility in Streamwood Same house 1 year ago 15,977 94.0% White (Caucasian)1,694 84.5% Black or African American811 98.7% American Indian / Alaska Native5,193 91.7% Asian4,297 91.4% Other race9,174 89.4% Two or more races14,573 95.0% White alone, not Hispanic / Latino12,886 90.8% Hispanic or LatinoMoved within same county 499 2.9% White / Caucasian40 2.0% Black or African American244 4.3% Asian167 3.5% Other race750 7.3% Two or more races395 2.6% White alone, not Hispanic / Latino796 5.6% Hispanic or LatinoMoved within same state 182 1.1% White / Caucasian394 19.6% Black or African American101 1.8% Asian362 7.7% Other race107 1.0% Two or more races119 0.8% White alone, not Hispanic / Latino339 2.4% Hispanic or LatinoMoved from different state 177 1.0% White / Caucasian14 0.7% Black or African American35 0.6% Asian49 0.5% Two or more races152 1.0% White alone, not Hispanic / Latino72 0.5% Hispanic or LatinoMoved from abroad 60 0.4% White46 0.8% Asian112 1.1% Two or more races32 0.2% White alone, not Hispanic / Latino122 0.9% Hispanic or Latino
Children Nativity (place of birth) in Streamwood
Children under 6 years - Living with two parents Both parents native 547 100.0% NativeBoth parents foreign-born 558 96.6% Native20 3.4% Foreign-bornOne native, one foreign-born parent 178 100.0% NativeChildren under 6 years - Living with one parent Native parent 887 100.0% NativeForeign-born parent 242 82.2% Native53 17.8% Foreign-bornChildren 6 to 17 years - Living with two parents Both parents native 1,430 100.0% NativeBoth parents foreign-born 1,977 95.2% Native99 4.8% Foreign-bornOne native, one foreign-born parent 716 98.8% Native9 1.2% Foreign-bornChildren 6 to 17 years - Living with one parent Native parent 1,121 100.0% NativeForeign-born parent 456 50.1% Native454 49.9% Foreign-born
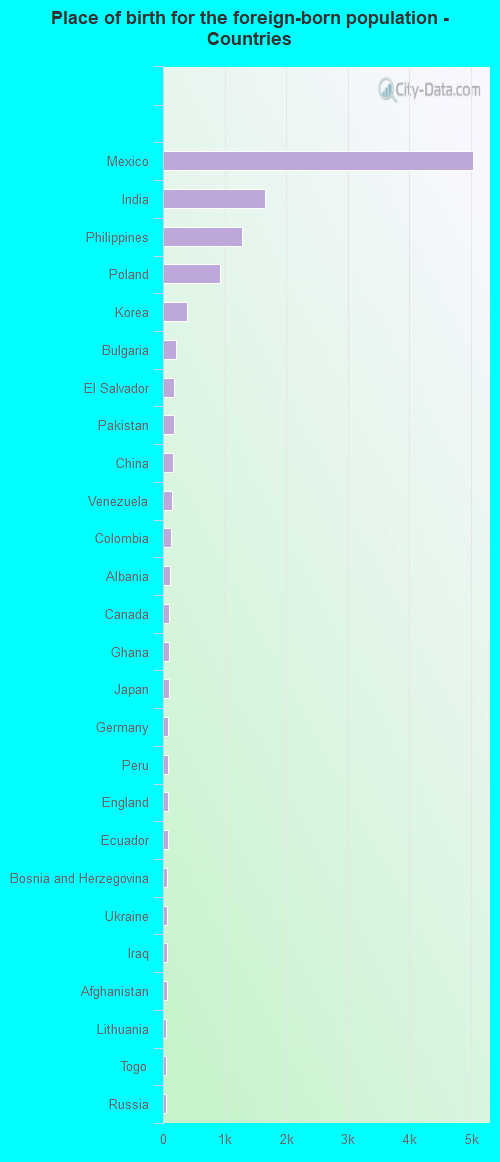
Place of birth for residents in Streamwood 5,808 Americas5,703 Latin America5,229 Central America4,144 Asia1,895 South Central Asia1,857 Europe1,606 Eastern Europe1,365 South Eastern Asia717 Eastern Asia461 South America237 China205 Africa177 Western Africa165 Western Asia111 Western Europe104 Northern America96 Northern Europe43 Southern Europe27 Eastern Africa12 Caribbean5,040 Mexico1,659 India1,276 Philippines930 Poland383 Korea213 Bulgaria175 El Salvador175 Pakistan170 China149 Venezuela125 Colombia108 Albania104 Canada95 Ghana91 Japan83 Germany81 Peru76 England74 Ecuador63 Bosnia and Herzegovina63 Ukraine62 Iraq60 Afghanistan51 Lithuania50 Togo49 Russia41 Israel38 Vietnam37 Taiwan31 Nigeria31 Turkey30 Thailand28 Hong Kong28 Syria27 Latvia25 North Macedonia (Macedonia)24 Serbia22 Italy20 Kenya19 United Kingdom17 France16 Chile14 Belarus14 Czechoslovakia14 Romania14 Spain13 Argentina12 Cuba11 Laos9 Switzerland7 Indonesia6 Tanzania6 Guatemala5 Greece5 Panama1 Moldova
Grandparents responsible for own grandchildren in Streamwood
Grandparents (30 to 59 years) White / Caucasian 45 31.5% Responsible for grandchildren99 68.5% Not responsible for grandchildrenBlack or African American 20 100.0% Responsible for grandchildrenAmerican Indian / Alaska Native 14 100.0% Not responsible for grandchildrenAsian 49 100.0% Not responsible for grandchildrenOther race 12 100.0% Not responsible for grandchildrenTwo or more races 121 100.0% Not responsible for grandchildrenWhite alone, not Hispanic / Latino 60 47.6% Responsible for grandchildren66 52.4% Not responsible for grandchildrenHispanic or Latino 147 100.0% Not responsible for grandchildrenGrandparents (60 years and over) White / Caucasian 90 34.6% Responsible for grandchildren170 65.4% Not responsible for grandchildrenBlack or African American 61 100.0% Not responsible for grandchildrenAsian 349 100.0% Not responsible for grandchildrenOther race 13 16.4% Responsible for grandchildren65 83.6% Not responsible for grandchildrenTwo or more races 72 53.8% Responsible for grandchildren62 46.2% Not responsible for grandchildrenWhite alone, not Hispanic / Latino 109 34.2% Responsible for grandchildren210 65.8% Not responsible for grandchildrenHispanic or Latino 57 34.2% Responsible for grandchildren109 65.8% Not responsible for grandchildren