Races in Stonybrook-Wilshire, Pennsylvania (PA) Detailed Stats
Ancestries, Foreign-born residents, place of birth

Discuss Stonybrook-Wilshire, Pennsylvania races on our local forum with over 2,400,000 registered users
4.7% of Stonybrook-Wilshire, PA residents are foreign-born (2.5% born in Asia, 1.1% born in Europe, 0.7% born in Africa), which is 48.6% less than the foreign-born rate of 7.0% across the entire state of Pennsylvania.
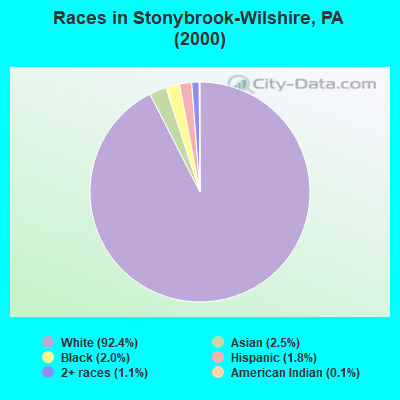
Race distribution in Stonybrook-Wilshire

- 5,00592.4%White alone
- 1352.5%Asian alone
- 1082.0%Black alone
- 951.8%Hispanic
- 591.1%Two or more races
- 80.1%American Indian alone
- 40.07%Native Hawaiian and Other
Pacific Islander alone
2000
2022
-
- 10,322,45584.1%White alone
- 1,202,4379.8%Black alone
- 394,0883.2%Hispanic
- 218,2961.8%Asian alone
- 113,0970.9%Two or more races
- 13,0860.1%Other race alone
- 14,9040.1%American Indian alone
- 2,6910.02%Native Hawaiian and Other
Pacific Islander alone

-
- 9,487,22873.1%White alone
- 1,311,58110.1%Black alone
- 1,115,9978.6%Hispanic
- 493,9423.8%Two or more races
- 487,1243.8%Asian alone
- 63,5820.5%Other race alone
- 10,1300.08%American Indian alone
- 2,4240.02%Native Hawaiian and Other
Pacific Islander alone

Income and house value in Stonybrook-Wilshire
- Median household income in 2022
- $102,119White non-Hispanic householders
- $86,688Black householders
- over $200,000American Indian and Alaska Native householders
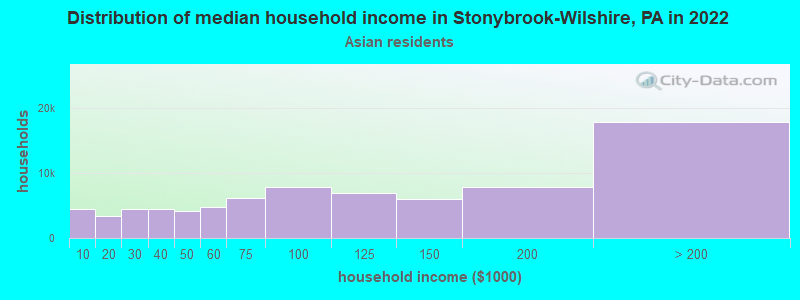
- $86,592Asian householders
- $89,523Some other race householders
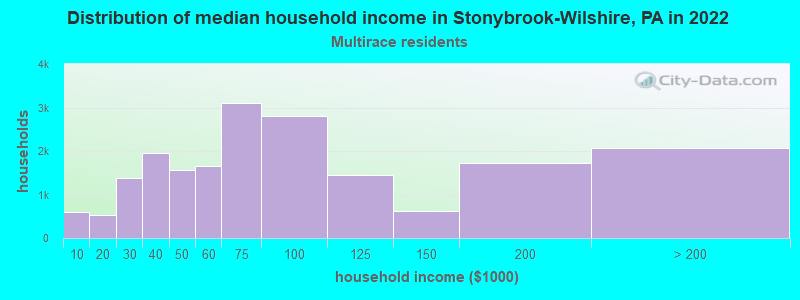
- $139,268Two or more races householders
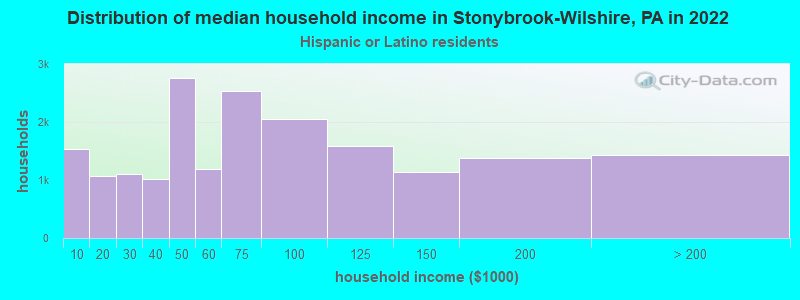
- $94,960Hispanic or Latino race householders
- Median 2022 house value
- $311,892White Non-Hispanic householders
- $296,872Black or African American householders
- $298,197Asian householders
- $248,498Some other race householders
- $165,665Two or more races householders
- $248,498Hispanic or Latino householders
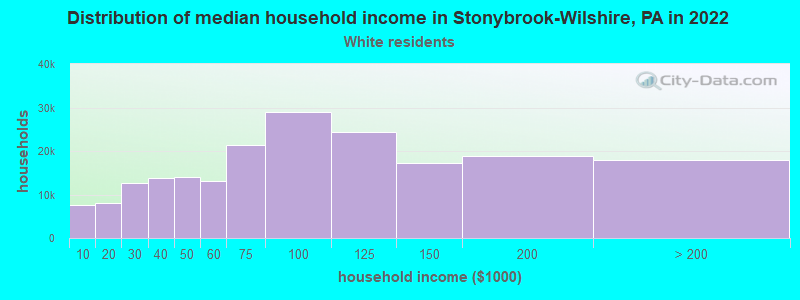
Household income for White non-Hispanic householders
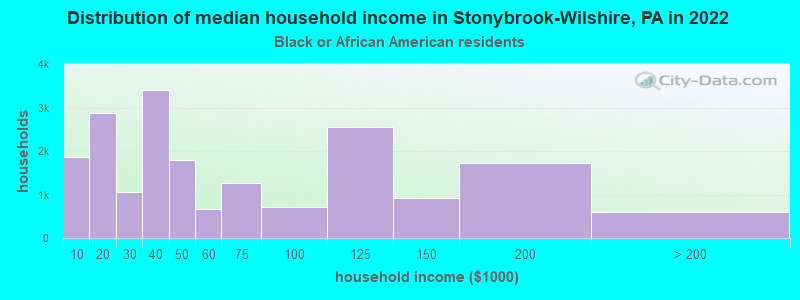
Household income for Black householders
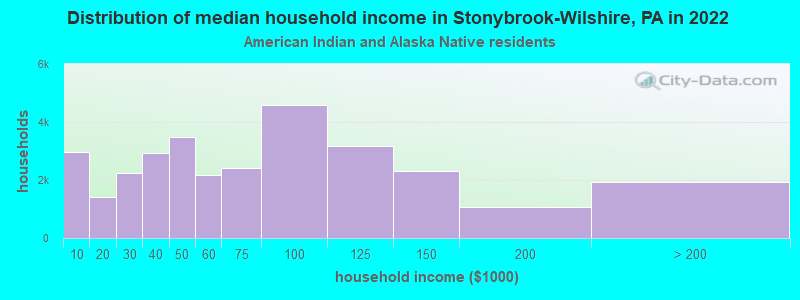
Household income for American Indian and Alaska Native householders
Household income for Asian householders
Household income for Two or more races householders
Household income for Hispanic or Latino race householders
Foreign-born residents in Stonybrook-Wilshire
255 residents are foreign born (2.5% Asia, 1.1% Europe, 0.7% Africa).
| This city: | 4.7% |
| Pennsylvania: | 4.1% |
Ancestries in Stonybrook-Wilshire

- 1,94732.7%German
- 73612.4%Other
- 65911.1%Irish
- 65110.9%English
- 5489.2%Italian
- 4507.6%United States
- 1933.2%Polish
- 1252.1%Scotch-Irish
- 1242.1%French
- 721.2%Scottish
- 701.2%Russian
- 661.1%Welsh
- 480.8%Greek
- 350.6%Dutch
- 340.6%Arab
- 340.6%Lithuanian
- 320.5%Swiss
- 290.5%Norwegian
- 270.5%French Canadian
- 240.4%Ukrainian
- 160.3%Swedish
- 130.2%Slovak
- 60.1%Czech
- 60.1%Danish
- 60.1%Hungarian

Zip codes: 17402.