Races in Stinnett, Wisconsin (WI) Detailed Stats
Ancestries, Foreign-born residents, place of birth
4.6% of Stinnett, WI residents are foreign-born (3.8% born in Latin America, 0.8% born in North America), which is 9.6% less than the foreign-born rate of 5.0% across the entire state of Wisconsin.
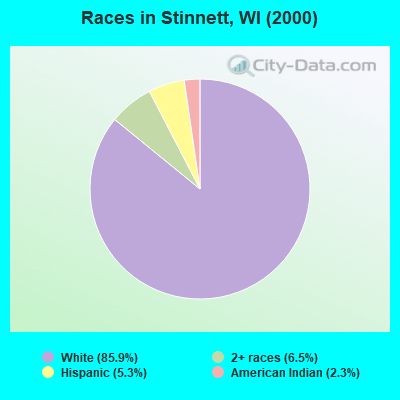
Race distribution in Stinnett

- 22685.9%White alone
- 176.5%Two or more races
- 145.3%Hispanic
- 62.3%American Indian alone
2000
2022
-
- 4,681,63087.3%White alone
- 300,2455.6%Black alone
- 192,9213.6%Hispanic
- 87,9951.6%Asian alone
- 51,9211.0%Two or more races
- 43,9800.8%American Indian alone
- 3,6370.07%Other race alone
- 1,3460.03%Native Hawaiian and Other
Pacific Islander alone

-
- 4,654,03179.0%White alone
- 447,0227.6%Hispanic
- 345,6785.9%Black alone
- 217,5323.7%Two or more races
- 172,2422.9%Asian alone
- 33,7620.6%American Indian alone
- 19,6800.3%Other race alone
- 2,5920.04%Native Hawaiian and Other
Pacific Islander alone

Income and house value in Stinnett
- Median household income in 2022
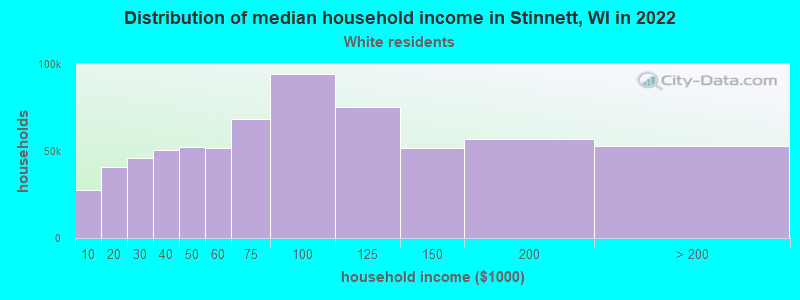
- $48,431White non-Hispanic householders
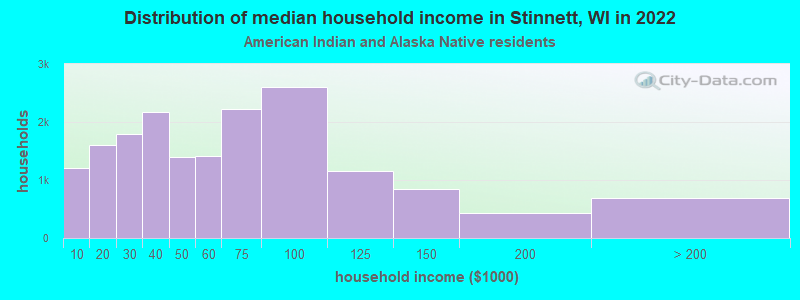
- $115,875American Indian and Alaska Native householders
- $36,087Some other race householders
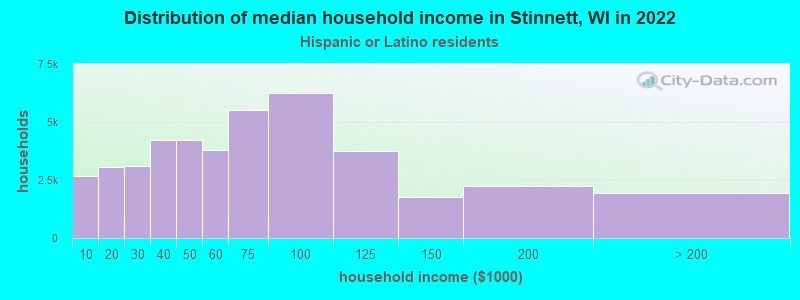
- $39,245Hispanic or Latino race householders
- Median 2022 house value
- $158,153White Non-Hispanic householders
- $241,553Some other race householders
- $241,553Hispanic or Latino householders
Household income for White non-Hispanic householders
Household income for American Indian and Alaska Native householders
Household income for Hispanic or Latino race householders
Foreign-born residents in Stinnett
12 residents are foreign born (3.8% Latin America, 0.8% North America).
| This city: | 4.6% |
| Wisconsin: | 3.6% |
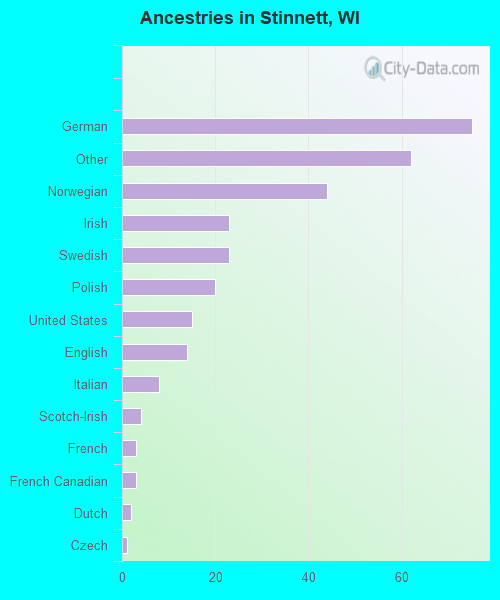
Ancestries in Stinnett

- 7525.3%German
- 6220.9%Other
- 4414.8%Norwegian
- 237.7%Irish
- 237.7%Swedish
- 206.7%Polish
- 155.1%United States
- 144.7%English
- 82.7%Italian
- 41.3%Scotch-Irish
- 31.0%French
- 31.0%French Canadian
- 20.7%Dutch
- 10.3%Czech
Zip codes: 54875.