Races in Steubenville, Ohio (OH) Detailed Stats
Data:
Races - White alone (%)
Races - White alone (% change since 2000)
Races - Black alone (%)
Races - Black alone (% change since 2000)
Races - American Indian alone (%)
Races - American Indian alone (% change since 2000)
Races - Asian alone (%)
Races - Asian alone (% change since 2000)
Races - Hispanic (%)
Races - Hispanic (% change since 2000)
Races - Native Hawaiian and Other Pacific Islander alone (%)
Races - Native Hawaiian and Other Pacific Islander alone (% change since 2000)
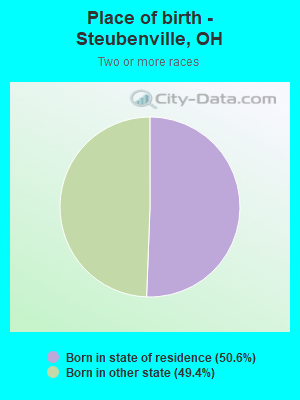
Races - Two or more races(%)
Races - Two or more races(% change since 2000)
Races - Other race alone (%)
Races - Other race alone (% change since 2000)
Racial diversity
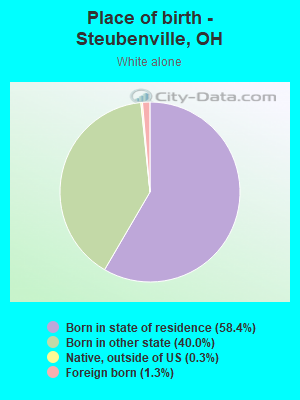
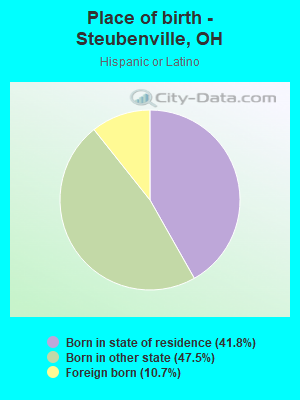
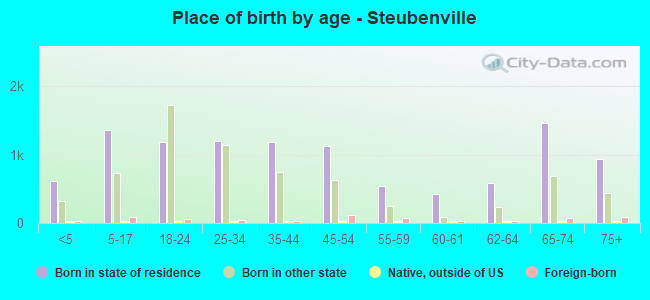
Place of birth - Born in state of residence (%)
Place of birth - Born in state of residence (%) - White
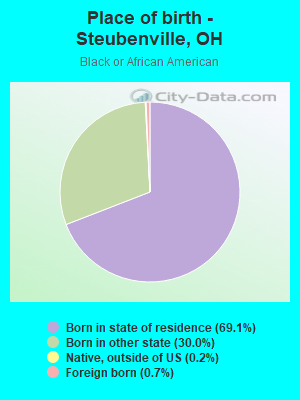
Place of birth - Born in state of residence (%) - Black or African American
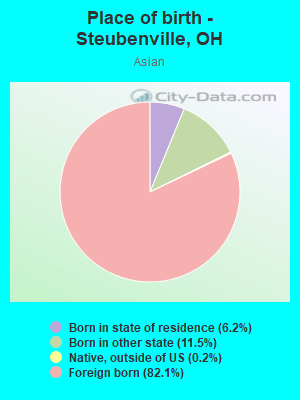
Place of birth - Born in state of residence (%) - Asian
Place of birth - Born in state of residence (%) - Hispanic or Latino
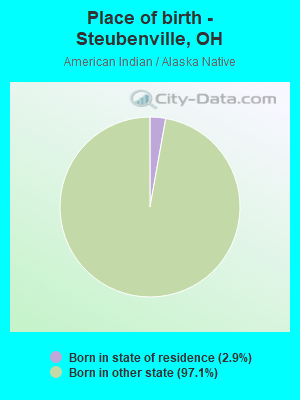
Place of birth - Born in state of residence (%) - American Indian and Alaska Native
Place of birth - Born in state of residence (%) - Multirace
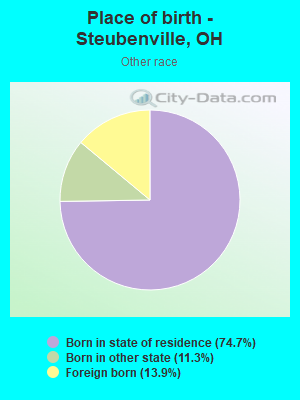
Place of birth - Born in state of residence (%) - Other Race
Place of birth - Born in other state (%)
Place of birth - Born in other state (%) - White
Place of birth - Born in other state (%) - Black or African American
Place of birth - Born in other state (%) - Asian
Place of birth - Born in other state (%) - Hispanic or Latino
Place of birth - Born in other state (%) - American Indian and Alaska Native
Place of birth - Born in other state (%) - Multirace
Place of birth - Born in other state (%) - Other Race
Place of birth - Native, outside of US (%)
Place of birth - Native, outside of US (%) - White
Place of birth - Native, outside of US (%) - Black or African American
Place of birth - Native, outside of US (%) - Asian
Place of birth - Native, outside of US (%) - Hispanic or Latino
Place of birth - Native, outside of US (%) - American Indian and Alaska Native
Place of birth - Native, outside of US (%) - Multirace
Place of birth - Native, outside of US (%) - Other Race
Place of birth - Foreign born (%)
Place of birth - Foreign born (%) - White
Place of birth - Foreign born (%) - Black or African American
Place of birth - Foreign born (%) - Asian
Place of birth - Foreign born (%) - Hispanic or Latino
Place of birth - Foreign born (%) - American Indian and Alaska Native
Place of birth - Foreign born (%) - Multirace
Place of birth - Foreign born (%) - Other Race
Residents speaking English at home (%)
Residents speaking English at home - Born in the United States (%)
Residents speaking English at home - Native, born elsewhere (%)
Residents speaking English at home - Foreign born (%)
Residents speaking Spanish at home (%)
Residents speaking Spanish at home - Born in the United States (%)
Residents speaking Spanish at home - Native, born elsewhere (%)
Residents speaking Spanish at home - Foreign born (%)
Residents speaking other language at home (%)
Residents speaking other language at home - Born in the United States (%)
Residents speaking other language at home - Native, born elsewhere (%)
Residents speaking other language at home - Foreign born (%)
Marital status - Never married (%)
Marital status - Now married (%)
Marital status - Separated (%)
Marital status - Widowed (%)
Marital status - Divorced (%)
Ancestries Reported - Arab (%)
Ancestries Reported - Czech (%)
Ancestries Reported - Danish (%)
Ancestries Reported - Dutch (%)
Ancestries Reported - English (%)
Ancestries Reported - French (%)
Ancestries Reported - French Canadian (%)
Ancestries Reported - German (%)
Ancestries Reported - Greek (%)
Ancestries Reported - Hungarian (%)
Ancestries Reported - Irish (%)
Ancestries Reported - Italian (%)
Ancestries Reported - Lithuanian (%)
Ancestries Reported - Norwegian (%)
Ancestries Reported - Polish (%)
Ancestries Reported - Portuguese (%)
Ancestries Reported - Russian (%)
Ancestries Reported - Scotch-Irish (%)
Ancestries Reported - Scottish (%)
Ancestries Reported - Slovak (%)
Ancestries Reported - Subsaharan African (%)
Ancestries Reported - Swedish (%)
Ancestries Reported - Swiss (%)
Ancestries Reported - Ukrainian (%)
Ancestries Reported - United States (%)
Ancestries Reported - Welsh (%)
Ancestries Reported - West Indian (%)
Ancestries Reported - Other (%)
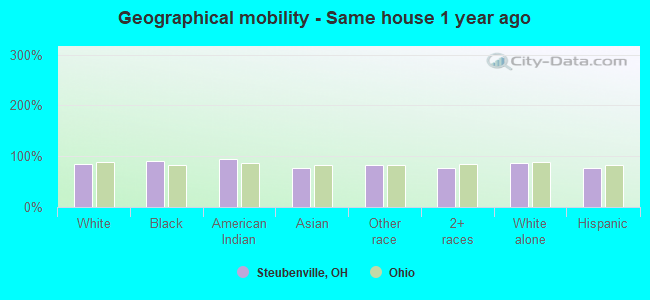
Geographical mobility - Same house 1 year ago (%)
Geographical mobility - Same house 1 year ago (%) - White
Geographical mobility - Same house 1 year ago (%) - Black or African American
Geographical mobility - Same house 1 year ago (%) - Asian
Geographical mobility - Same house 1 year ago (%) - Hispanic or Latino
Geographical mobility - Same house 1 year ago (%) - American Indian and Alaska Native
Geographical mobility - Same house 1 year ago (%) - Multirace
Geographical mobility - Same house 1 year ago (%) - Other Race
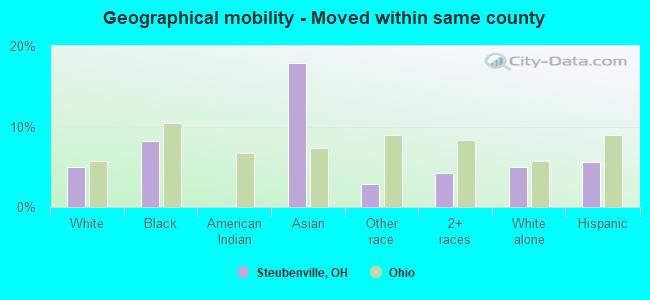
Geographical mobility - Moved within same county (%)
Geographical mobility - Moved within same county (%) - White
Geographical mobility - Moved within same county (%) - Black or African American
Geographical mobility - Moved within same county (%) - Asian
Geographical mobility - Moved within same county (%) - Hispanic or Latino
Geographical mobility - Moved within same county (%) - American Indian and Alaska Native
Geographical mobility - Moved within same county (%) - Multirace
Geographical mobility - Moved within same county (%) - Other Race
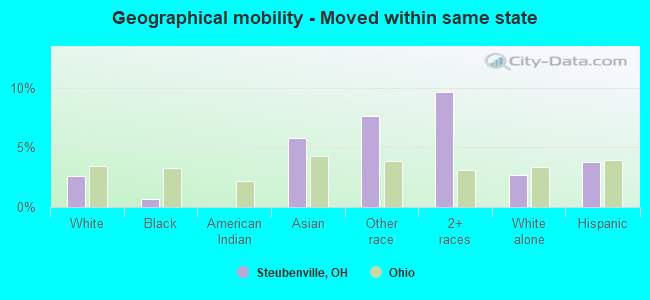
Geographical mobility - Moved from different county within same state (%)
Geographical mobility - Moved from different county within same state (%) - White
Geographical mobility - Moved from different county within same state (%) - Black or African American
Geographical mobility - Moved from different county within same state (%) - Asian
Geographical mobility - Moved from different county within same state (%) - Hispanic or Latino
Geographical mobility - Moved from different county within same state (%) - American Indian and Alaska Native
Geographical mobility - Moved from different county within same state (%) - Multirace
Geographical mobility - Moved from different county within same state (%) - Other Race
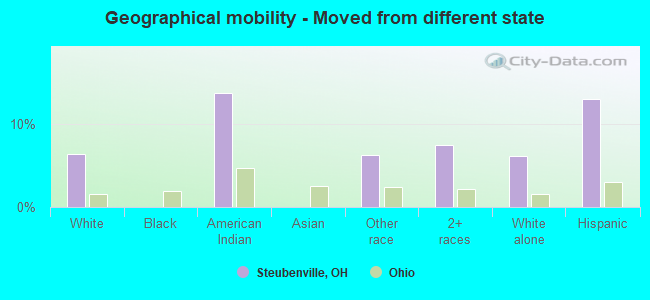
Geographical mobility - Moved from different state (%)
Geographical mobility - Moved from different state (%) - White
Geographical mobility - Moved from different state (%) - Black or African American
Geographical mobility - Moved from different state (%) - Asian
Geographical mobility - Moved from different state (%) - Hispanic or Latino
Geographical mobility - Moved from different state (%) - American Indian and Alaska Native
Geographical mobility - Moved from different state (%) - Multirace
Geographical mobility - Moved from different state (%) - Other Race
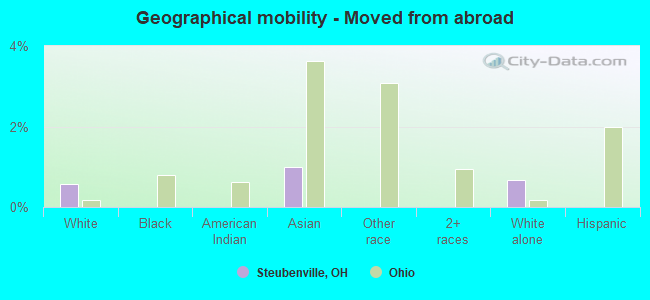
Geographical mobility - Moved from abroad (%)
Geographical mobility - Moved from abroad (%) - White
Geographical mobility - Moved from abroad (%) - Black or African American
Geographical mobility - Moved from abroad (%) - Asian
Geographical mobility - Moved from abroad (%) - Hispanic or Latino
Geographical mobility - Moved from abroad (%) - American Indian and Alaska Native
Geographical mobility - Moved from abroad (%) - Multirace
Geographical mobility - Moved from abroad (%) - Other Race
Place of birth for the foreign-born population - Ireland (%)
Place of birth for the foreign-born population - Denmark (%)
Place of birth for the foreign-born population - Norway (%)
Place of birth for the foreign-born population - Sweden (%)
Place of birth for the foreign-born population - United Kingdom (%)
Place of birth for the foreign-born population - England (%)
Place of birth for the foreign-born population - Scotland (%)
Place of birth for the foreign-born population - Other Northern Europe (%)
Place of birth for the foreign-born population - Austria (%)
Place of birth for the foreign-born population - Belgium (%)
Place of birth for the foreign-born population - France (%)
Place of birth for the foreign-born population - Germany (%)
Place of birth for the foreign-born population - Netherlands (%)
Place of birth for the foreign-born population - Switzerland (%)
Place of birth for the foreign-born population - Other Western Europe (%)
Place of birth for the foreign-born population - Greece (%)
Place of birth for the foreign-born population - Italy (%)
Place of birth for the foreign-born population - Portugal (%)
Place of birth for the foreign-born population - Spain (%)
Place of birth for the foreign-born population - Other Southern Europe (%)
Place of birth for the foreign-born population - Albania (%)
Place of birth for the foreign-born population - Belarus (%)
Place of birth for the foreign-born population - Bosnia and Herzegovina (%)
Place of birth for the foreign-born population - Bulgaria (%)
Place of birth for the foreign-born population - Croatia (%)
Place of birth for the foreign-born population - Czechoslovakia (%)
Place of birth for the foreign-born population - Hungary (%)
Place of birth for the foreign-born population - Latvia (%)
Place of birth for the foreign-born population - Lithuania (%)
Place of birth for the foreign-born population - North Macedonia (Macedonia) (%)
Place of birth for the foreign-born population - Moldova (%)
Place of birth for the foreign-born population - Poland (%)
Place of birth for the foreign-born population - Romania (%)
Place of birth for the foreign-born population - Russia (%)
Place of birth for the foreign-born population - Serbia (%)
Place of birth for the foreign-born population - Ukraine (%)
Place of birth for the foreign-born population - Other Eastern Europe (%)
Place of birth for the foreign-born population - China (%)
Place of birth for the foreign-born population - Hong Kong (%)
Place of birth for the foreign-born population - Taiwan (%)
Place of birth for the foreign-born population - Japan (%)
Place of birth for the foreign-born population - Korea (%)
Place of birth for the foreign-born population - Other Eastern Asia (%)
Place of birth for the foreign-born population - Afghanistan (%)
Place of birth for the foreign-born population - Bangladesh (%)
Place of birth for the foreign-born population - India (%)
Place of birth for the foreign-born population - Iran (%)
Place of birth for the foreign-born population - Kazakhstan (%)
Place of birth for the foreign-born population - Nepal (%)
Place of birth for the foreign-born population - Pakistan (%)
Place of birth for the foreign-born population - Sri Lanka (%)
Place of birth for the foreign-born population - Uzbekistan (%)
Place of birth for the foreign-born population - Other South Central Asia (%)
Place of birth for the foreign-born population - Burma (%)
Place of birth for the foreign-born population - Cambodia (%)
Place of birth for the foreign-born population - Indonesia (%)
Place of birth for the foreign-born population - Laos (%)
Place of birth for the foreign-born population - Malaysia (%)
Place of birth for the foreign-born population - Philippines (%)
Place of birth for the foreign-born population - Singapore (%)
Place of birth for the foreign-born population - Thailand (%)
Place of birth for the foreign-born population - Vietnam (%)
Place of birth for the foreign-born population - Other South Eastern Asia (%)
Place of birth for the foreign-born population - Armenia (%)
Place of birth for the foreign-born population - Iraq (%)
Place of birth for the foreign-born population - Israel (%)
Place of birth for the foreign-born population - Jordan (%)
Place of birth for the foreign-born population - Kuwait (%)
Place of birth for the foreign-born population - Lebanon (%)
Place of birth for the foreign-born population - Saudi Arabia (%)
Place of birth for the foreign-born population - Syria (%)
Place of birth for the foreign-born population - Turkey (%)
Place of birth for the foreign-born population - Yemen (%)
Place of birth for the foreign-born population - Other Western Asia (%)
Place of birth for the foreign-born population - Eritrea (%)
Place of birth for the foreign-born population - Ethiopia (%)
Place of birth for the foreign-born population - Kenya (%)
Place of birth for the foreign-born population - Somalia (%)
Place of birth for the foreign-born population - Uganda (%)
Place of birth for the foreign-born population - Zimbabwe (%)
Place of birth for the foreign-born population - Other Eastern Africa (%)
Place of birth for the foreign-born population - Cameroon (%)
Place of birth for the foreign-born population - Congo (%)
Place of birth for the foreign-born population - Democratic Republic of Congo (Zaire) (%)
Place of birth for the foreign-born population - Other Middle Africa (%)
Place of birth for the foreign-born population - Egypt (%)
Place of birth for the foreign-born population - Morocco (%)
Place of birth for the foreign-born population - Sudan (%)
Place of birth for the foreign-born population - Other Northern Africa (%)
Place of birth for the foreign-born population - South Africa (%)
Place of birth for the foreign-born population - Other Southern Africa (%)
Place of birth for the foreign-born population - Cabo Verde (%)
Place of birth for the foreign-born population - Ghana (%)
Place of birth for the foreign-born population - Liberia (%)
Place of birth for the foreign-born population - Nigeria (%)
Place of birth for the foreign-born population - Senegal (%)
Place of birth for the foreign-born population - Sierra Leone (%)
Place of birth for the foreign-born population - Other Western Africa (%)
Place of birth for the foreign-born population - Australia (%)
Place of birth for the foreign-born population - New Zealand (%)
Place of birth for the foreign-born population - Fiji (%)
Place of birth for the foreign-born population - Micronesia (%)
Place of birth for the foreign-born population - Bahamas (%)
Place of birth for the foreign-born population - Barbados (%)
Place of birth for the foreign-born population - Cuba (%)
Place of birth for the foreign-born population - Dominica (%)
Place of birth for the foreign-born population - Dominican Republic (%)
Place of birth for the foreign-born population - Grenada (%)
Place of birth for the foreign-born population - Haiti (%)
Place of birth for the foreign-born population - Jamaica (%)
Place of birth for the foreign-born population - St. Vincent and the Grenadines (%)
Place of birth for the foreign-born population - Trinidad and Tobago (%)
Place of birth for the foreign-born population - West Indies (%)
Place of birth for the foreign-born population - Other Caribbean (%)
Place of birth for the foreign-born population - Belize (%)
Place of birth for the foreign-born population - Costa Rica (%)
Place of birth for the foreign-born population - El Salvador (%)
Place of birth for the foreign-born population - Guatemala (%)
Place of birth for the foreign-born population - Honduras (%)
Place of birth for the foreign-born population - Mexico (%)
Place of birth for the foreign-born population - Nicaragua (%)
Place of birth for the foreign-born population - Panama (%)
Place of birth for the foreign-born population - Other Central America (%)
Place of birth for the foreign-born population - Argentina (%)
Place of birth for the foreign-born population - Bolivia (%)
Place of birth for the foreign-born population - Brazil (%)
Place of birth for the foreign-born population - Chile (%)
Place of birth for the foreign-born population - Colombia (%)
Place of birth for the foreign-born population - Ecuador (%)
Place of birth for the foreign-born population - Guyana (%)
Place of birth for the foreign-born population - Peru (%)
Place of birth for the foreign-born population - Uruguay (%)
Place of birth for the foreign-born population - Venezuela (%)
Place of birth for the foreign-born population - Other South America (%)
Place of birth for the foreign-born population - Canada (%)
Place of birth for the foreign-born population - Other Northern America (%)
Place of birth for the foreign-born population - Other (%)
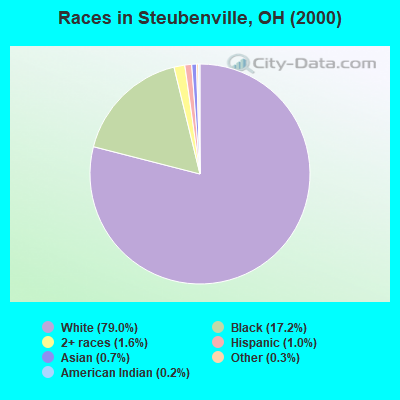
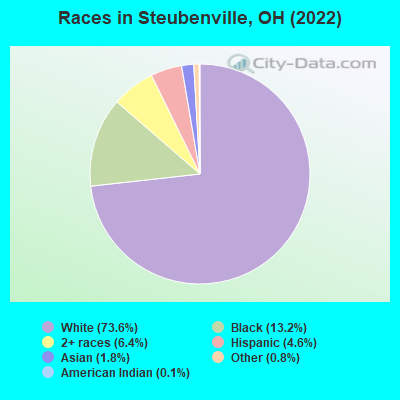
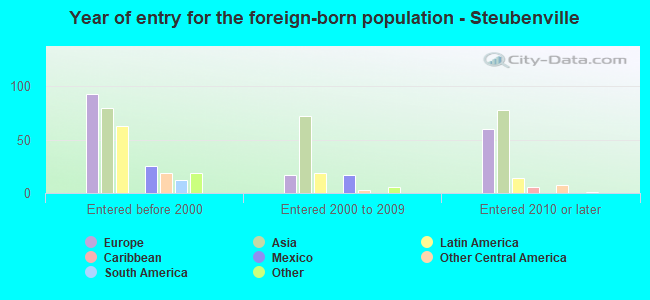
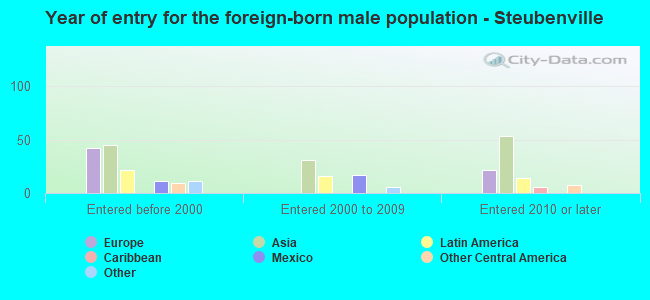
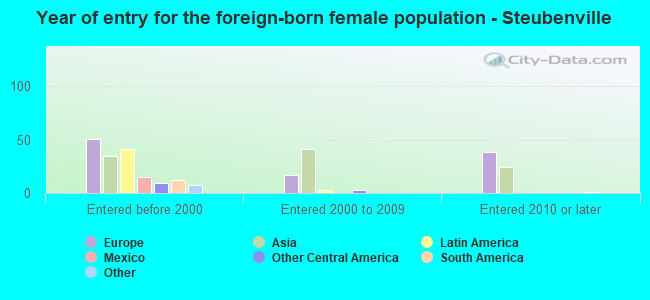
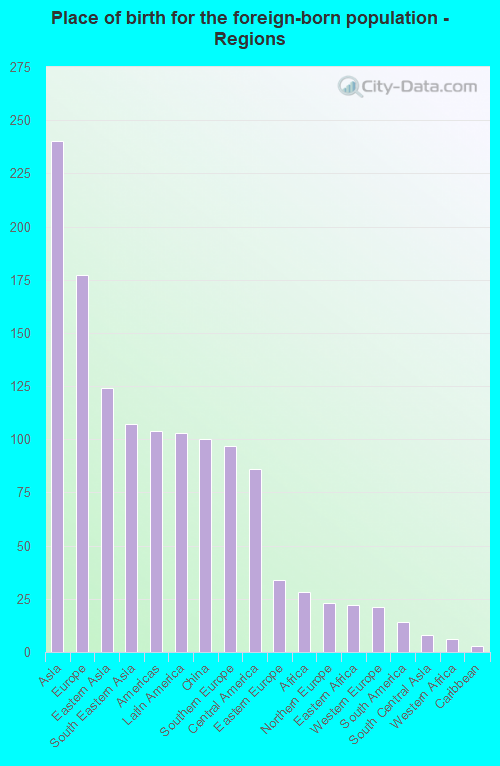
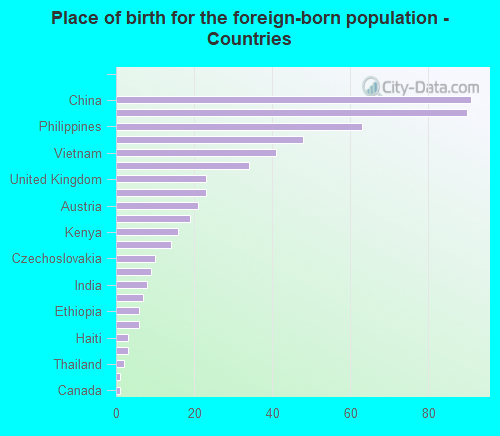
According to 2022 data, the most numerous races in Steubenville, OH are White alone (13,361 residents), Black alone (2,392 residents), and Two or more races (1,162 residents). 94.9% of Steubenville residents speak English at home. 3.0% of Steubenville, OH residents are foreign-born (1.3% born in Asia, 0.9% born in Europe, 0.6% born in Latin America), which is 32.0% less than the foreign-born rate of 4.0% across the entire state of Ohio.
Race distribution in Steubenville
2000 2022
9,538,111 84.0% White alone 1,290,662 11.4% Black alone 217,123 1.9% Hispanic 137,770 1.2% Two or more races 131,670 1.2% Asian alone 21,985 0.2% American Indian alone 13,483 0.1% Other race alone 2,336 0.02% Native Hawaiian and Other
8,948,793 76.1% White alone 1,401,403 11.9% Black alone 529,291 4.5% Two or more races 517,232 4.4% Hispanic 293,387 2.5% Asian alone 52,805 0.4% Other race alone 9,785 0.08% American Indian alone 3,362 0.03% Native Hawaiian and Other
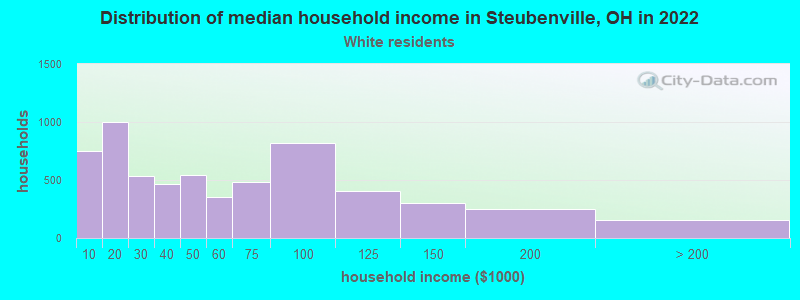
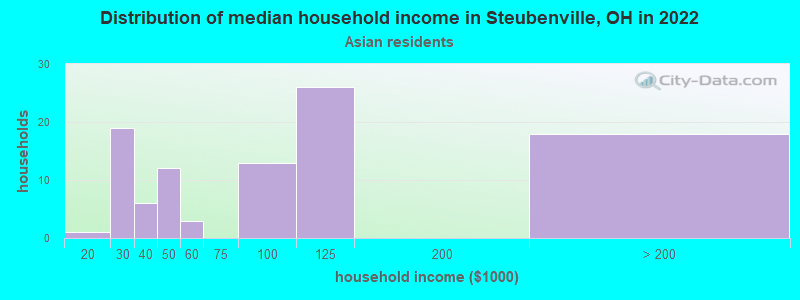
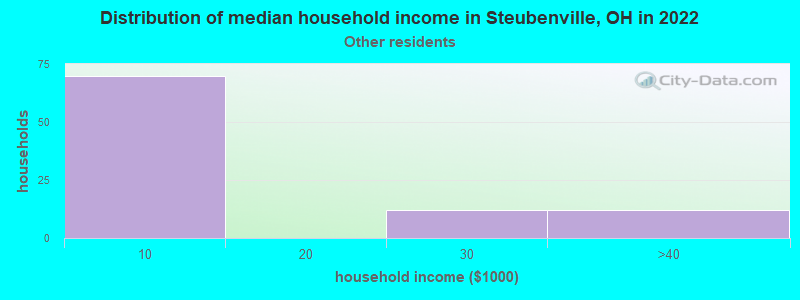
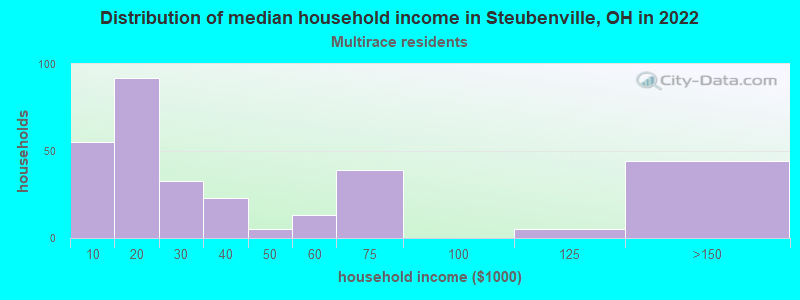
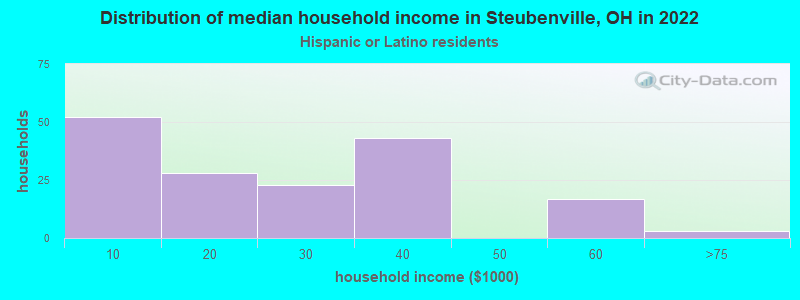
Income and house value in Steubenville Median household income in 2022 $45,623 White non-Hispanic householders$27,859 Black householders$79,963 Asian householders$9,496 Some other race householders$23,582 Two or more races householdersMedian 2022 house value $139,761 White Non-Hispanic householders$75,812 Black or African American householders $236,286 Asian householders$93,911 Two or more races householders$365,591 Hispanic or Latino householders
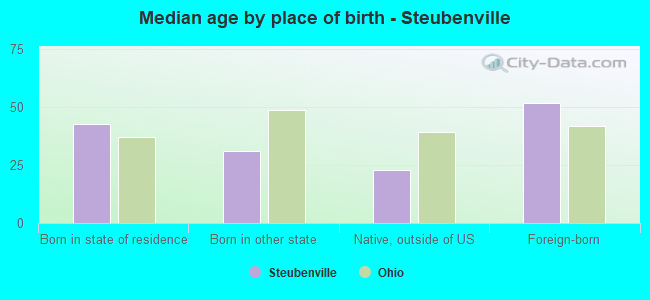
Median age by race in Steubenville
39.3 Median age for White residents38.5 40.0 41.3 Median age for Black or African American residents40.1 43.3 20.0 Median age for American Indian / Alaska Native residents20.0 -658,163,264.6 34.2 Median age for Asian residents31.3 56.1 -800,387,596.1 Median age for Native Hawaiian / Pacific Islander residents-750,242,953.6 -805,394,989.6 20.9 Median age for Other race residents40.8 16.3 23.2 Median age for Two or more races residents22.9 23.5 40.1 Median age for White alone residents39.0 40.9 21.9 Median age for Hispanic or Latino residents21.5 22.4
Owner/renter occupied households by race in Steubenville
House owners and renters - White residents 3,635 60.8% Owner occupied2,339 39.2% Renter occupiedHouse owners and renters - Black or African American residents 341 34.2% Owner occupied657 65.8% Renter occupiedHouse owners and renters - American Indian / Alaska Native residents 1 100.0% Owner occupiedHouse owners and renters - Asian residents 76 73.7% Owner occupied27 26.3% Renter occupiedHouse owners and renters - Other race residents 83 100.0% Renter occupiedHouse owners and renters - Two or more races residents 98 31.0% Owner occupied217 69.0% Renter occupiedHouse owners and renters - White alone residents 3,630 60.9% Owner occupied2,331 39.1% Renter occupiedHouse owners and renters - Hispanic or Latino residents 18 12.2% Owner occupied133 87.8% Renter occupied
Language usage in Steubenville
English speakers - Total 94.9% of residents of Steubenville speak English at home.
2.5% of residents speak Spanish at home 305 71.8% Speak English very well120 28.2% Speak English less than very well2.5% of residents speak other language at home 287 66.9% Speak English very well142 33.1% Speak English less than very well
English speakers - Born in the United States 96.9% of residents of Steubenville speak English at home.
2.4% of residents speak Spanish at home 107 68.2% Speak English very well50 31.8% Speak English less than very well0.7% of residents speak other language at home 41 89.1% Speak English very well5 10.9% Speak English less than very well
English speakers - Native, born elsewhere 45.2% of residents of Steubenville speak English at home.
54.8% of residents speak other language at home 23 100.0% Speak English very well
English speakers - Foreign-born 36.3% of residents of Steubenville speak English at home.
13.1% of residents speak Spanish at home 36 50.0% Speak English very well36 50.0% Speak English less than very well49.5% of residents speak other language at home 139 50.9% Speak English very well134 49.1% Speak English less than very well
White (Caucasian) - Speak only English Native:
97.2% (12,556)Foreign-born:
57.0% (112)
White (Caucasian) - Speak another language Native:
2.8% (360)Foreign-born:
45.9% (90)
Black or African American - Speak only English Native:
99.8% (2,171)Foreign-born:
43.2% (7)
Asian - Speak only English Native:
93.5% (53)Foreign-born:
21.7% (57)
Asian - Speak another language Native:
8.9% (5)Foreign-born:
77.5% (202)
Other race - Speak only English Native:
76.0% (224)Foreign-born:
28.8% (14)
Other race - Speak another language Native:
22.5% (66)Foreign-born:
65.1% (32)
White alone - Speak only English Native:
98.0% (12,413)Foreign-born:
64.9% (115)
White alone - Speak another language Native:
2.0% (258)Foreign-born:
35.8% (63)
Hispanic or Latino - Speak only English Native:
63.8% (399)Foreign-born:
17.0% (15)
Hispanic or Latino - Speak another language Native:
36.2% (226)Foreign-born:
82.6% (74)
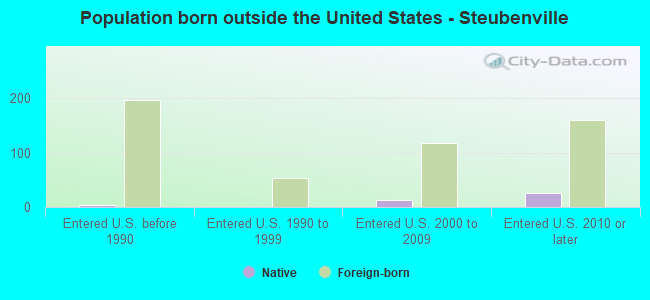
Foreign-born residents in Steubenville 550 residents are foreign born (1.3% Asia , 0.9% Europe , 0.6% Latin America ).
Marital status for residents in Steubenville Marital status - White (Caucasian) population 15 years and over
Males 43.9% Never married38.1% Now married1.3% Separated3.1% Widowed13.6% DivorcedFemales 38.3% Never married33.9% Now married1.0% Separated12.5% Widowed14.2% DivorcedWomen who gave birth in the past 12 months Now married:
79.5% (68)Unmarried:
20.5% (17)
Women who did not give birth in the past 12 months Now married:
29.5% (956)Unmarried:
70.5% (2,284)
Marital status - Black or African American population 15 years and over
Males 52.1% Never married26.2% Now married0.5% Separated5.1% Widowed16.0% DivorcedFemales 56.8% Never married22.5% Now married3.8% Separated6.5% Widowed10.5% DivorcedWomen who gave birth in the past 12 months Now married:
9.1% (2)Unmarried:
90.9% (20)
Women who did not give birth in the past 12 months Now married:
17.8% (96)Unmarried:
82.2% (442)
Marital status - American Indian / Alaska Native population 15 years and over
Males 100.0% Never married0.0% Now married0.0% Separated0.0% Widowed0.0% DivorcedFemales 100.0% Never married0.0% Now married0.0% Separated0.0% Widowed0.0% DivorcedWomen who did not give birth in the past 12 months Now married:
0.0% (0)Unmarried:
100.0% (7)
Marital status - Asian population 15 years and over
Males 48.6% Never married35.4% Now married16.0% Separated0.0% Widowed0.0% DivorcedFemales 17.3% Never married36.5% Now married12.5% Separated32.7% Widowed1.0% DivorcedWomen who gave birth in the past 12 months Now married:
100.0% (13)Unmarried:
0.0% (0)
Women who did not give birth in the past 12 months Now married:
61.9% (13)Unmarried:
38.1% (8)
Marital status - Other race population 15 years and over
Males 79.8% Never married3.7% Now married10.1% Separated0.0% Widowed6.4% DivorcedFemales 68.8% Never married0.0% Now married11.3% Separated0.0% Widowed19.9% DivorcedWomen who did not give birth in the past 12 months Now married:
14.2% (21)Unmarried:
85.8% (128)
Marital status - Two or more races population 15 years and over
Males 83.9% Never married15.5% Now married0.0% Separated0.0% Widowed0.6% DivorcedFemales 50.8% Never married39.0% Now married0.0% Separated0.0% Widowed10.2% DivorcedWomen who did not give birth in the past 12 months Now married:
15.4% (40)Unmarried:
84.6% (220)
Marital status - White alone, not Hispanic / Latino population 15 years and over
Males 43.4% Never married38.8% Now married1.3% Separated3.2% Widowed13.3% DivorcedFemales 36.9% Never married34.6% Now married1.1% Separated12.7% Widowed14.6% DivorcedWomen who gave birth in the past 12 months Now married:
79.5% (68)Unmarried:
20.5% (18)
Women who did not give birth in the past 12 months Now married:
30.9% (966)Unmarried:
69.1% (2,160)
Marital status - Hispanic or Latino population 15 years and over
Males 68.0% Never married7.7% Now married5.0% Separated0.0% Widowed19.4% DivorcedFemales 65.1% Never married22.9% Now married3.9% Separated1.4% Widowed6.7% DivorcedWomen who did not give birth in the past 12 months Now married:
5.6% (17)Unmarried:
94.4% (286)
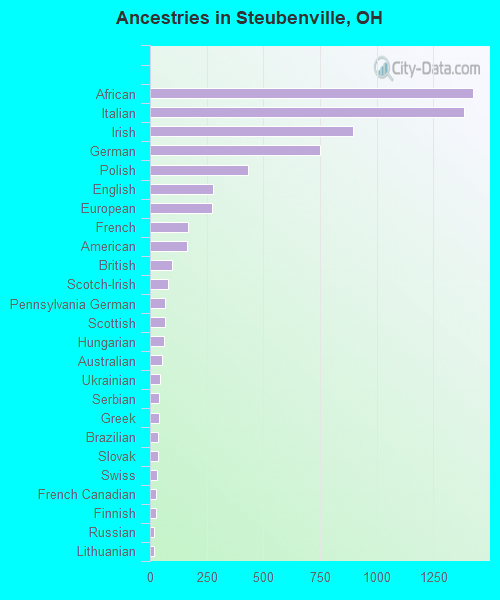
Ancestries in Steubenville
1,425 17.0% African1,385 16.5% Italian898 10.7% Irish749 8.9% German432 5.1% Polish278 3.3% English273 3.2% European169 2.0% French165 2.0% American99 1.2% British78 0.9% Scotch-Irish68 0.8% Pennsylvania German68 0.8% Scottish62 0.7% Hungarian54 0.6% Australian42 0.5% Ukrainian39 0.5% Serbian38 0.5% Greek35 0.4% Brazilian34 0.4% Slovak33 0.4% Swiss27 0.3% French Canadian26 0.3% Finnish19 0.2% Russian18 0.2% Lithuanian16 0.2% Czechoslovakian12 0.1% Romanian11 0.1% Northern European10 0.1% Israeli9 0.1% Dutch9 0.1% Nigerian6 0.07% Syrian6 0.07% Welsh6 0.07% Haitian5 0.06% Eastern European3 0.04% Slavic2 0.02% Swedish1 0.01% Austrian
Children Nativity (place of birth) in Steubenville
Children under 6 years - Living with two parents Both parents native 735 100.0% NativeChildren under 6 years - Living with one parent Native parent 427 100.0% NativeForeign-born parent 8 100.0% NativeChildren 6 to 17 years - Living with two parents Both parents native 938 100.0% NativeBoth parents foreign-born 19 19.7% Native76 80.3% Foreign-bornOne native, one foreign-born parent 20 56.7% Native15 43.3% Foreign-bornChildren 6 to 17 years - Living with one parent Native parent 751 100.0% Native
Grandparents responsible for own grandchildren in Steubenville
Grandparents (30 to 59 years) White / Caucasian 11 100.0% Not responsible for grandchildrenBlack or African American 70 72.1% Responsible for grandchildren27 27.9% Not responsible for grandchildrenHispanic or Latino 13 100.0% Not responsible for grandchildrenGrandparents (60 years and over) White / Caucasian 16 42.2% Responsible for grandchildren22 57.8% Not responsible for grandchildrenBlack or African American 5 27.8% Responsible for grandchildren13 72.2% Not responsible for grandchildrenHispanic or Latino 13 100.0% Not responsible for grandchildren