Races in Staten Island, New York (NY) Detailed Stats
Ancestries, Foreign-born residents, place of birth
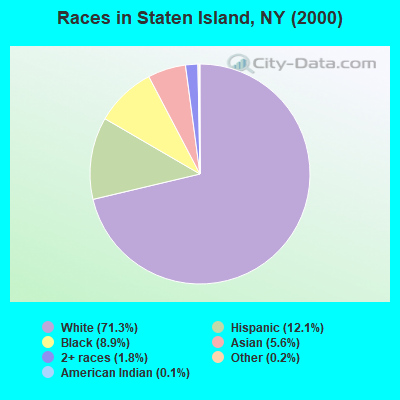
Race distribution in Staten Island

- 316,31671.3%White alone
- 53,55012.1%Hispanic
- 39,7048.9%Black alone
- 24,7865.6%Asian alone
- 7,7971.8%Two or more races
- 8570.2%Other race alone
- 5990.1%American Indian alone
- 1190.03%Native Hawaiian and Other
Pacific Islander alone
2000
2022
-
- 11,760,98162.0%White alone
- 2,867,58315.1%Hispanic
- 2,812,62314.8%Black alone
- 1,035,9265.5%Asian alone
- 366,1161.9%Two or more races
- 75,4990.4%Other race alone
- 52,4990.3%American Indian alone
- 5,2300.03%Native Hawaiian and Other
Pacific Islander alone

-
- 10,408,93352.9%White alone
- 3,867,29919.7%Hispanic
- 2,633,84013.4%Black alone
- 1,776,2869.0%Asian alone
- 732,6703.7%Two or more races
- 216,1101.1%Other race alone
- 35,0820.2%American Indian alone
- 6,9310.04%Native Hawaiian and Other
Pacific Islander alone

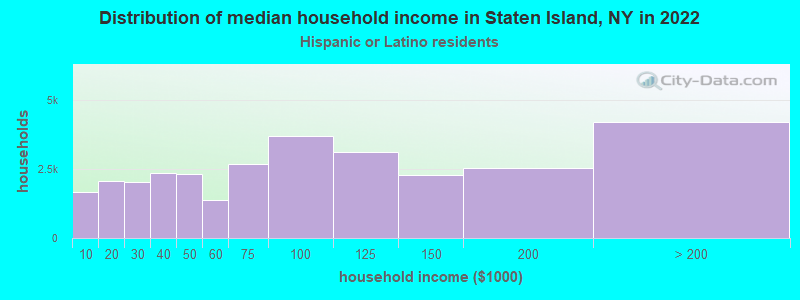
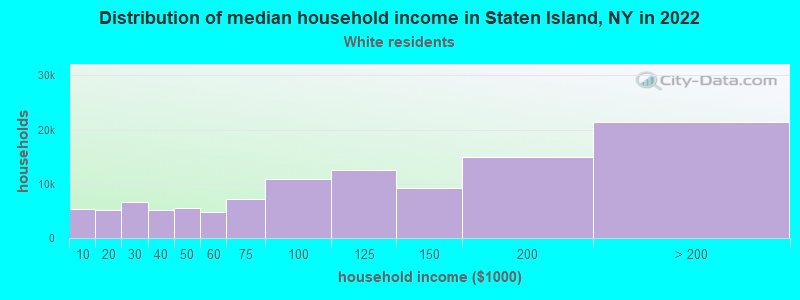
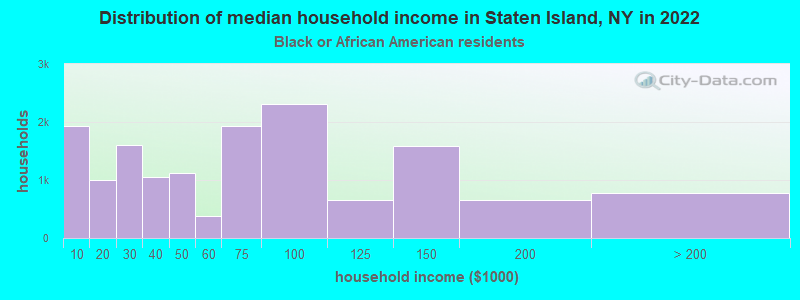
Income and house value in Staten Island
- Median household income in 2022
- $105,692White non-Hispanic householders
- $64,063Black householders
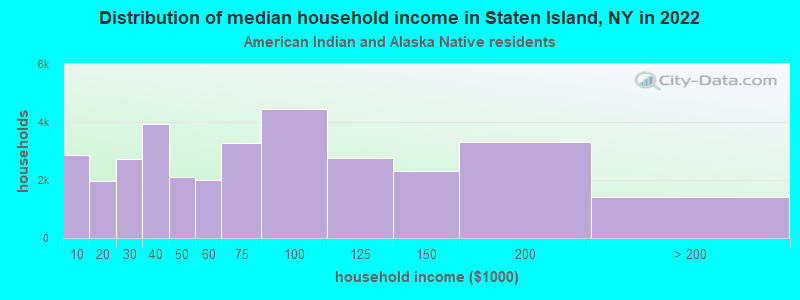
- $75,000American Indian and Alaska Native householders
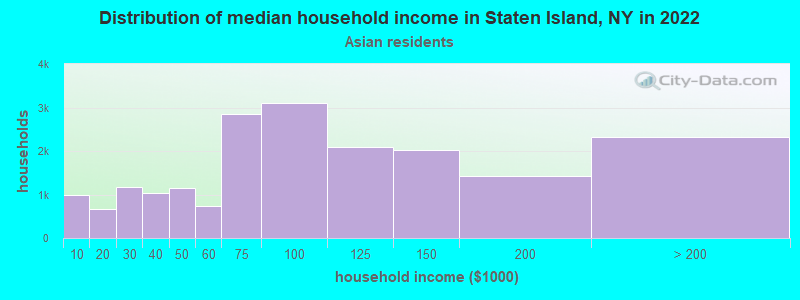
- $83,649Asian householders
- $73,770Some other race householders
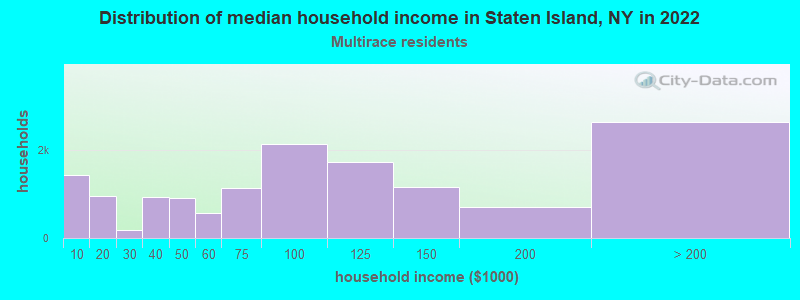
- $89,561Two or more races householders
- $78,165Hispanic or Latino race householders
- Median 2022 house value
- $635,529White Non-Hispanic householders
- $444,724Black or African American householders
- $494,398American Indian or Alaska Native householders
- $562,188Asian householders
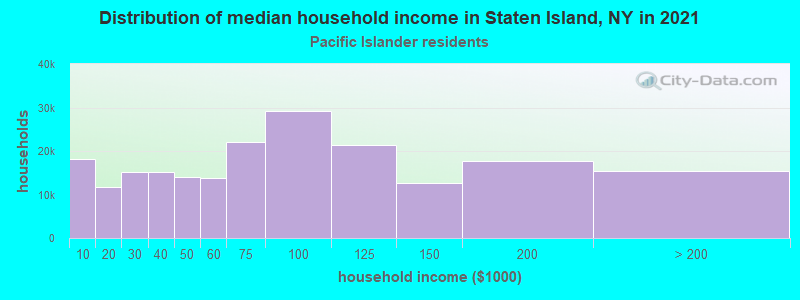
- $745,103Native Hawaiian and other Pacific Islander householders
- $484,171Some other race householders
- $515,436Two or more races householders
- $505,794Hispanic or Latino householders
Household income for White non-Hispanic householders
Household income for Black householders
Household income for American Indian and Alaska Native householders
Household income for Asian householders
Household income for Native Hawaiian and other Pacific Islander householders
Household income for Two or more races householders
Household income for Hispanic or Latino race householders