Races in St. Lucie, Florida (FL) Detailed Stats
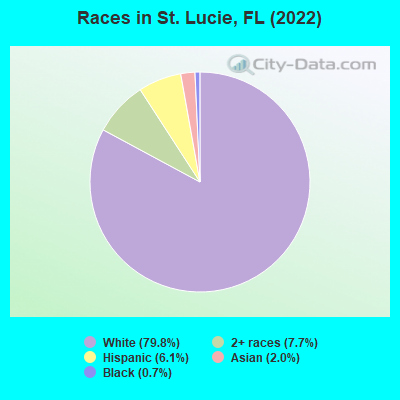
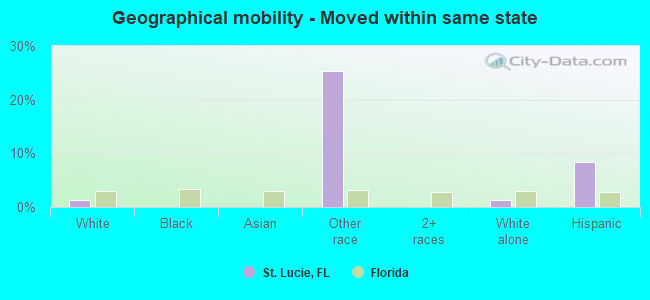
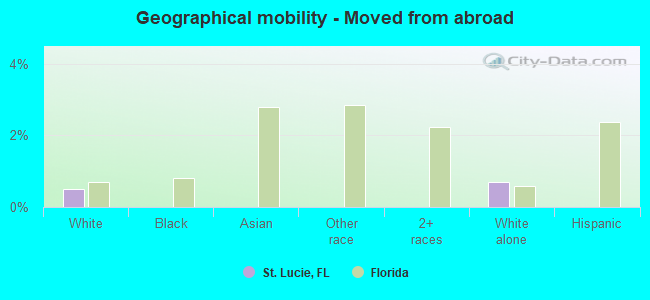
According to 2022 data, the most numerous races in St. Lucie, FL are White alone (717 residents), Hispanic (55 residents), and Black alone (6 residents). 95.2% of St. Lucie residents speak English at home. 2.3% of St. Lucie, FL residents are foreign-born (1.0% born in Latin America, 0.8% born in Asia), which is 798.0% less than the foreign-born rate of 21.0% across the entire state of Florida.
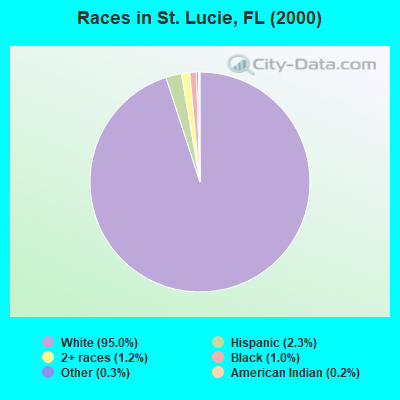
Race distribution in St. Lucie
2000 2022
10,458,509 65.4% White alone 2,682,715 16.8% Hispanic 2,264,268 14.2% Black alone 261,693 1.6% Asian alone 236,954 1.5% Two or more races 42,358 0.3% American Indian alone 28,994 0.2% Other race alone 6,887 0.04% Native Hawaiian and Other
11,309,403 50.8% White alone 6,025,039 27.1% Hispanic 3,241,015 14.6% Black alone 861,630 3.9% Two or more races 623,692 2.8% Asian alone 152,054 0.7% Other race alone 22,504 0.1% American Indian alone 9,486 0.04% Native Hawaiian and Other
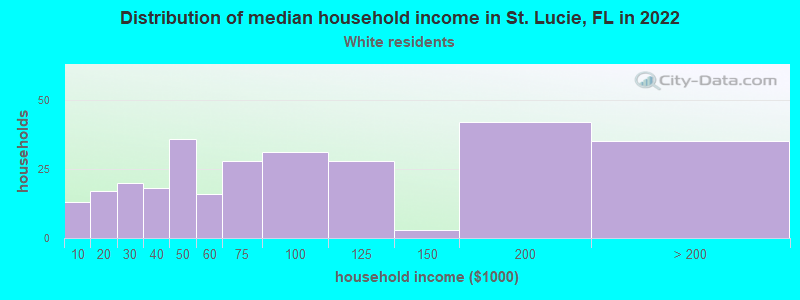
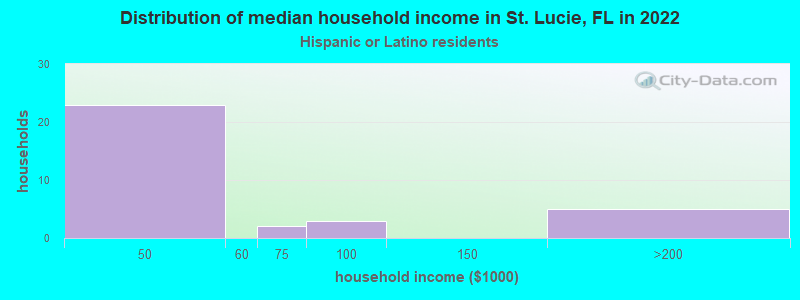
Income and house value in St. Lucie Median household income in 2022 $66,662 White non-Hispanic householdersMedian 2022 house value $549,808 White Non-Hispanic householders$412,985 Two or more races householders
Median age by race in St. Lucie
58.2 Median age for White residents55.8 59.7 -657,458,562.9 Median age for Black or African American residents-682,682,682.0 -645,446,506.9 -598,566,307.6 Median age for American Indian / Alaska Native residents-611,418,047.3 -594,925,633.7 20.2 Median age for Asian residents-717,695,472.5 19.6 -660,215,053.1 Median age for Native Hawaiian / Pacific Islander residents-662,309,367.5 -668,008,047.6 14.1 Median age for Other race residents12.5 -788,065,842.8 12.9 Median age for Two or more races residents6.1 38.2 58.0 Median age for White alone residents56.1 60.0 36.6 Median age for Hispanic or Latino residents37.5 36.1
Owner/renter occupied households by race in St. Lucie
House owners and renters - White residents 238 82.7% Owner occupied50 17.3% Renter occupiedHouse owners and renters - Other race residents 5 100.0% Owner occupiedHouse owners and renters - Two or more races residents 10 100.0% Owner occupiedHouse owners and renters - White alone residents 232 80.9% Owner occupied55 19.1% Renter occupiedHouse owners and renters - Hispanic or Latino residents 20 100.0% Owner occupied
Language usage in St. Lucie
English speakers - Total 95.2% of residents of St. Lucie speak English at home.
2.4% of residents speak Spanish at home 20 100.0% Speak English very well0.6% of residents speak other language at home 5 100.0% Speak English very well
All residents speak only English at home
English speakers - Native, born elsewhere 85.7% of residents of St. Lucie speak English at home.
English speakers - Foreign-born 52.4% of residents of St. Lucie speak English at home.
9.5% of residents speak Spanish at home 2 100.0% Speak English very well23.8% of residents speak other language at home 5 100.0% Speak English very well
White (Caucasian) - Speak only English Native:
99.0% (687)Foreign-born:
61.7% (3)
White (Caucasian) - Speak another language Native:
1.7% (12)Foreign-born:
47.6% (3)
Asian - Speak only English Native:
98.5% (14)Foreign-born:
57.2% (3)
Two or more races - Speak only English Native:
100.0% (64)Foreign-born:
79.7% (10)
White alone - Speak only English Native:
98.4% (675)Foreign-born:
29.7% (2)
White alone - Speak another language Native:
1.3% (9)Foreign-born:
69.0% (4)
Hispanic or Latino - Speak only English Native:
86.8% (39)Foreign-born:
91.9% (10)
Hispanic or Latino - Speak another language Native:
18.9% (8)Foreign-born:
21.9% (2)
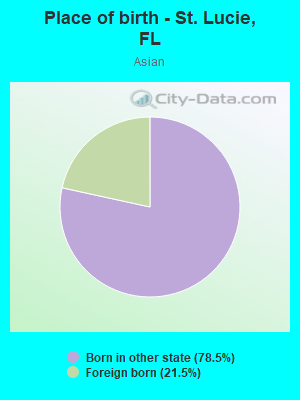
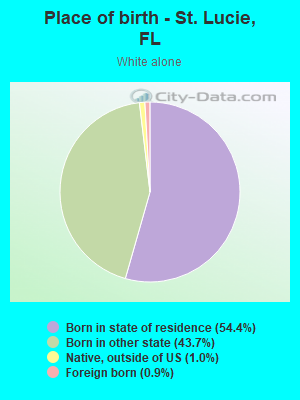
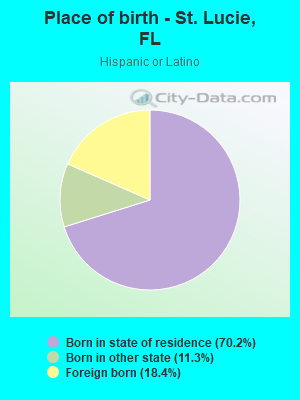
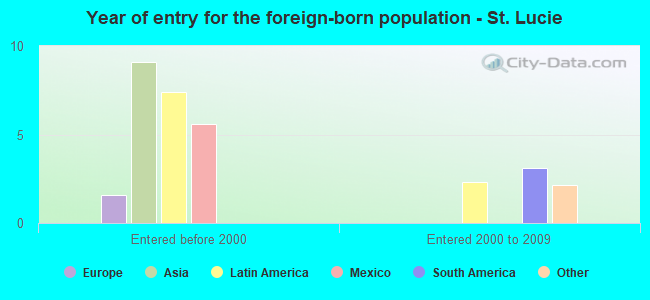
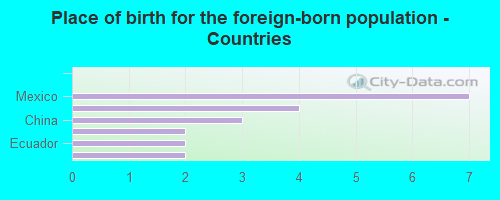
Foreign-born residents in St. Lucie 21 residents are foreign born (1.0% Latin America , 0.8% Asia ).
This city:
2.3%Florida:
21.1%
Marital status for residents in St. Lucie Marital status - White (Caucasian) population 15 years and over
Males 24.4% Never married58.5% Now married0.6% Separated8.5% Widowed7.9% DivorcedFemales 18.0% Never married55.3% Now married0.0% Separated10.0% Widowed16.7% DivorcedWomen who gave birth in the past 12 months Now married:
100.0% (5)Unmarried:
0.0% (0)
Women who did not give birth in the past 12 months Now married:
37.1% (34)Unmarried:
62.9% (58)
Marital status - Other race population 15 years and over
Males 0.0% Never married100.0% Now married0.0% Separated0.0% Widowed0.0% DivorcedFemales 0.0% Never married100.0% Now married0.0% Separated0.0% Widowed0.0% DivorcedWomen who did not give birth in the past 12 months Now married:
100.0% (6)Unmarried:
0.0% (0)
Marital status - Two or more races population 15 years and over
Males 0.0% Never married100.0% Now married0.0% Separated0.0% Widowed0.0% DivorcedFemales 39.1% Never married30.4% Now married8.7% Separated21.7% Widowed0.0% DivorcedWomen who did not give birth in the past 12 months Now married:
43.7% (9)Unmarried:
56.2% (12)
Marital status - White alone, not Hispanic / Latino population 15 years and over
Males 21.3% Never married60.7% Now married0.7% Separated9.0% Widowed8.3% DivorcedFemales 18.2% Never married54.7% Now married0.0% Separated10.1% Widowed16.9% DivorcedWomen who gave birth in the past 12 months Now married:
100.0% (5)Unmarried:
0.0% (0)
Women who did not give birth in the past 12 months Now married:
37.1% (36)Unmarried:
62.9% (62)
Marital status - Hispanic or Latino population 15 years and over
Males 68.4% Never married31.6% Now married0.0% Separated0.0% Widowed0.0% DivorcedFemales 0.0% Never married53.3% Now married13.3% Separated33.3% Widowed0.0% DivorcedWomen who did not give birth in the past 12 months Now married:
100.0% (5)Unmarried:
0.0% (0)
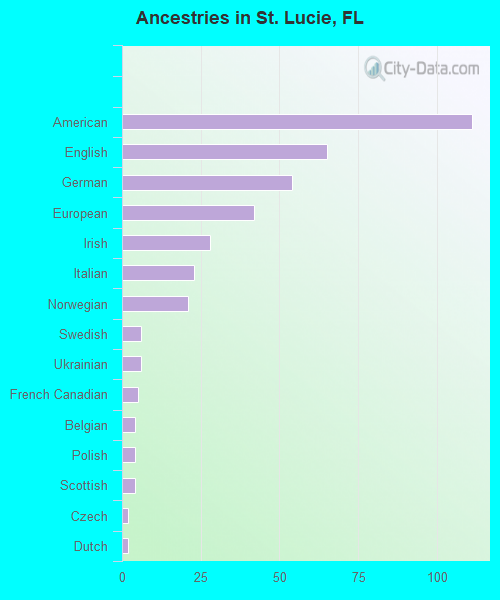
Ancestries in St. Lucie
111 25.8% American65 15.1% English54 12.6% German42 9.8% European28 6.5% Irish23 5.3% Italian21 4.9% Norwegian6 1.4% Swedish6 1.4% Ukrainian5 1.2% French Canadian4 0.9% Belgian4 0.9% Polish4 0.9% Scottish2 0.5% Czech2 0.5% Dutch1 0.2% Northern European
Children Nativity (place of birth) in St. Lucie
Children under 6 years - Living with two parents Both parents native 34 100.0% NativeChildren under 6 years - Living with one parent Native parent 20 100.0% Native
Children 6 to 17 years - Living with two parents Both parents native 119 100.0% NativeOne native, one foreign-born parent 2 100.0% NativeChildren 6 to 17 years - Living with one parent Native parent 17 100.0% Native
Grandparents responsible for own grandchildren in St. Lucie
Grandparents (30 to 59 years) White / Caucasian 2 100.0% Not responsible for grandchildrenWhite alone, not Hispanic / Latino 2 100.0% Not responsible for grandchildrenGrandparents (60 years and over) White / Caucasian 14 75.2% Responsible for grandchildren5 24.8% Not responsible for grandchildrenWhite alone, not Hispanic / Latino 15 74.3% Responsible for grandchildren5 25.7% Not responsible for grandchildren