Races in St. Louis, Missouri (MO) Detailed Stats
Data:
Races - White alone (%)
Races - White alone (% change since 2000)
Races - Black alone (%)
Races - Black alone (% change since 2000)
Races - American Indian alone (%)
Races - American Indian alone (% change since 2000)
Races - Asian alone (%)
Races - Asian alone (% change since 2000)
Races - Hispanic (%)
Races - Hispanic (% change since 2000)
Races - Native Hawaiian and Other Pacific Islander alone (%)
Races - Native Hawaiian and Other Pacific Islander alone (% change since 2000)
Races - Two or more races(%)
Races - Two or more races(% change since 2000)
Races - Other race alone (%)
Races - Other race alone (% change since 2000)
Racial diversity
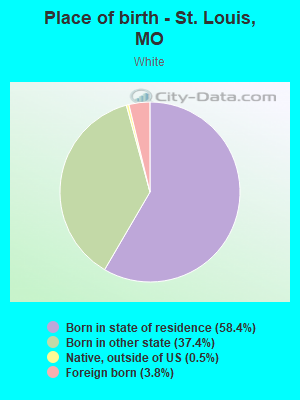
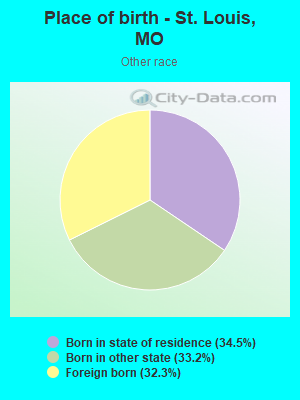
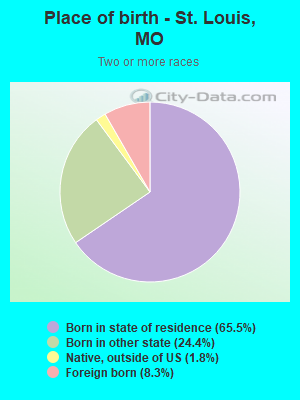
Place of birth - Born in state of residence (%)
Place of birth - Born in state of residence (%) - White
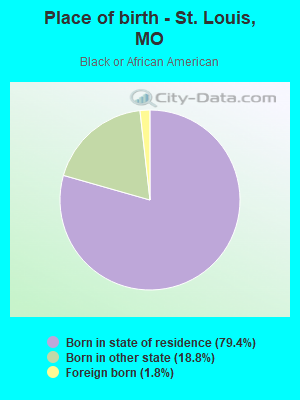
Place of birth - Born in state of residence (%) - Black or African American
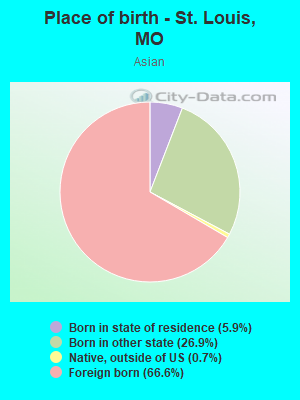
Place of birth - Born in state of residence (%) - Asian
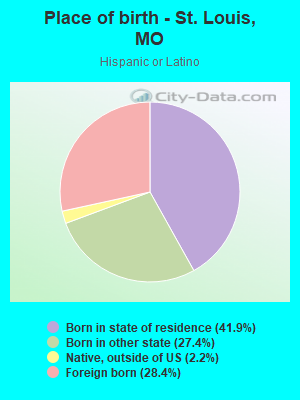
Place of birth - Born in state of residence (%) - Hispanic or Latino
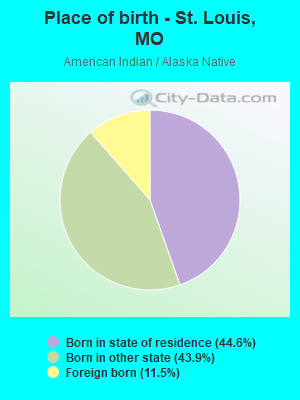
Place of birth - Born in state of residence (%) - American Indian and Alaska Native
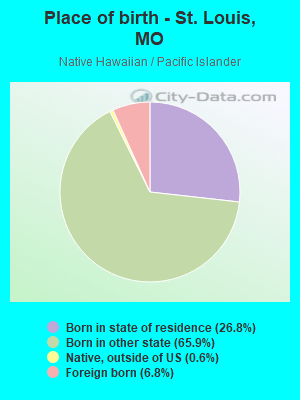
Place of birth - Born in state of residence (%) - Multirace
Place of birth - Born in state of residence (%) - Other Race
Place of birth - Born in other state (%)
Place of birth - Born in other state (%) - White
Place of birth - Born in other state (%) - Black or African American
Place of birth - Born in other state (%) - Asian
Place of birth - Born in other state (%) - Hispanic or Latino
Place of birth - Born in other state (%) - American Indian and Alaska Native
Place of birth - Born in other state (%) - Multirace
Place of birth - Born in other state (%) - Other Race
Place of birth - Native, outside of US (%)
Place of birth - Native, outside of US (%) - White
Place of birth - Native, outside of US (%) - Black or African American
Place of birth - Native, outside of US (%) - Asian
Place of birth - Native, outside of US (%) - Hispanic or Latino
Place of birth - Native, outside of US (%) - American Indian and Alaska Native
Place of birth - Native, outside of US (%) - Multirace
Place of birth - Native, outside of US (%) - Other Race
Place of birth - Foreign born (%)
Place of birth - Foreign born (%) - White
Place of birth - Foreign born (%) - Black or African American
Place of birth - Foreign born (%) - Asian
Place of birth - Foreign born (%) - Hispanic or Latino
Place of birth - Foreign born (%) - American Indian and Alaska Native
Place of birth - Foreign born (%) - Multirace
Place of birth - Foreign born (%) - Other Race
Residents speaking English at home (%)
Residents speaking English at home - Born in the United States (%)
Residents speaking English at home - Native, born elsewhere (%)
Residents speaking English at home - Foreign born (%)
Residents speaking Spanish at home (%)
Residents speaking Spanish at home - Born in the United States (%)
Residents speaking Spanish at home - Native, born elsewhere (%)
Residents speaking Spanish at home - Foreign born (%)
Residents speaking other language at home (%)
Residents speaking other language at home - Born in the United States (%)
Residents speaking other language at home - Native, born elsewhere (%)
Residents speaking other language at home - Foreign born (%)
Marital status - Never married (%)
Marital status - Now married (%)
Marital status - Separated (%)
Marital status - Widowed (%)
Marital status - Divorced (%)
Ancestries Reported - Arab (%)
Ancestries Reported - Czech (%)
Ancestries Reported - Danish (%)
Ancestries Reported - Dutch (%)
Ancestries Reported - English (%)
Ancestries Reported - French (%)
Ancestries Reported - French Canadian (%)
Ancestries Reported - German (%)
Ancestries Reported - Greek (%)
Ancestries Reported - Hungarian (%)
Ancestries Reported - Irish (%)
Ancestries Reported - Italian (%)
Ancestries Reported - Lithuanian (%)
Ancestries Reported - Norwegian (%)
Ancestries Reported - Polish (%)
Ancestries Reported - Portuguese (%)
Ancestries Reported - Russian (%)
Ancestries Reported - Scotch-Irish (%)
Ancestries Reported - Scottish (%)
Ancestries Reported - Slovak (%)
Ancestries Reported - Subsaharan African (%)
Ancestries Reported - Swedish (%)
Ancestries Reported - Swiss (%)
Ancestries Reported - Ukrainian (%)
Ancestries Reported - United States (%)
Ancestries Reported - Welsh (%)
Ancestries Reported - West Indian (%)
Ancestries Reported - Other (%)
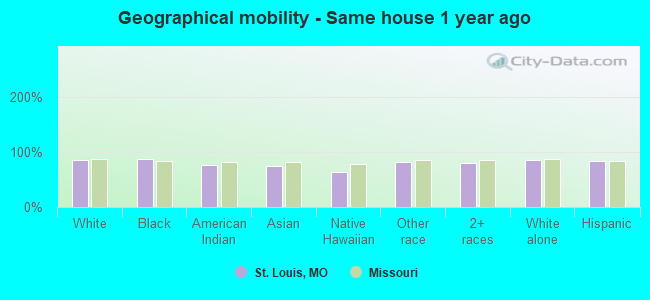
Geographical mobility - Same house 1 year ago (%)
Geographical mobility - Same house 1 year ago (%) - White
Geographical mobility - Same house 1 year ago (%) - Black or African American
Geographical mobility - Same house 1 year ago (%) - Asian
Geographical mobility - Same house 1 year ago (%) - Hispanic or Latino
Geographical mobility - Same house 1 year ago (%) - American Indian and Alaska Native
Geographical mobility - Same house 1 year ago (%) - Multirace
Geographical mobility - Same house 1 year ago (%) - Other Race
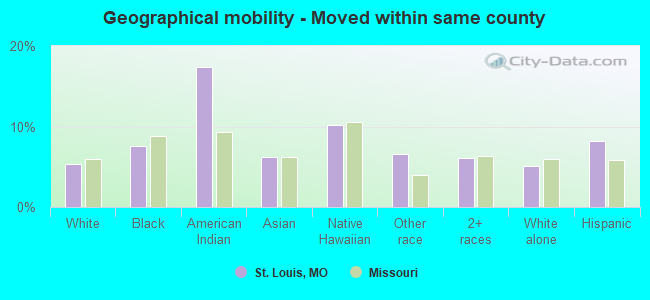
Geographical mobility - Moved within same county (%)
Geographical mobility - Moved within same county (%) - White
Geographical mobility - Moved within same county (%) - Black or African American
Geographical mobility - Moved within same county (%) - Asian
Geographical mobility - Moved within same county (%) - Hispanic or Latino
Geographical mobility - Moved within same county (%) - American Indian and Alaska Native
Geographical mobility - Moved within same county (%) - Multirace
Geographical mobility - Moved within same county (%) - Other Race
Geographical mobility - Moved from different county within same state (%)
Geographical mobility - Moved from different county within same state (%) - White
Geographical mobility - Moved from different county within same state (%) - Black or African American
Geographical mobility - Moved from different county within same state (%) - Asian
Geographical mobility - Moved from different county within same state (%) - Hispanic or Latino
Geographical mobility - Moved from different county within same state (%) - American Indian and Alaska Native
Geographical mobility - Moved from different county within same state (%) - Multirace
Geographical mobility - Moved from different county within same state (%) - Other Race
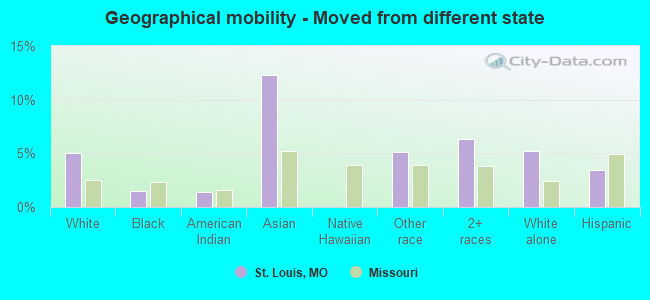
Geographical mobility - Moved from different state (%)
Geographical mobility - Moved from different state (%) - White
Geographical mobility - Moved from different state (%) - Black or African American
Geographical mobility - Moved from different state (%) - Asian
Geographical mobility - Moved from different state (%) - Hispanic or Latino
Geographical mobility - Moved from different state (%) - American Indian and Alaska Native
Geographical mobility - Moved from different state (%) - Multirace
Geographical mobility - Moved from different state (%) - Other Race
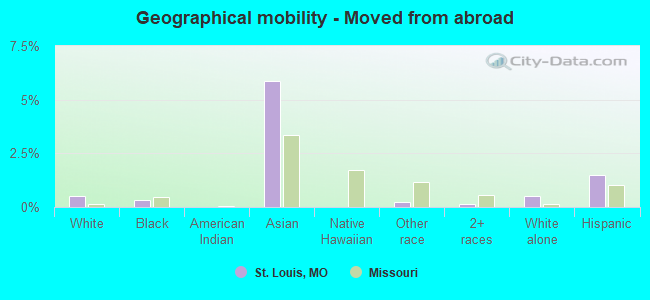
Geographical mobility - Moved from abroad (%)
Geographical mobility - Moved from abroad (%) - White
Geographical mobility - Moved from abroad (%) - Black or African American
Geographical mobility - Moved from abroad (%) - Asian
Geographical mobility - Moved from abroad (%) - Hispanic or Latino
Geographical mobility - Moved from abroad (%) - American Indian and Alaska Native
Geographical mobility - Moved from abroad (%) - Multirace
Geographical mobility - Moved from abroad (%) - Other Race
Place of birth for the foreign-born population - Ireland (%)
Place of birth for the foreign-born population - Denmark (%)
Place of birth for the foreign-born population - Norway (%)
Place of birth for the foreign-born population - Sweden (%)
Place of birth for the foreign-born population - United Kingdom (%)
Place of birth for the foreign-born population - England (%)
Place of birth for the foreign-born population - Scotland (%)
Place of birth for the foreign-born population - Other Northern Europe (%)
Place of birth for the foreign-born population - Austria (%)
Place of birth for the foreign-born population - Belgium (%)
Place of birth for the foreign-born population - France (%)
Place of birth for the foreign-born population - Germany (%)
Place of birth for the foreign-born population - Netherlands (%)
Place of birth for the foreign-born population - Switzerland (%)
Place of birth for the foreign-born population - Other Western Europe (%)
Place of birth for the foreign-born population - Greece (%)
Place of birth for the foreign-born population - Italy (%)
Place of birth for the foreign-born population - Portugal (%)
Place of birth for the foreign-born population - Spain (%)
Place of birth for the foreign-born population - Other Southern Europe (%)
Place of birth for the foreign-born population - Albania (%)
Place of birth for the foreign-born population - Belarus (%)
Place of birth for the foreign-born population - Bosnia and Herzegovina (%)
Place of birth for the foreign-born population - Bulgaria (%)
Place of birth for the foreign-born population - Croatia (%)
Place of birth for the foreign-born population - Czechoslovakia (%)
Place of birth for the foreign-born population - Hungary (%)
Place of birth for the foreign-born population - Latvia (%)
Place of birth for the foreign-born population - Lithuania (%)
Place of birth for the foreign-born population - North Macedonia (Macedonia) (%)
Place of birth for the foreign-born population - Moldova (%)
Place of birth for the foreign-born population - Poland (%)
Place of birth for the foreign-born population - Romania (%)
Place of birth for the foreign-born population - Russia (%)
Place of birth for the foreign-born population - Serbia (%)
Place of birth for the foreign-born population - Ukraine (%)
Place of birth for the foreign-born population - Other Eastern Europe (%)
Place of birth for the foreign-born population - China (%)
Place of birth for the foreign-born population - Hong Kong (%)
Place of birth for the foreign-born population - Taiwan (%)
Place of birth for the foreign-born population - Japan (%)
Place of birth for the foreign-born population - Korea (%)
Place of birth for the foreign-born population - Other Eastern Asia (%)
Place of birth for the foreign-born population - Afghanistan (%)
Place of birth for the foreign-born population - Bangladesh (%)
Place of birth for the foreign-born population - India (%)
Place of birth for the foreign-born population - Iran (%)
Place of birth for the foreign-born population - Kazakhstan (%)
Place of birth for the foreign-born population - Nepal (%)
Place of birth for the foreign-born population - Pakistan (%)
Place of birth for the foreign-born population - Sri Lanka (%)
Place of birth for the foreign-born population - Uzbekistan (%)
Place of birth for the foreign-born population - Other South Central Asia (%)
Place of birth for the foreign-born population - Burma (%)
Place of birth for the foreign-born population - Cambodia (%)
Place of birth for the foreign-born population - Indonesia (%)
Place of birth for the foreign-born population - Laos (%)
Place of birth for the foreign-born population - Malaysia (%)
Place of birth for the foreign-born population - Philippines (%)
Place of birth for the foreign-born population - Singapore (%)
Place of birth for the foreign-born population - Thailand (%)
Place of birth for the foreign-born population - Vietnam (%)
Place of birth for the foreign-born population - Other South Eastern Asia (%)
Place of birth for the foreign-born population - Armenia (%)
Place of birth for the foreign-born population - Iraq (%)
Place of birth for the foreign-born population - Israel (%)
Place of birth for the foreign-born population - Jordan (%)
Place of birth for the foreign-born population - Kuwait (%)
Place of birth for the foreign-born population - Lebanon (%)
Place of birth for the foreign-born population - Saudi Arabia (%)
Place of birth for the foreign-born population - Syria (%)
Place of birth for the foreign-born population - Turkey (%)
Place of birth for the foreign-born population - Yemen (%)
Place of birth for the foreign-born population - Other Western Asia (%)
Place of birth for the foreign-born population - Eritrea (%)
Place of birth for the foreign-born population - Ethiopia (%)
Place of birth for the foreign-born population - Kenya (%)
Place of birth for the foreign-born population - Somalia (%)
Place of birth for the foreign-born population - Uganda (%)
Place of birth for the foreign-born population - Zimbabwe (%)
Place of birth for the foreign-born population - Other Eastern Africa (%)
Place of birth for the foreign-born population - Cameroon (%)
Place of birth for the foreign-born population - Congo (%)
Place of birth for the foreign-born population - Democratic Republic of Congo (Zaire) (%)
Place of birth for the foreign-born population - Other Middle Africa (%)
Place of birth for the foreign-born population - Egypt (%)
Place of birth for the foreign-born population - Morocco (%)
Place of birth for the foreign-born population - Sudan (%)
Place of birth for the foreign-born population - Other Northern Africa (%)
Place of birth for the foreign-born population - South Africa (%)
Place of birth for the foreign-born population - Other Southern Africa (%)
Place of birth for the foreign-born population - Cabo Verde (%)
Place of birth for the foreign-born population - Ghana (%)
Place of birth for the foreign-born population - Liberia (%)
Place of birth for the foreign-born population - Nigeria (%)
Place of birth for the foreign-born population - Senegal (%)
Place of birth for the foreign-born population - Sierra Leone (%)
Place of birth for the foreign-born population - Other Western Africa (%)
Place of birth for the foreign-born population - Australia (%)
Place of birth for the foreign-born population - New Zealand (%)
Place of birth for the foreign-born population - Fiji (%)
Place of birth for the foreign-born population - Micronesia (%)
Place of birth for the foreign-born population - Bahamas (%)
Place of birth for the foreign-born population - Barbados (%)
Place of birth for the foreign-born population - Cuba (%)
Place of birth for the foreign-born population - Dominica (%)
Place of birth for the foreign-born population - Dominican Republic (%)
Place of birth for the foreign-born population - Grenada (%)
Place of birth for the foreign-born population - Haiti (%)
Place of birth for the foreign-born population - Jamaica (%)
Place of birth for the foreign-born population - St. Vincent and the Grenadines (%)
Place of birth for the foreign-born population - Trinidad and Tobago (%)
Place of birth for the foreign-born population - West Indies (%)
Place of birth for the foreign-born population - Other Caribbean (%)
Place of birth for the foreign-born population - Belize (%)
Place of birth for the foreign-born population - Costa Rica (%)
Place of birth for the foreign-born population - El Salvador (%)
Place of birth for the foreign-born population - Guatemala (%)
Place of birth for the foreign-born population - Honduras (%)
Place of birth for the foreign-born population - Mexico (%)
Place of birth for the foreign-born population - Nicaragua (%)
Place of birth for the foreign-born population - Panama (%)
Place of birth for the foreign-born population - Other Central America (%)
Place of birth for the foreign-born population - Argentina (%)
Place of birth for the foreign-born population - Bolivia (%)
Place of birth for the foreign-born population - Brazil (%)
Place of birth for the foreign-born population - Chile (%)
Place of birth for the foreign-born population - Colombia (%)
Place of birth for the foreign-born population - Ecuador (%)
Place of birth for the foreign-born population - Guyana (%)
Place of birth for the foreign-born population - Peru (%)
Place of birth for the foreign-born population - Uruguay (%)
Place of birth for the foreign-born population - Venezuela (%)
Place of birth for the foreign-born population - Other South America (%)
Place of birth for the foreign-born population - Canada (%)
Place of birth for the foreign-born population - Other Northern America (%)
Place of birth for the foreign-born population - Other (%)
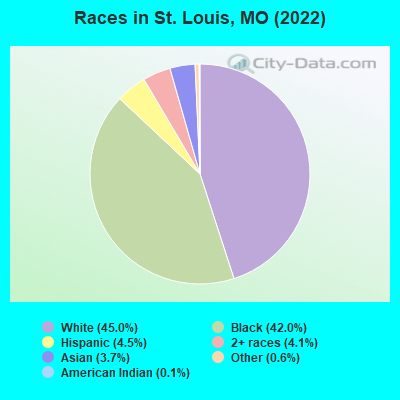
According to 2022 data, the most numerous races in St. Louis, MO are White alone (128,817 residents), Black alone (120,305 residents), and Two or more races (11,611 residents). 91.4% of St. Louis residents speak English at home. 6.4% of St. Louis, MO residents are foreign-born (2.8% born in Asia, 1.2% born in Latin America, 1.2% born in Europe, 1.0% born in Africa), which is 37.9% greater than the foreign-born rate of 4.0% across the entire state of Missouri.
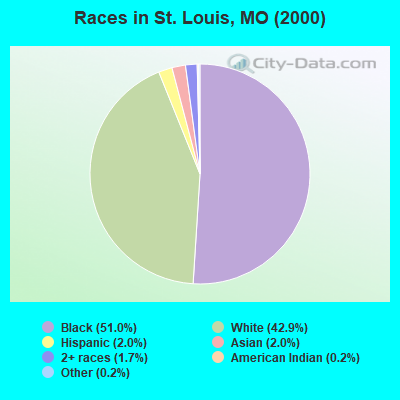
Race distribution in St. Louis
2000 2022
177,446 51.0% Black alone 149,329 42.9% White alone 7,022 2.0% Hispanic 6,820 2.0% Asian alone 5,980 1.7% Two or more races 647 0.2% Other race alone 862 0.2% American Indian alone 83 0.02% Native Hawaiian and Other
128,817 45.0% White alone 120,305 42.0% Black alone 12,927 4.5% Hispanic 11,611 4.1% Two or more races 10,726 3.7% Asian alone 1,714 0.6% Other race alone 341 0.1% American Indian alone 137 0.05% Native Hawaiian and Other
2000 2022
4,686,474 83.8% White alone 625,667 11.2% Black alone 118,592 2.1% Hispanic 71,905 1.3% Two or more races 61,041 1.1% Asian alone 23,302 0.4% American Indian alone 5,291 0.09% Other race alone 2,939 0.05% Native Hawaiian and Other
4,733,411 76.6% White alone 656,739 10.6% Black alone 316,300 5.1% Two or more races 291,763 4.7% Hispanic 132,436 2.1% Asian alone 27,467 0.4% Other race alone 12,313 0.2% American Indian alone 7,528 0.1% Native Hawaiian and Other
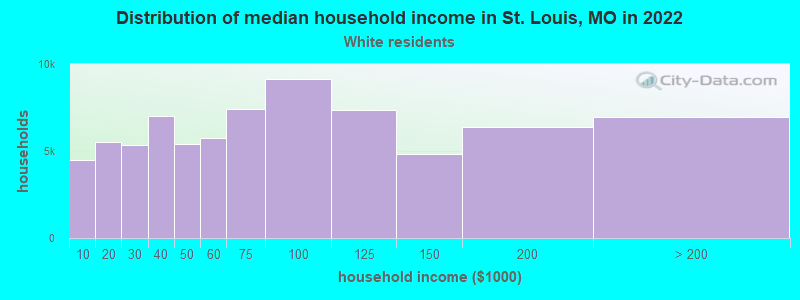
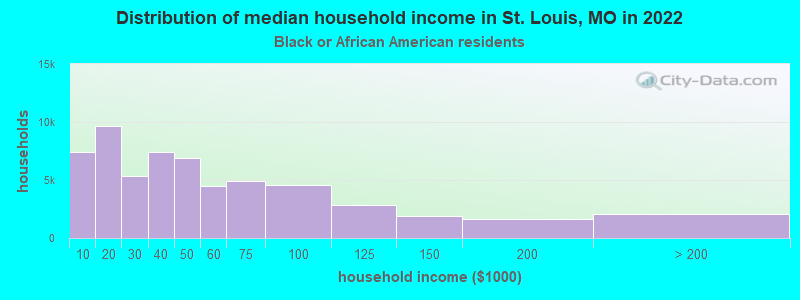
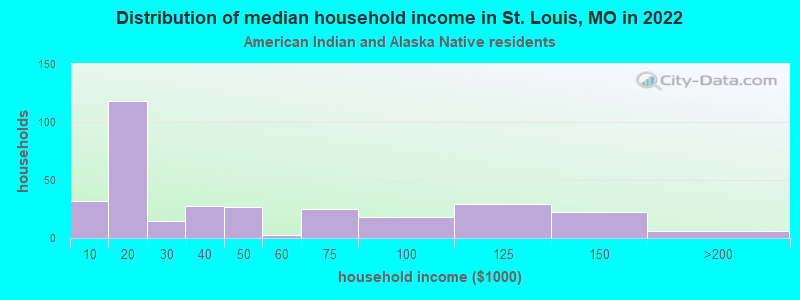
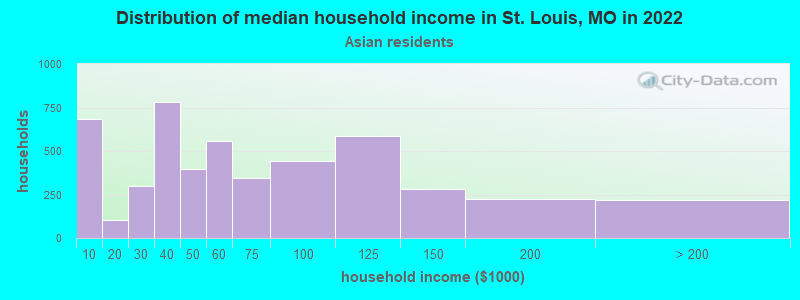
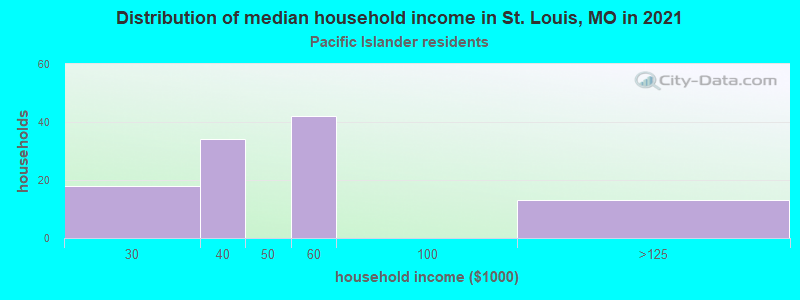
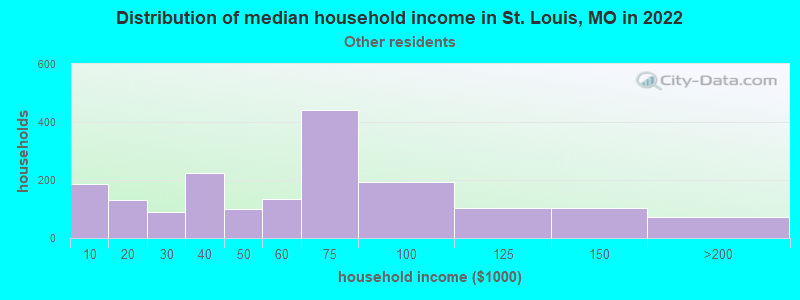
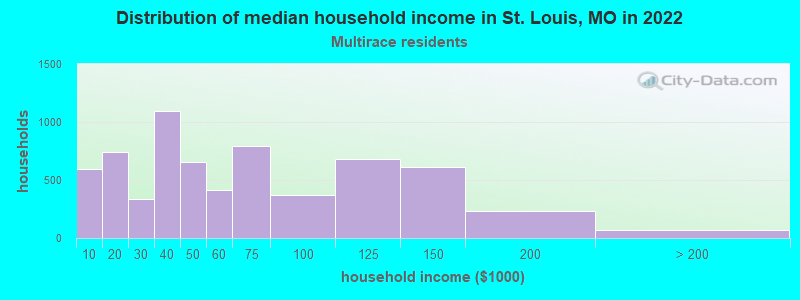
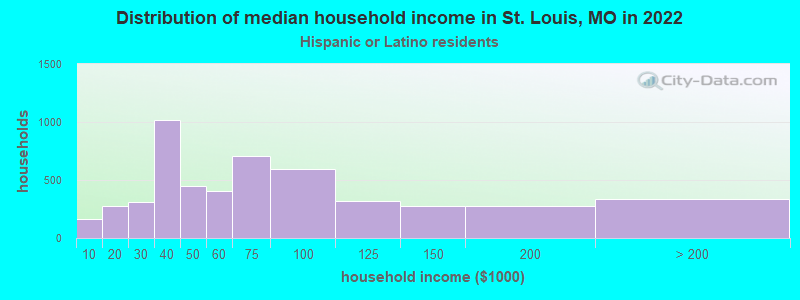
Income and house value in St. Louis Median household income in 2022 $70,631 White non-Hispanic householders$39,688 Black householders$76,250 American Indian and Alaska Native householders$54,413 Asian householders$74,297 Some other race householders$48,266 Two or more races householders$49,973 Hispanic or Latino race householdersMedian 2022 house value $220,384 White Non-Hispanic householders$149,021 Black or African American householders$158,316 American Indian or Alaska Native householders $185,002 Asian householders$174,208 Native Hawaiian and other Pacific Islander householders$164,913 Some other race householders$181,104 Two or more races householders$183,203 Hispanic or Latino householders
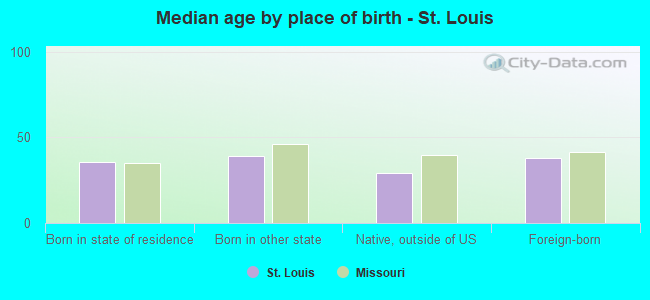
Median age by race in St. Louis
38.6 Median age for White residents38.5 38.8 37.0 Median age for Black or African American residents36.0 39.1 29.5 Median age for American Indian / Alaska Native residents29.1 45.2 33.0 Median age for Asian residents32.3 34.8 56.7 Median age for Native Hawaiian / Pacific Islander residents-666,666,666.0 -666,666,666.0 30.7 Median age for Other race residents30.4 31.2 25.6 Median age for Two or more races residents22.7 29.7 38.9 Median age for White alone residents39.0 38.8 28.9 Median age for Hispanic or Latino residents28.4 31.2
Owner/renter occupied households by race in St. Louis
House owners and renters - White residents 42,636 56.4% Owner occupied32,893 43.6% Renter occupiedHouse owners and renters - Black or African American residents 21,447 36.3% Owner occupied37,685 63.7% Renter occupiedHouse owners and renters - American Indian / Alaska Native residents 147 46.9% Owner occupied166 53.1% Renter occupiedHouse owners and renters - Asian residents 1,214 24.7% Owner occupied3,710 75.3% Renter occupiedHouse owners and renters - Native Hawaiian / Pacific Islander residents 3 3.2% Owner occupied78 96.8% Renter occupiedHouse owners and renters - Other race residents 1,150 59.8% Owner occupied772 40.2% Renter occupiedHouse owners and renters - Two or more races residents 2,774 42.0% Owner occupied3,835 58.0% Renter occupiedHouse owners and renters - White alone residents 42,208 57.4% Owner occupied31,348 42.6% Renter occupiedHouse owners and renters - Hispanic or Latino residents 2,040 42.7% Owner occupied2,738 57.3% Renter occupied
Language usage in St. Louis
English speakers - Total 91.4% of residents of St. Louis speak English at home.
2.7% of residents speak Spanish at home 5,768 78.4% Speak English very well1,592 21.6% Speak English less than very well5.9% of residents speak other language at home 10,310 65.1% Speak English very well5,533 34.9% Speak English less than very well
English speakers - Born in the United States 94.4% of residents of St. Louis speak English at home.
2.5% of residents speak Spanish at home 1,570 80.0% Speak English very well392 20.0% Speak English less than very well3.2% of residents speak other language at home 2,339 92.8% Speak English very well182 7.2% Speak English less than very well
English speakers - Native, born elsewhere 84.7% of residents of St. Louis speak English at home.
7.4% of residents speak Spanish at home 68 100.0% Speak English very well7.9% of residents speak other language at home 45 61.6% Speak English very well28 38.4% Speak English less than very well
English speakers - Foreign-born 20.5% of residents of St. Louis speak English at home.
15.9% of residents speak Spanish at home 1,833 65.4% Speak English very well968 34.6% Speak English less than very well63.6% of residents speak other language at home 5,869 52.4% Speak English very well5,323 47.6% Speak English less than very well
White (Caucasian) - Speak only English Native:
97.7% (119,662)Foreign-born:
37.2% (1,862)
White (Caucasian) - Speak another language Native:
2.3% (2,827)Foreign-born:
62.8% (3,137)
Black or African American - Speak only English Native:
97.9% (108,393)Foreign-born:
10.0% (214)
Black or African American - Speak another language Native:
2.1% (2,377)Foreign-born:
90.0% (1,929)
American Indian / Alaska Native - Speak only English Native:
87.0% (415)Foreign-born:
93.0% (61)
American Indian / Alaska Native - Speak another language Native:
7.4% (35)Foreign-born:
72.8% (48)
Asian - Speak only English Native:
60.1% (2,082)Foreign-born:
9.5% (694)
Asian - Speak another language Native:
39.9% (1,385)Foreign-born:
90.5% (6,641)
Native Hawaiian / Pacific Islander - Speak only English Native:
61.5% (93)Foreign-born:
100.0% (14)
Other race - Speak only English Native:
53.6% (1,601)Foreign-born:
34.1% (624)
Other race - Speak another language Native:
46.4% (1,385)Foreign-born:
65.9% (1,207)
Two or more races - Speak only English Native:
91.1% (11,556)Foreign-born:
17.2% (224)
Two or more races - Speak another language Native:
8.9% (1,135)Foreign-born:
82.8% (1,079)
White alone - Speak only English Native:
98.4% (117,549)Foreign-born:
42.9% (1,862)
White alone - Speak another language Native:
1.6% (1,898)Foreign-born:
57.1% (2,481)
Hispanic or Latino - Speak only English Native:
63.0% (5,308)Foreign-born:
23.8% (873)
Hispanic or Latino - Speak another language Native:
37.0% (3,116)Foreign-born:
76.2% (2,801)
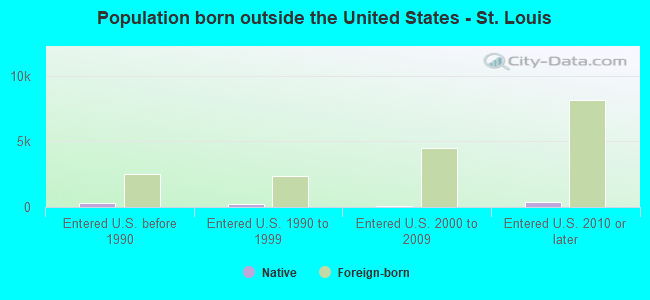
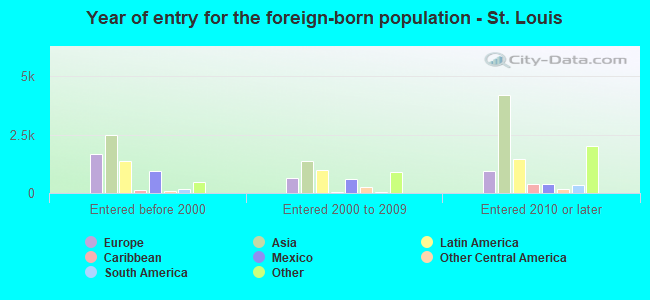
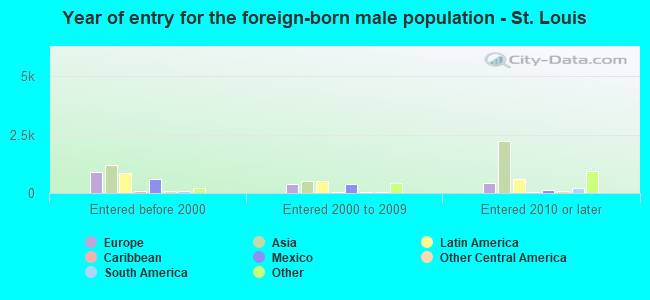
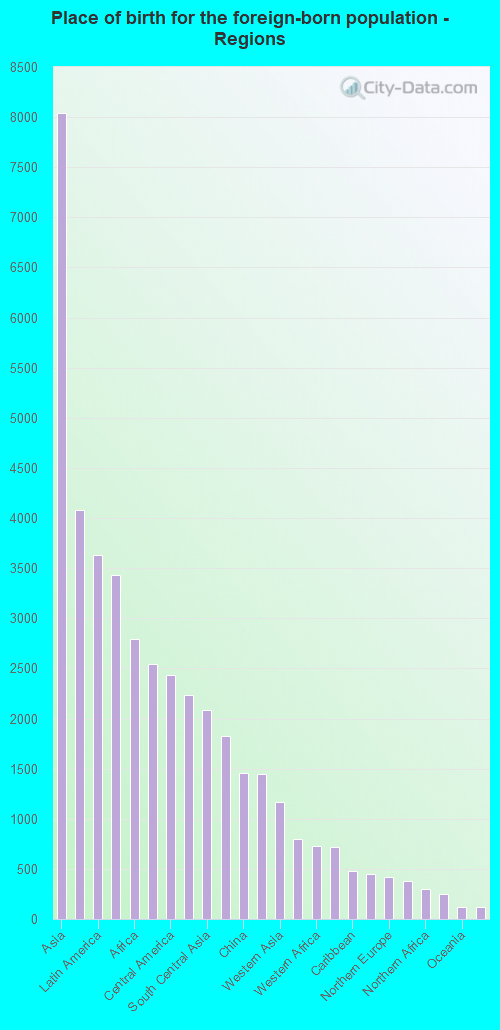
Foreign-born residents in St. Louis 18,467 residents are foreign born (2.8% Asia , 1.2% Latin America , 1.2% Europe , 1.0% Africa ).
This city:
6.4%Missouri:
4.2%
Marital status for residents in St. Louis Marital status - White (Caucasian) population 15 years and over
Males 47.0% Never married38.7% Now married2.0% Separated1.5% Widowed10.9% DivorcedFemales 39.1% Never married41.4% Now married1.4% Separated5.8% Widowed12.3% DivorcedWomen who gave birth in the past 12 months Now married:
80.9% (1,721)Unmarried:
19.1% (406)
Women who did not give birth in the past 12 months Now married:
36.5% (12,407)Unmarried:
63.5% (21,630)
Marital status - Black or African American population 15 years and over
Males 53.7% Never married24.6% Now married3.8% Separated3.2% Widowed14.8% DivorcedFemales 53.0% Never married21.8% Now married3.3% Separated8.8% Widowed13.0% DivorcedWomen who gave birth in the past 12 months Now married:
15.9% (99)Unmarried:
84.1% (525)
Women who did not give birth in the past 12 months Now married:
17.2% (5,164)Unmarried:
82.8% (24,778)
Marital status - American Indian / Alaska Native population 15 years and over
Males 37.8% Never married23.6% Now married7.1% Separated8.4% Widowed23.0% DivorcedFemales 34.1% Never married24.9% Now married0.0% Separated12.0% Widowed29.0% DivorcedWomen who did not give birth in the past 12 months Now married:
49.4% (38)Unmarried:
50.6% (39)
Marital status - Asian population 15 years and over
Males 53.8% Never married45.1% Now married1.1% Separated0.0% Widowed0.0% DivorcedFemales 44.9% Never married38.5% Now married0.0% Separated11.1% Widowed5.4% DivorcedWomen who gave birth in the past 12 months Now married:
100.0% (59)Unmarried:
0.0% (0)
Women who did not give birth in the past 12 months Now married:
42.7% (1,840)Unmarried:
57.3% (2,474)
Marital status - Native Hawaiian / Pacific Islander population 15 years and over
Males 8.3% Never married12.5% Now married79.2% Separated0.0% Widowed0.0% DivorcedFemales 65.8% Never married5.9% Now married23.0% Separated5.3% Widowed0.0% DivorcedWomen who gave birth in the past 12 months Now married:
100.0% (14)Unmarried:
0.0% (0)
Women who did not give birth in the past 12 months Now married:
0.0% (0)Unmarried:
100.0% (65)
Marital status - Other race population 15 years and over
Males 63.1% Never married33.3% Now married0.0% Separated0.0% Widowed3.6% DivorcedFemales 54.1% Never married35.2% Now married2.1% Separated0.0% Widowed8.7% DivorcedWomen who gave birth in the past 12 months Now married:
88.0% (54)Unmarried:
12.0% (7)
Women who did not give birth in the past 12 months Now married:
34.2% (532)Unmarried:
65.8% (1,021)
Marital status - Two or more races population 15 years and over
Males 66.8% Never married18.6% Now married4.4% Separated2.6% Widowed7.6% DivorcedFemales 52.1% Never married28.2% Now married3.0% Separated6.0% Widowed10.7% DivorcedWomen who gave birth in the past 12 months Now married:
18.7% (77)Unmarried:
81.3% (335)
Women who did not give birth in the past 12 months Now married:
27.9% (943)Unmarried:
72.1% (2,437)
Marital status - White alone, not Hispanic / Latino population 15 years and over
Males 46.3% Never married39.5% Now married2.0% Separated1.3% Widowed10.9% DivorcedFemales 38.9% Never married41.5% Now married1.4% Separated5.8% Widowed12.4% DivorcedWomen who gave birth in the past 12 months Now married:
80.2% (1,646)Unmarried:
19.8% (406)
Women who did not give birth in the past 12 months Now married:
36.9% (12,407)Unmarried:
63.1% (21,229)
Marital status - Hispanic or Latino population 15 years and over
Males 58.3% Never married25.1% Now married3.7% Separated5.1% Widowed7.8% DivorcedFemales 35.2% Never married55.5% Now married3.5% Separated1.5% Widowed4.3% DivorcedWomen who gave birth in the past 12 months Now married:
90.0% (226)Unmarried:
10.0% (25)
Women who did not give birth in the past 12 months Now married:
53.1% (1,690)Unmarried:
46.9% (1,493)
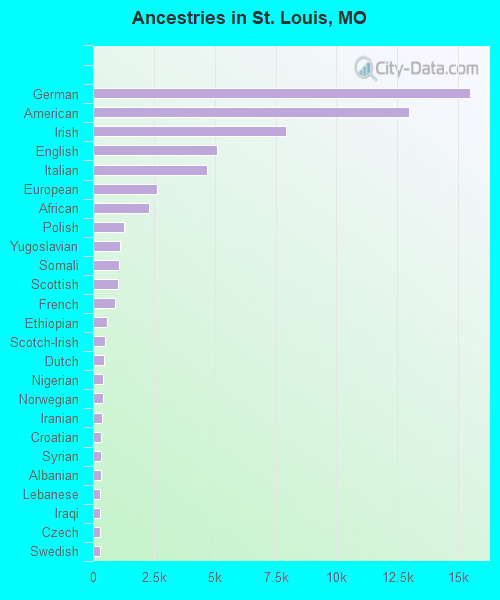
Ancestries in St. Louis
15,492 9.2% German12,975 7.7% American7,946 4.7% Irish5,107 3.0% English4,695 2.8% Italian2,636 1.6% European2,311 1.4% African1,272 0.8% Polish1,100 0.7% Yugoslavian1,060 0.6% Somali1,030 0.6% Scottish920 0.5% French574 0.3% Ethiopian488 0.3% Scotch-Irish453 0.3% Dutch428 0.3% Nigerian408 0.2% Norwegian378 0.2% Iranian347 0.2% Croatian337 0.2% Syrian332 0.2% Albanian302 0.2% Lebanese291 0.2% Iraqi281 0.2% Czech268 0.2% Swedish263 0.2% Eastern European227 0.1% Romanian226 0.1% Russian217 0.1% Hungarian204 0.1% British200 0.1% Scandinavian189 0.1% Greek181 0.1% Haitian179 0.1% Ukrainian177 0.1% Kenyan157 0.09% Bulgarian152 0.09% Northern European149 0.09% Ghanaian141 0.08% Austrian132 0.08% Sierra Leonean127 0.08% Swiss96 0.06% French Canadian89 0.05% Jamaican88 0.05% Canadian88 0.05% Liberian87 0.05% Lithuanian83 0.05% Welsh82 0.05% Slovak78 0.05% Australian68 0.04% Israeli65 0.04% Czechoslovakian63 0.04% Slovene59 0.04% Afghan53 0.03% Sudanese50 0.03% Moroccan50 0.03% Danish47 0.03% Belgian44 0.03% Turkish40 0.02% Portuguese40 0.02% Serbian39 0.02% Slavic39 0.02% Bermudan39 0.02% British West Indian38 0.02% Arab31 0.02% Macedonian26 0.02% Palestinian20 0.01% Icelander18 0.01% Egyptian13 0.01% Brazilian11 0.01% Trinidadian and Tobagonian9 0.01% Cypriot
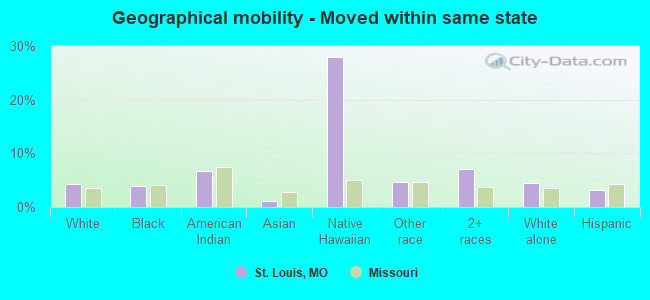
Geographical mobility in St. Louis Same house 1 year ago 111,510 84.8% White (Caucasian)103,770 86.8% Black or African American461 77.1% American Indian / Alaska Native8,218 74.6% Asian118 63.2% Native Hawaiian / Pacific Islander3,988 82.0% Other race12,004 80.3% Two or more races108,103 84.8% White alone, not Hispanic / Latino10,642 83.7% Hispanic or LatinoMoved within same county 7,046 5.4% White / Caucasian9,032 7.6% Black or African American104 17.4% American Indian / Alaska Native681 6.2% Asian19 10.2% Native Hawaiian / Pacific Islander319 6.6% Other race912 6.1% Two or more races6,488 5.1% White alone, not Hispanic / Latino1,040 8.2% Hispanic or LatinoMoved within same state 5,669 4.3% White / Caucasian4,630 3.9% Black or African American41 6.8% American Indian / Alaska Native124 1.1% Asian52 28.0% Native Hawaiian / Pacific Islander230 4.7% Other race1,070 7.2% Two or more races5,592 4.4% White alone, not Hispanic / Latino392 3.1% Hispanic or LatinoMoved from different state 6,626 5.0% White / Caucasian1,761 1.5% Black or African American8 1.4% American Indian / Alaska Native1,352 12.3% Asian247 5.1% Other race941 6.3% Two or more races6,626 5.2% White alone, not Hispanic / Latino442 3.5% Hispanic or LatinoMoved from abroad 644 0.5% White395 0.3% Black or African American646 5.9% Asian12 0.3% Other race24 0.2% Two or more races644 0.5% White alone, not Hispanic / Latino191 1.5% Hispanic or Latino
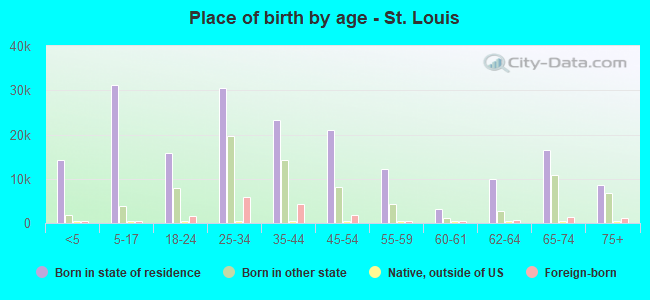
Children Nativity (place of birth) in St. Louis
Children under 6 years - Living with two parents Both parents native 7,375 99.8% Native11 0.2% Foreign-bornBoth parents foreign-born 1,276 95.3% Native64 4.7% Foreign-bornOne native, one foreign-born parent 650 100.0% NativeChildren under 6 years - Living with one parent Native parent 9,321 100.0% NativeForeign-born parent 587 91.5% Native55 8.5% Foreign-bornChildren 6 to 17 years - Living with two parents Both parents native 9,901 99.4% Native61 0.6% Foreign-bornBoth parents foreign-born 1,616 74.7% Native548 25.3% Foreign-bornOne native, one foreign-born parent 630 96.0% Native26 4.0% Foreign-bornChildren 6 to 17 years - Living with one parent Native parent 18,034 100.0% NativeForeign-born parent 689 53.1% Native609 46.9% Foreign-born
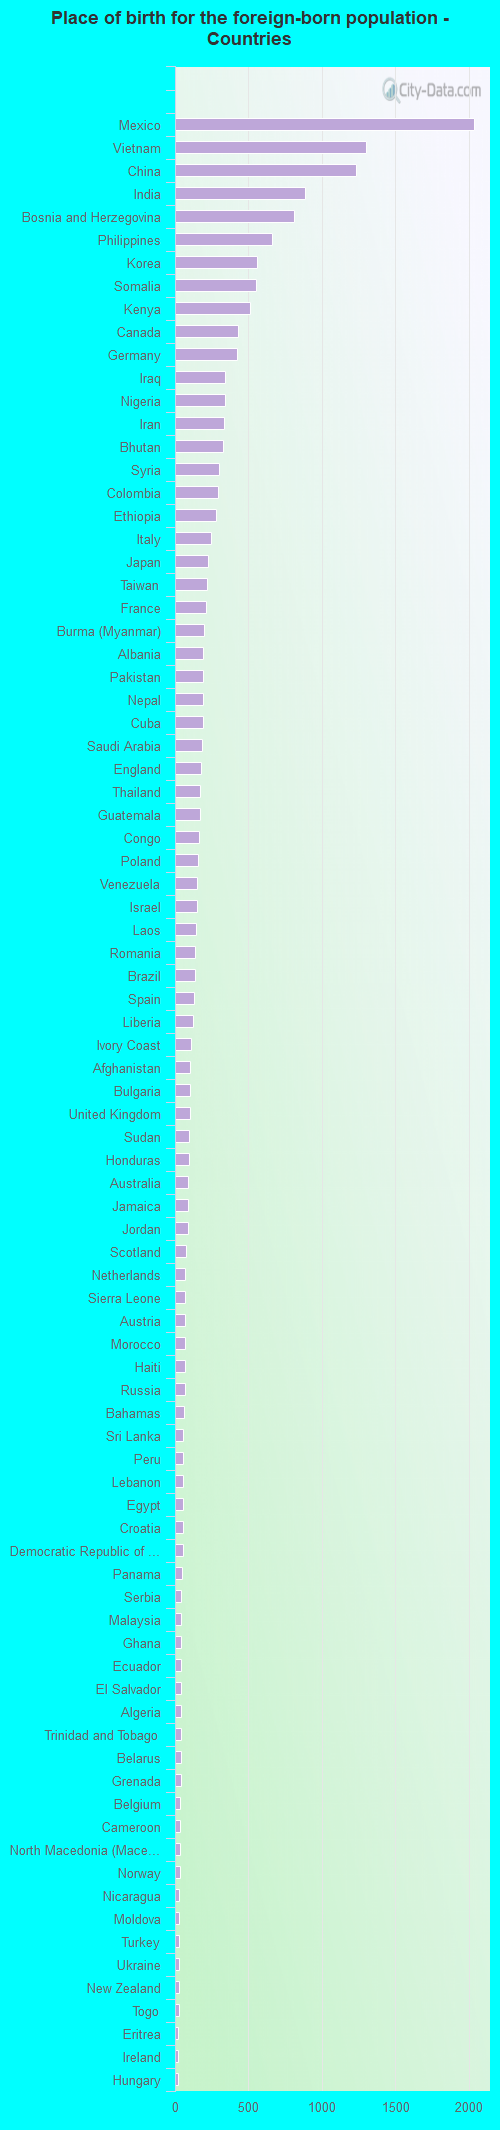
Place of birth for residents in St. Louis 8,043 Asia4,083 Americas3,635 Latin America3,428 Europe2,795 Africa2,544 South Eastern Asia2,430 Central America2,235 Eastern Asia2,090 South Central Asia1,827 Eastern Europe1,453 China1,444 Eastern Africa1,165 Western Asia799 Western Europe727 Western Africa721 South America483 Caribbean447 Northern America421 Northern Europe380 Southern Europe296 Northern Africa251 Middle Africa116 Oceania116 Australia and New Zealand Subregion17 Southern Africa2,036 Mexico1,300 Vietnam1,229 China882 India813 Bosnia and Herzegovina659 Philippines557 Korea553 Somalia512 Kenya429 Canada419 Germany343 Iraq342 Nigeria332 Iran324 Bhutan297 Syria292 Colombia278 Ethiopia245 Italy224 Japan215 Taiwan208 France196 Burma (Myanmar)194 Albania192 Pakistan189 Nepal188 Cuba187 Saudi Arabia180 England173 Thailand167 Guatemala164 Congo157 Poland153 Venezuela147 Israel145 Laos138 Romania138 Brazil128 Spain121 Liberia111 Ivory Coast103 Afghanistan100 Bulgaria100 United Kingdom95 Sudan93 Honduras89 Australia87 Jamaica87 Jordan78 Scotland70 Netherlands70 Sierra Leone65 Austria65 Morocco65 Haiti65 Russia63 Bahamas57 Sri Lanka57 Peru56 Lebanon55 Egypt54 Croatia52 Democratic Republic of Congo (Zaire)48 Panama44 Serbia43 Malaysia43 Ghana43 Ecuador42 El Salvador42 Algeria40 Trinidad and Tobago39 Belarus38 Grenada35 Belgium34 Cameroon33 North Macedonia (Macedonia)31 Norway28 Nicaragua28 Moldova27 Turkey27 Ukraine26 New Zealand25 Togo22 Eritrea20 Ireland20 Hungary17 South Africa17 Bolivia13 Costa Rica13 Indonesia13 Argentina12 Cambodia11 Latvia9 United Arab Emirates9 Denmark9 Zimbabwe8 Hong Kong6 Greece6 Kazakhstan4 Chile
Grandparents responsible for own grandchildren in St. Louis
Grandparents (30 to 59 years) White / Caucasian 190 37.3% Responsible for grandchildren319 62.7% Not responsible for grandchildrenBlack or African American 796 70.8% Responsible for grandchildren328 29.2% Not responsible for grandchildrenAmerican Indian / Alaska Native 12 100.0% Responsible for grandchildrenOther race 20 100.0% Not responsible for grandchildrenTwo or more races 38 36.5% Responsible for grandchildren66 63.5% Not responsible for grandchildrenWhite alone, not Hispanic / Latino 81 28.0% Responsible for grandchildren207 72.0% Not responsible for grandchildrenHispanic or Latino 9 20.3% Responsible for grandchildren34 79.7% Not responsible for grandchildrenGrandparents (60 years and over) White / Caucasian 214 47.5% Responsible for grandchildren237 52.5% Not responsible for grandchildrenBlack or African American 248 23.7% Responsible for grandchildren798 76.3% Not responsible for grandchildrenAmerican Indian / Alaska Native 24 100.0% Responsible for grandchildrenOther race 59 100.0% Not responsible for grandchildrenTwo or more races 122 77.2% Responsible for grandchildren36 22.8% Not responsible for grandchildrenWhite alone, not Hispanic / Latino 227 37.1% Responsible for grandchildren386 62.9% Not responsible for grandchildrenHispanic or Latino 50 49.2% Responsible for grandchildren52 50.8% Not responsible for grandchildren
Zip codes: 63101 , 63102 , 63103 , 63104 , 63106 , 63107 , 63108 , 63109 , 63110 , 63111 , 63112 , 63113 , 63115 , 63116 , 63118 , 63139 , 63147 , 63155.