Races in St. George, Florida (FL) Detailed Stats
Ancestries, Foreign-born residents, place of birth

Recent posts about races in St. George, Florida on our local forum with over 2,400,000 registered users:
 | Missing NYC (29 replies) |
| Home Owner's Insurance, what do you pay? (30 replies) |
| The best neighborhood is . . . . (30 replies) |
11.9% of St. George, FL residents are foreign-born (11.9% born in Latin America), which is 76.2% less than the foreign-born rate of 21.0% across the entire state of Florida.
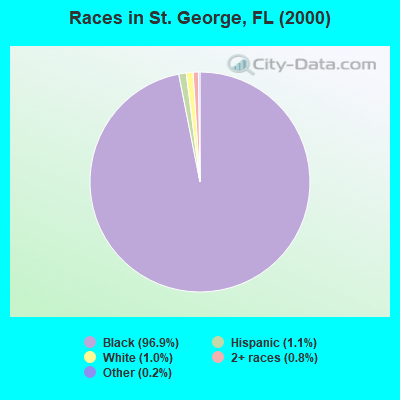
Race distribution in St. George

- 2,37496.9%Black alone
- 271.1%Hispanic
- 241.0%White alone
- 200.8%Two or more races
- 40.2%Other race alone
- 10.04%Native Hawaiian and Other
Pacific Islander alone
2000
2022
-
- 10,458,50965.4%White alone
- 2,682,71516.8%Hispanic
- 2,264,26814.2%Black alone
- 261,6931.6%Asian alone
- 236,9541.5%Two or more races
- 42,3580.3%American Indian alone
- 28,9940.2%Other race alone
- 6,8870.04%Native Hawaiian and Other
Pacific Islander alone

-
- 11,309,40350.8%White alone
- 6,025,03927.1%Hispanic
- 3,241,01514.6%Black alone
- 861,6303.9%Two or more races
- 623,6922.8%Asian alone
- 152,0540.7%Other race alone
- 22,5040.1%American Indian alone
- 9,4860.04%Native Hawaiian and Other
Pacific Islander alone

Income and house value in St. George
- Median household income in 2022
- over $200,000White non-Hispanic householders
- $74,049Black householders
- $70,757Two or more races householders
- Median 2022 house value
- $207,410White Non-Hispanic householders
- $331,269Black or African American householders
- $401,385Two or more races householders
Household income for White non-Hispanic householders

Household income for Black householders

Household income for Two or more races householders

Foreign-born residents in St. George
292 residents are foreign born (11.9% Latin America).
| This city: | 11.9% |
| Florida: | 16.7% |
Ancestries in St. George

- 1,76485.5%Other
- 23311.3%West Indian
- 291.4%Irish
- 221.1%United States
- 80.4%Subsaharan African
- 70.3%German

Zip codes: 33311.