Races in Springfield, Tennessee (TN) Detailed Stats
Data:
Races - White alone (%)
Races - White alone (% change since 2000)
Races - Black alone (%)
Races - Black alone (% change since 2000)
Races - American Indian alone (%)
Races - American Indian alone (% change since 2000)
Races - Asian alone (%)
Races - Asian alone (% change since 2000)
Races - Hispanic (%)
Races - Hispanic (% change since 2000)
Races - Native Hawaiian and Other Pacific Islander alone (%)
Races - Native Hawaiian and Other Pacific Islander alone (% change since 2000)
Races - Two or more races(%)
Races - Two or more races(% change since 2000)
Races - Other race alone (%)
Races - Other race alone (% change since 2000)
Racial diversity
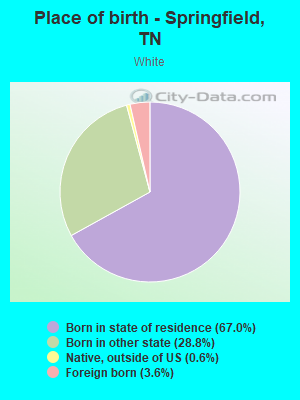
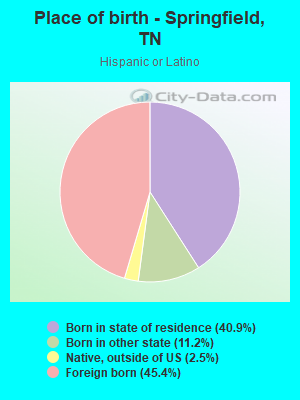
Place of birth - Born in state of residence (%)
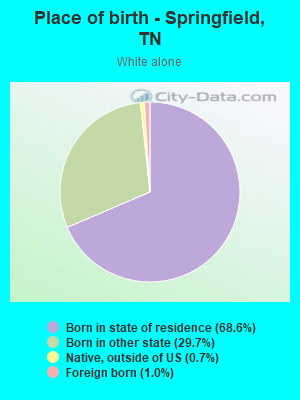
Place of birth - Born in state of residence (%) - White
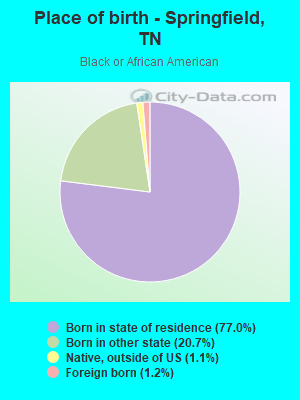
Place of birth - Born in state of residence (%) - Black or African American
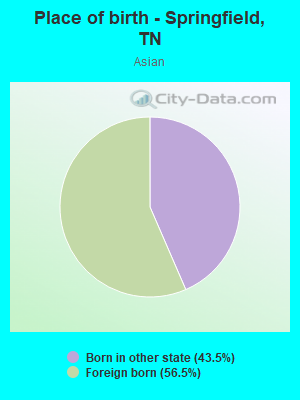
Place of birth - Born in state of residence (%) - Asian
Place of birth - Born in state of residence (%) - Hispanic or Latino
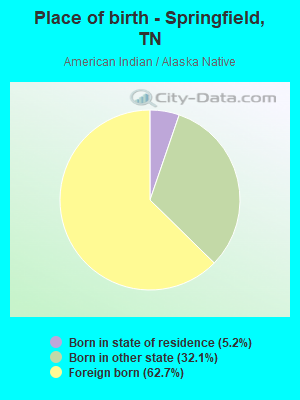
Place of birth - Born in state of residence (%) - American Indian and Alaska Native
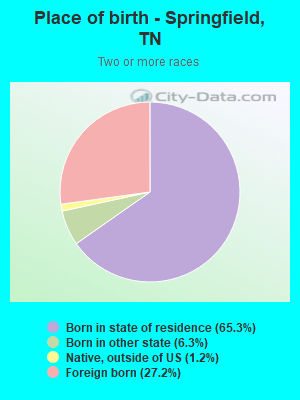
Place of birth - Born in state of residence (%) - Multirace
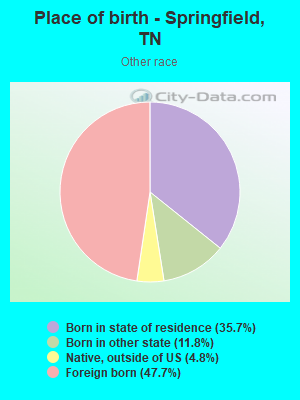
Place of birth - Born in state of residence (%) - Other Race
Place of birth - Born in other state (%)
Place of birth - Born in other state (%) - White
Place of birth - Born in other state (%) - Black or African American
Place of birth - Born in other state (%) - Asian
Place of birth - Born in other state (%) - Hispanic or Latino
Place of birth - Born in other state (%) - American Indian and Alaska Native
Place of birth - Born in other state (%) - Multirace
Place of birth - Born in other state (%) - Other Race
Place of birth - Native, outside of US (%)
Place of birth - Native, outside of US (%) - White
Place of birth - Native, outside of US (%) - Black or African American
Place of birth - Native, outside of US (%) - Asian
Place of birth - Native, outside of US (%) - Hispanic or Latino
Place of birth - Native, outside of US (%) - American Indian and Alaska Native
Place of birth - Native, outside of US (%) - Multirace
Place of birth - Native, outside of US (%) - Other Race
Place of birth - Foreign born (%)
Place of birth - Foreign born (%) - White
Place of birth - Foreign born (%) - Black or African American
Place of birth - Foreign born (%) - Asian
Place of birth - Foreign born (%) - Hispanic or Latino
Place of birth - Foreign born (%) - American Indian and Alaska Native
Place of birth - Foreign born (%) - Multirace
Place of birth - Foreign born (%) - Other Race
Residents speaking English at home (%)
Residents speaking English at home - Born in the United States (%)
Residents speaking English at home - Native, born elsewhere (%)
Residents speaking English at home - Foreign born (%)
Residents speaking Spanish at home (%)
Residents speaking Spanish at home - Born in the United States (%)
Residents speaking Spanish at home - Native, born elsewhere (%)
Residents speaking Spanish at home - Foreign born (%)
Residents speaking other language at home (%)
Residents speaking other language at home - Born in the United States (%)
Residents speaking other language at home - Native, born elsewhere (%)
Residents speaking other language at home - Foreign born (%)
Marital status - Never married (%)
Marital status - Now married (%)
Marital status - Separated (%)
Marital status - Widowed (%)
Marital status - Divorced (%)
Ancestries Reported - Arab (%)
Ancestries Reported - Czech (%)
Ancestries Reported - Danish (%)
Ancestries Reported - Dutch (%)
Ancestries Reported - English (%)
Ancestries Reported - French (%)
Ancestries Reported - French Canadian (%)
Ancestries Reported - German (%)
Ancestries Reported - Greek (%)
Ancestries Reported - Hungarian (%)
Ancestries Reported - Irish (%)
Ancestries Reported - Italian (%)
Ancestries Reported - Lithuanian (%)
Ancestries Reported - Norwegian (%)
Ancestries Reported - Polish (%)
Ancestries Reported - Portuguese (%)
Ancestries Reported - Russian (%)
Ancestries Reported - Scotch-Irish (%)
Ancestries Reported - Scottish (%)
Ancestries Reported - Slovak (%)
Ancestries Reported - Subsaharan African (%)
Ancestries Reported - Swedish (%)
Ancestries Reported - Swiss (%)
Ancestries Reported - Ukrainian (%)
Ancestries Reported - United States (%)
Ancestries Reported - Welsh (%)
Ancestries Reported - West Indian (%)
Ancestries Reported - Other (%)
Geographical mobility - Same house 1 year ago (%)
Geographical mobility - Same house 1 year ago (%) - White
Geographical mobility - Same house 1 year ago (%) - Black or African American
Geographical mobility - Same house 1 year ago (%) - Asian
Geographical mobility - Same house 1 year ago (%) - Hispanic or Latino
Geographical mobility - Same house 1 year ago (%) - American Indian and Alaska Native
Geographical mobility - Same house 1 year ago (%) - Multirace
Geographical mobility - Same house 1 year ago (%) - Other Race
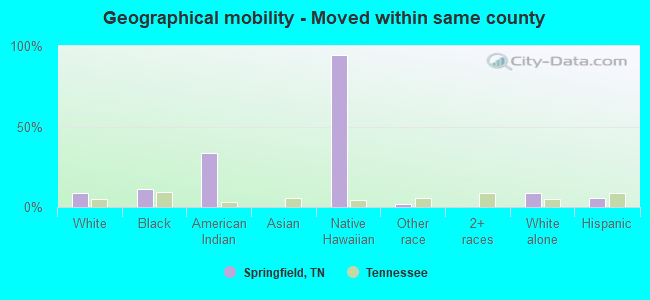
Geographical mobility - Moved within same county (%)
Geographical mobility - Moved within same county (%) - White
Geographical mobility - Moved within same county (%) - Black or African American
Geographical mobility - Moved within same county (%) - Asian
Geographical mobility - Moved within same county (%) - Hispanic or Latino
Geographical mobility - Moved within same county (%) - American Indian and Alaska Native
Geographical mobility - Moved within same county (%) - Multirace
Geographical mobility - Moved within same county (%) - Other Race
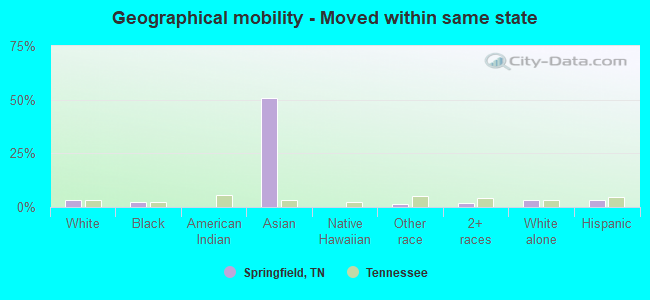
Geographical mobility - Moved from different county within same state (%)
Geographical mobility - Moved from different county within same state (%) - White
Geographical mobility - Moved from different county within same state (%) - Black or African American
Geographical mobility - Moved from different county within same state (%) - Asian
Geographical mobility - Moved from different county within same state (%) - Hispanic or Latino
Geographical mobility - Moved from different county within same state (%) - American Indian and Alaska Native
Geographical mobility - Moved from different county within same state (%) - Multirace
Geographical mobility - Moved from different county within same state (%) - Other Race
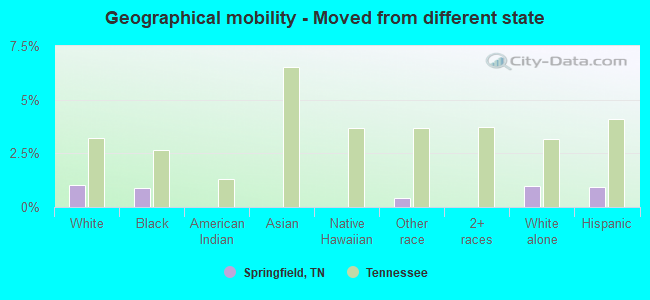
Geographical mobility - Moved from different state (%)
Geographical mobility - Moved from different state (%) - White
Geographical mobility - Moved from different state (%) - Black or African American
Geographical mobility - Moved from different state (%) - Asian
Geographical mobility - Moved from different state (%) - Hispanic or Latino
Geographical mobility - Moved from different state (%) - American Indian and Alaska Native
Geographical mobility - Moved from different state (%) - Multirace
Geographical mobility - Moved from different state (%) - Other Race
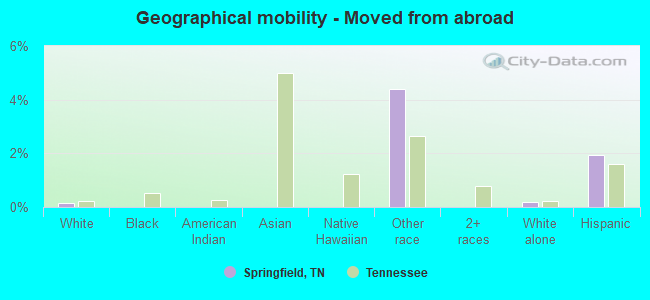
Geographical mobility - Moved from abroad (%)
Geographical mobility - Moved from abroad (%) - White
Geographical mobility - Moved from abroad (%) - Black or African American
Geographical mobility - Moved from abroad (%) - Asian
Geographical mobility - Moved from abroad (%) - Hispanic or Latino
Geographical mobility - Moved from abroad (%) - American Indian and Alaska Native
Geographical mobility - Moved from abroad (%) - Multirace
Geographical mobility - Moved from abroad (%) - Other Race
Place of birth for the foreign-born population - Ireland (%)
Place of birth for the foreign-born population - Denmark (%)
Place of birth for the foreign-born population - Norway (%)
Place of birth for the foreign-born population - Sweden (%)
Place of birth for the foreign-born population - United Kingdom (%)
Place of birth for the foreign-born population - England (%)
Place of birth for the foreign-born population - Scotland (%)
Place of birth for the foreign-born population - Other Northern Europe (%)
Place of birth for the foreign-born population - Austria (%)
Place of birth for the foreign-born population - Belgium (%)
Place of birth for the foreign-born population - France (%)
Place of birth for the foreign-born population - Germany (%)
Place of birth for the foreign-born population - Netherlands (%)
Place of birth for the foreign-born population - Switzerland (%)
Place of birth for the foreign-born population - Other Western Europe (%)
Place of birth for the foreign-born population - Greece (%)
Place of birth for the foreign-born population - Italy (%)
Place of birth for the foreign-born population - Portugal (%)
Place of birth for the foreign-born population - Spain (%)
Place of birth for the foreign-born population - Other Southern Europe (%)
Place of birth for the foreign-born population - Albania (%)
Place of birth for the foreign-born population - Belarus (%)
Place of birth for the foreign-born population - Bosnia and Herzegovina (%)
Place of birth for the foreign-born population - Bulgaria (%)
Place of birth for the foreign-born population - Croatia (%)
Place of birth for the foreign-born population - Czechoslovakia (%)
Place of birth for the foreign-born population - Hungary (%)
Place of birth for the foreign-born population - Latvia (%)
Place of birth for the foreign-born population - Lithuania (%)
Place of birth for the foreign-born population - North Macedonia (Macedonia) (%)
Place of birth for the foreign-born population - Moldova (%)
Place of birth for the foreign-born population - Poland (%)
Place of birth for the foreign-born population - Romania (%)
Place of birth for the foreign-born population - Russia (%)
Place of birth for the foreign-born population - Serbia (%)
Place of birth for the foreign-born population - Ukraine (%)
Place of birth for the foreign-born population - Other Eastern Europe (%)
Place of birth for the foreign-born population - China (%)
Place of birth for the foreign-born population - Hong Kong (%)
Place of birth for the foreign-born population - Taiwan (%)
Place of birth for the foreign-born population - Japan (%)
Place of birth for the foreign-born population - Korea (%)
Place of birth for the foreign-born population - Other Eastern Asia (%)
Place of birth for the foreign-born population - Afghanistan (%)
Place of birth for the foreign-born population - Bangladesh (%)
Place of birth for the foreign-born population - India (%)
Place of birth for the foreign-born population - Iran (%)
Place of birth for the foreign-born population - Kazakhstan (%)
Place of birth for the foreign-born population - Nepal (%)
Place of birth for the foreign-born population - Pakistan (%)
Place of birth for the foreign-born population - Sri Lanka (%)
Place of birth for the foreign-born population - Uzbekistan (%)
Place of birth for the foreign-born population - Other South Central Asia (%)
Place of birth for the foreign-born population - Burma (%)
Place of birth for the foreign-born population - Cambodia (%)
Place of birth for the foreign-born population - Indonesia (%)
Place of birth for the foreign-born population - Laos (%)
Place of birth for the foreign-born population - Malaysia (%)
Place of birth for the foreign-born population - Philippines (%)
Place of birth for the foreign-born population - Singapore (%)
Place of birth for the foreign-born population - Thailand (%)
Place of birth for the foreign-born population - Vietnam (%)
Place of birth for the foreign-born population - Other South Eastern Asia (%)
Place of birth for the foreign-born population - Armenia (%)
Place of birth for the foreign-born population - Iraq (%)
Place of birth for the foreign-born population - Israel (%)
Place of birth for the foreign-born population - Jordan (%)
Place of birth for the foreign-born population - Kuwait (%)
Place of birth for the foreign-born population - Lebanon (%)
Place of birth for the foreign-born population - Saudi Arabia (%)
Place of birth for the foreign-born population - Syria (%)
Place of birth for the foreign-born population - Turkey (%)
Place of birth for the foreign-born population - Yemen (%)
Place of birth for the foreign-born population - Other Western Asia (%)
Place of birth for the foreign-born population - Eritrea (%)
Place of birth for the foreign-born population - Ethiopia (%)
Place of birth for the foreign-born population - Kenya (%)
Place of birth for the foreign-born population - Somalia (%)
Place of birth for the foreign-born population - Uganda (%)
Place of birth for the foreign-born population - Zimbabwe (%)
Place of birth for the foreign-born population - Other Eastern Africa (%)
Place of birth for the foreign-born population - Cameroon (%)
Place of birth for the foreign-born population - Congo (%)
Place of birth for the foreign-born population - Democratic Republic of Congo (Zaire) (%)
Place of birth for the foreign-born population - Other Middle Africa (%)
Place of birth for the foreign-born population - Egypt (%)
Place of birth for the foreign-born population - Morocco (%)
Place of birth for the foreign-born population - Sudan (%)
Place of birth for the foreign-born population - Other Northern Africa (%)
Place of birth for the foreign-born population - South Africa (%)
Place of birth for the foreign-born population - Other Southern Africa (%)
Place of birth for the foreign-born population - Cabo Verde (%)
Place of birth for the foreign-born population - Ghana (%)
Place of birth for the foreign-born population - Liberia (%)
Place of birth for the foreign-born population - Nigeria (%)
Place of birth for the foreign-born population - Senegal (%)
Place of birth for the foreign-born population - Sierra Leone (%)
Place of birth for the foreign-born population - Other Western Africa (%)
Place of birth for the foreign-born population - Australia (%)
Place of birth for the foreign-born population - New Zealand (%)
Place of birth for the foreign-born population - Fiji (%)
Place of birth for the foreign-born population - Micronesia (%)
Place of birth for the foreign-born population - Bahamas (%)
Place of birth for the foreign-born population - Barbados (%)
Place of birth for the foreign-born population - Cuba (%)
Place of birth for the foreign-born population - Dominica (%)
Place of birth for the foreign-born population - Dominican Republic (%)
Place of birth for the foreign-born population - Grenada (%)
Place of birth for the foreign-born population - Haiti (%)
Place of birth for the foreign-born population - Jamaica (%)
Place of birth for the foreign-born population - St. Vincent and the Grenadines (%)
Place of birth for the foreign-born population - Trinidad and Tobago (%)
Place of birth for the foreign-born population - West Indies (%)
Place of birth for the foreign-born population - Other Caribbean (%)
Place of birth for the foreign-born population - Belize (%)
Place of birth for the foreign-born population - Costa Rica (%)
Place of birth for the foreign-born population - El Salvador (%)
Place of birth for the foreign-born population - Guatemala (%)
Place of birth for the foreign-born population - Honduras (%)
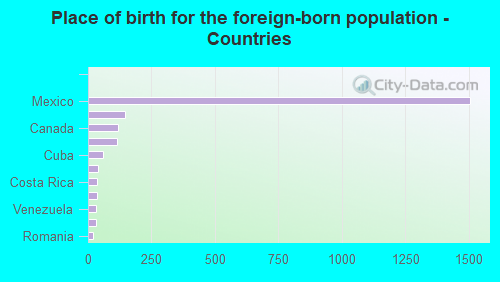
Place of birth for the foreign-born population - Mexico (%)
Place of birth for the foreign-born population - Nicaragua (%)
Place of birth for the foreign-born population - Panama (%)
Place of birth for the foreign-born population - Other Central America (%)
Place of birth for the foreign-born population - Argentina (%)
Place of birth for the foreign-born population - Bolivia (%)
Place of birth for the foreign-born population - Brazil (%)
Place of birth for the foreign-born population - Chile (%)
Place of birth for the foreign-born population - Colombia (%)
Place of birth for the foreign-born population - Ecuador (%)
Place of birth for the foreign-born population - Guyana (%)
Place of birth for the foreign-born population - Peru (%)
Place of birth for the foreign-born population - Uruguay (%)
Place of birth for the foreign-born population - Venezuela (%)
Place of birth for the foreign-born population - Other South America (%)
Place of birth for the foreign-born population - Canada (%)
Place of birth for the foreign-born population - Other Northern America (%)
Place of birth for the foreign-born population - Other (%)
Latest news about races in Springfield, TN collected exclusively by city-data.com from local newspapers, TV, and radio stations
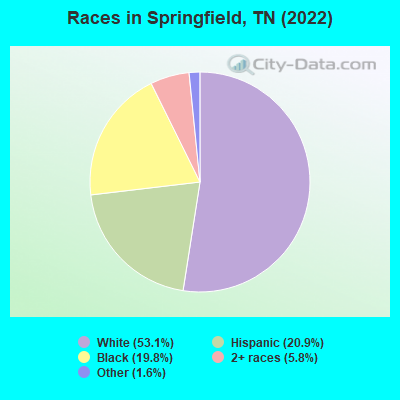
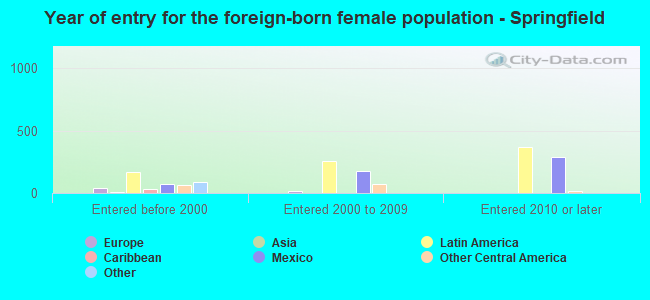
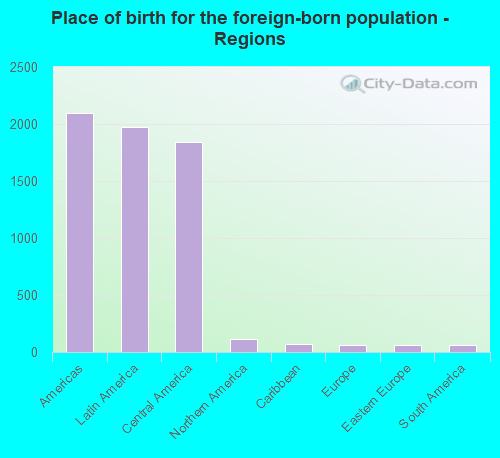
According to 2022 data, the most numerous races in Springfield, TN are White alone (10,149 residents), Black alone (3,777 residents), and Hispanic (3,998 residents). 81.4% of Springfield residents speak English at home. 11.3% of Springfield, TN residents are foreign-born (10.1% born in Latin America), which is 55.7% greater than the foreign-born rate of 5.0% across the entire state of Tennessee.
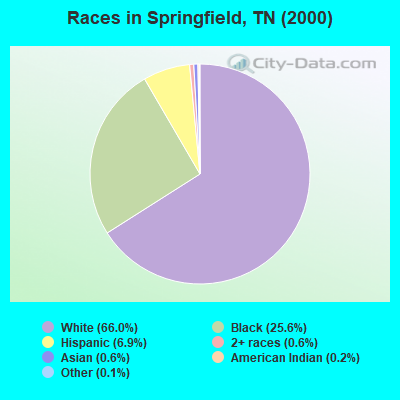
Race distribution in Springfield
2000 2022
4,505,930 79.2% White alone 928,204 16.3% Black alone 123,838 2.2% Hispanic 54,824 1.0% Two or more races 56,077 1.0% Asian alone 13,820 0.2% American Indian alone 4,780 0.08% Other race alone 1,810 0.03% Native Hawaiian and Other
5,070,026 71.9% White alone 1,089,738 15.5% Black alone 442,629 6.3% Hispanic 279,381 4.0% Two or more races 131,817 1.9% Asian alone 26,972 0.4% Other race alone 6,387 0.09% American Indian alone 4,389 0.06% Native Hawaiian and Other
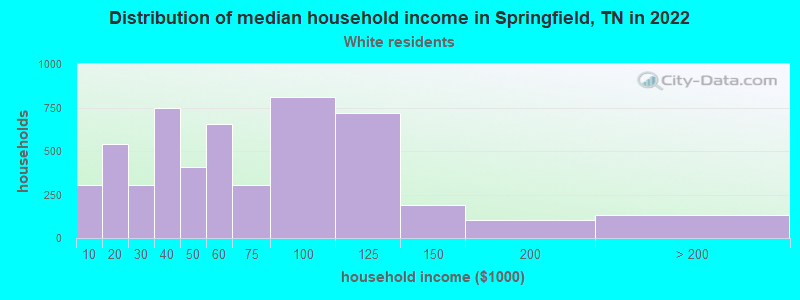
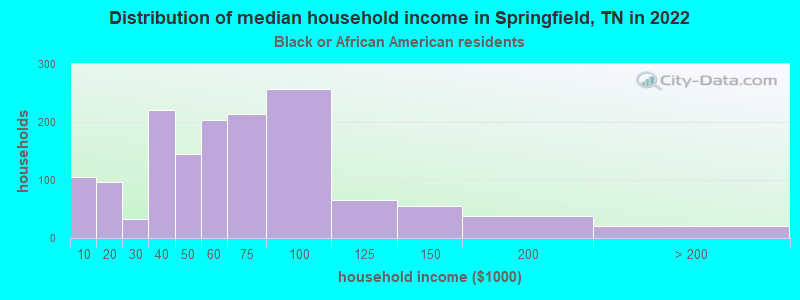
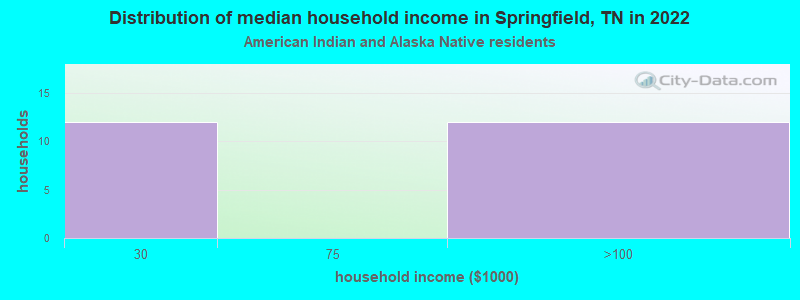
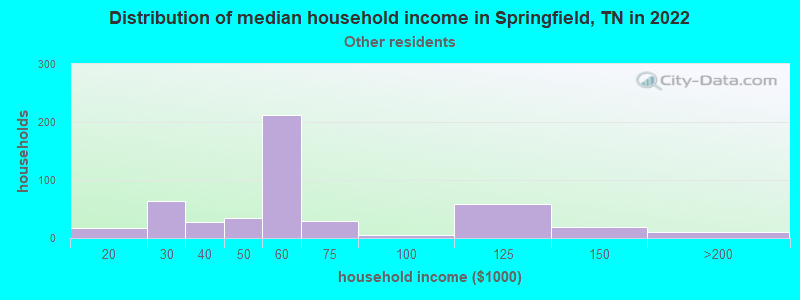
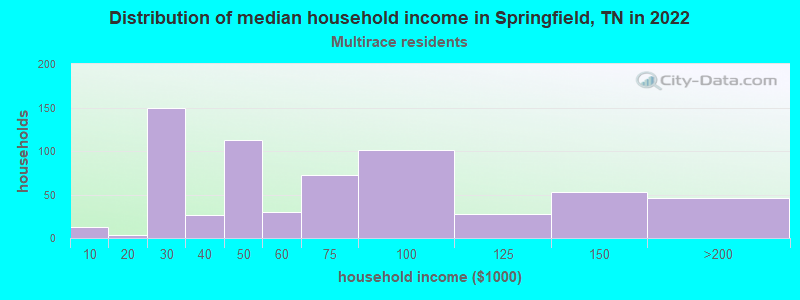
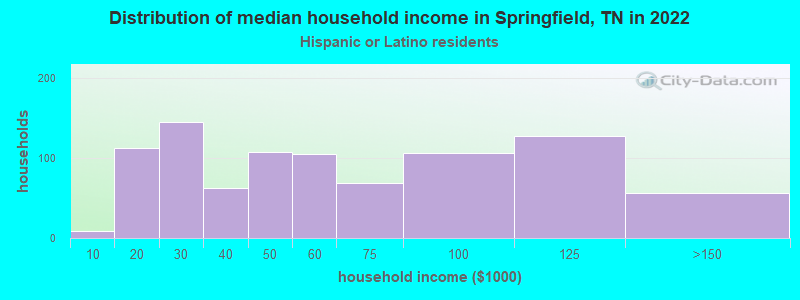
Income and house value in Springfield Median household income in 2022 $55,876 White non-Hispanic householders$84,430 Black householders$56,506 Some other race householders$91,422 Two or more races householders$63,238 Hispanic or Latino race householdersMedian 2022 house value $292,039 White Non-Hispanic householders$197,186 Black or African American householders$194,493 American Indian or Alaska Native householders$236,982 Some other race householders$229,801 Hispanic or Latino householders
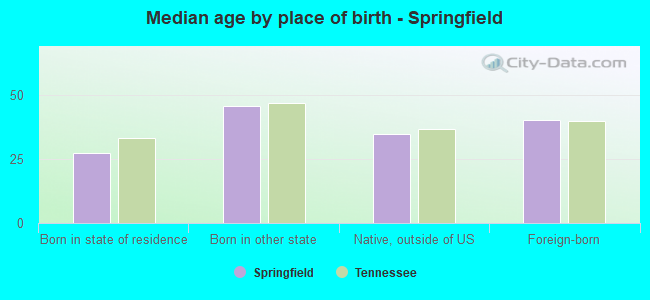
Median age by race in Springfield
37.9 Median age for White residents36.5 39.0 27.0 Median age for Black or African American residents25.3 29.4 52.4 Median age for American Indian / Alaska Native residents-633,911,367.4 53.0 -959,523,808.6 Median age for Asian residents-662,846,226.7 -686,648,500.7 -666,666,666.0 Median age for Native Hawaiian / Pacific Islander residents-666,666,666.0 -666,666,666.0 22.6 Median age for Other race residents36.0 16.9 40.5 Median age for Two or more races residents30.3 37.9 40.2 Median age for White alone residents37.5 41.6 28.4 Median age for Hispanic or Latino residents20.7 31.7
Owner/renter occupied households by race in Springfield
House owners and renters - White residents 3,190 63.8% Owner occupied1,813 36.2% Renter occupiedHouse owners and renters - Black or African American residents 418 33.5% Owner occupied828 66.5% Renter occupiedHouse owners and renters - American Indian / Alaska Native residents 12 36.3% Owner occupied22 63.7% Renter occupiedHouse owners and renters - Asian residents 10 100.0% Renter occupiedHouse owners and renters - Other race residents 127 35.3% Owner occupied232 64.7% Renter occupiedHouse owners and renters - Two or more races residents 473 70.0% Owner occupied202 30.0% Renter occupiedHouse owners and renters - White alone residents 3,081 64.3% Owner occupied1,707 35.7% Renter occupiedHouse owners and renters - Hispanic or Latino residents 402 44.1% Owner occupied509 55.9% Renter occupied
Language usage in Springfield
English speakers - Total 81.4% of residents of Springfield speak English at home.
17.8% of residents speak Spanish at home 1,638 52.9% Speak English very well1,457 47.1% Speak English less than very well1.1% of residents speak other language at home 182 98.9% Speak English very well2 1.1% Speak English less than very well
English speakers - Born in the United States 91.8% of residents of Springfield speak English at home.
6.8% of residents speak Spanish at home 286 100.0% Speak English very well1.0% of residents speak other language at home 42 97.7% Speak English very well1 2.3% Speak English less than very well
English speakers - Native, born elsewhere 65.6% of residents of Springfield speak English at home.
32.8% of residents speak Spanish at home 105 100.0% Speak English very well
English speakers - Foreign-born 7.6% of residents of Springfield speak English at home.
91.9% of residents speak Spanish at home 585 29.6% Speak English very well1,394 70.4% Speak English less than very well1.9% of residents speak other language at home 41 100.0% Speak English very well
White (Caucasian) - Speak only English Native:
96.0% (9,283)Foreign-born:
15.5% (62)
White (Caucasian) - Speak another language Native:
3.6% (348)Foreign-born:
79.2% (315)
Black or African American - Speak only English Native:
96.9% (3,444)Foreign-born:
38.4% (13)
Black or African American - Speak another language Native:
3.1% (110)Foreign-born:
61.8% (21)
Other race - Speak only English Native:
17.0% (158)Foreign-born:
1.0% (11)
Other race - Speak another language Native:
80.6% (751)Foreign-born:
100.0% (1,177)
Two or more races - Speak only English Native:
89.0% (1,172)Foreign-born:
18.1% (125)
Two or more races - Speak another language Native:
10.6% (139)Foreign-born:
82.0% (566)
White alone - Speak only English Native:
97.6% (9,053)Foreign-born:
38.4% (67)
White alone - Speak another language Native:
2.5% (229)Foreign-born:
61.7% (107)
Hispanic or Latino - Speak only English Native:
39.3% (659)Foreign-born:
1.1% (20)
Hispanic or Latino - Speak another language Native:
56.9% (955)Foreign-born:
98.8% (1,853)
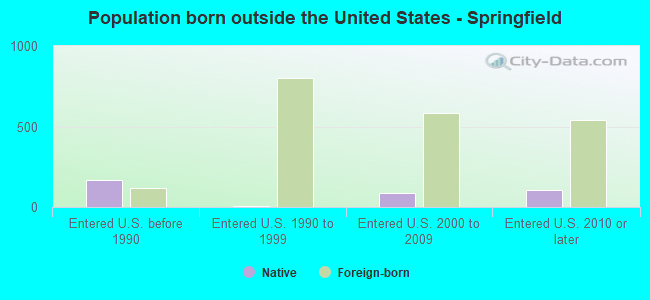
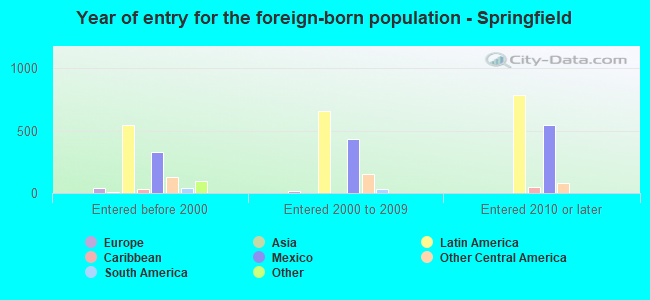
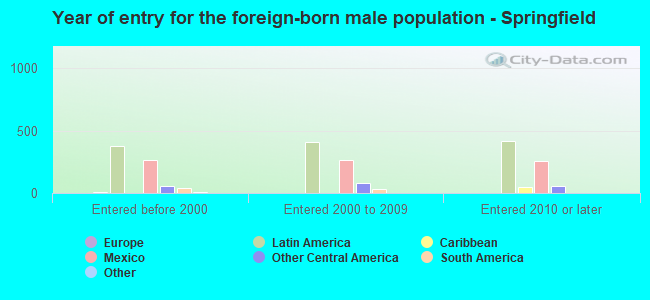
Foreign-born residents in Springfield 2,181 residents are foreign born (10.1% Latin America ).
This city:
11.3%Tennessee:
5.4%
Marital status for residents in Springfield Marital status - White (Caucasian) population 15 years and over
Males 36.2% Never married46.8% Now married1.9% Separated4.0% Widowed11.0% DivorcedFemales 23.2% Never married43.2% Now married2.2% Separated9.2% Widowed22.3% DivorcedWomen who gave birth in the past 12 months Now married:
71.6% (156)Unmarried:
28.4% (62)
Women who did not give birth in the past 12 months Now married:
47.2% (1,057)Unmarried:
52.8% (1,182)
Marital status - Black or African American population 15 years and over
Males 50.4% Never married34.1% Now married0.7% Separated3.6% Widowed11.1% DivorcedFemales 54.7% Never married16.0% Now married6.3% Separated8.7% Widowed14.2% DivorcedWomen who gave birth in the past 12 months Now married:
42.9% (32)Unmarried:
57.1% (43)
Women who did not give birth in the past 12 months Now married:
12.6% (130)Unmarried:
87.4% (906)
Marital status - American Indian / Alaska Native population 15 years and over
Males 100.0% Never married0.0% Now married0.0% Separated0.0% Widowed0.0% DivorcedFemales 50.8% Never married28.8% Now married8.5% Separated11.9% Widowed0.0% DivorcedWomen who gave birth in the past 12 months Now married:
100.0% (20)Unmarried:
0.0% (0)
Women who did not give birth in the past 12 months Now married:
0.0% (0)Unmarried:
100.0% (35)
Marital status - Other race population 15 years and over
Males 49.5% Never married34.8% Now married0.0% Separated0.8% Widowed14.9% DivorcedFemales 34.4% Never married60.3% Now married1.2% Separated4.2% Widowed0.0% DivorcedWomen who gave birth in the past 12 months Now married:
100.0% (21)Unmarried:
0.0% (0)
Women who did not give birth in the past 12 months Now married:
62.1% (349)Unmarried:
37.9% (213)
Marital status - Two or more races population 15 years and over
Males 47.1% Never married45.0% Now married0.0% Separated0.0% Widowed7.9% DivorcedFemales 38.7% Never married60.9% Now married0.0% Separated0.0% Widowed0.4% DivorcedWomen who gave birth in the past 12 months Now married:
100.0% (25)Unmarried:
0.0% (0)
Women who did not give birth in the past 12 months Now married:
41.4% (180)Unmarried:
58.6% (254)
Marital status - White alone, not Hispanic / Latino population 15 years and over
Males 34.6% Never married47.3% Now married2.1% Separated4.5% Widowed11.5% DivorcedFemales 22.4% Never married42.9% Now married2.3% Separated9.6% Widowed22.8% DivorcedWomen who gave birth in the past 12 months Now married:
71.6% (157)Unmarried:
28.4% (62)
Women who did not give birth in the past 12 months Now married:
46.5% (961)Unmarried:
53.5% (1,106)
Marital status - Hispanic or Latino population 15 years and over
Males 45.3% Never married43.1% Now married0.0% Separated0.5% Widowed11.1% DivorcedFemales 37.5% Never married52.1% Now married0.6% Separated2.8% Widowed7.0% DivorcedWomen who gave birth in the past 12 months Now married:
100.0% (39)Unmarried:
0.0% (0)
Women who did not give birth in the past 12 months Now married:
50.9% (478)Unmarried:
49.1% (462)
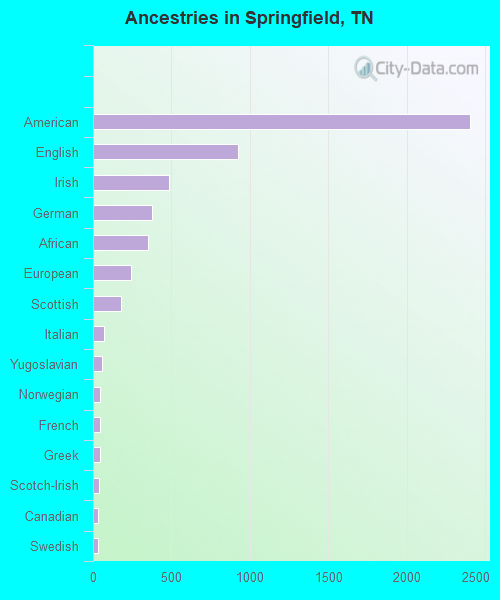
Ancestries in Springfield
2,405 21.6% American927 8.3% English484 4.4% Irish375 3.4% German353 3.2% African242 2.2% European180 1.6% Scottish73 0.7% Italian58 0.5% Yugoslavian45 0.4% Norwegian43 0.4% French43 0.4% Greek41 0.4% Scotch-Irish33 0.3% Canadian29 0.3% Swedish21 0.2% Jamaican17 0.2% Dutch10 0.09% Danish9 0.08% Belgian8 0.07% Polish7 0.06% British7 0.06% Welsh6 0.05% Lithuanian6 0.05% Haitian5 0.04% Russian2 0.02% Eastern European
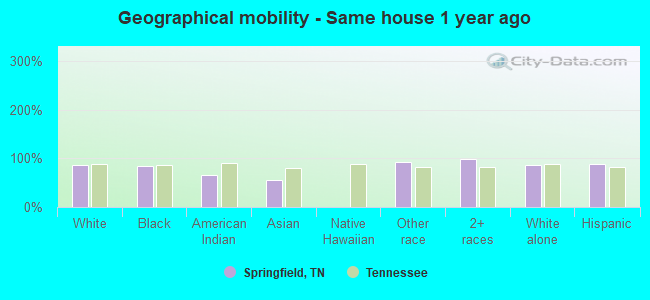
Geographical mobility in Springfield Same house 1 year ago 9,598 86.6% White (Caucasian)3,224 85.0% Black or African American51 65.9% American Indian / Alaska Native11 56.3% Asian2,380 92.5% Other race2,153 98.2% Two or more races8,884 87.0% White alone, not Hispanic / Latino3,457 87.9% Hispanic or LatinoMoved within same county 942 8.5% White / Caucasian426 11.2% Black or African American26 33.7% American Indian / Alaska Native2 94.6% Native Hawaiian / Pacific Islander44 1.7% Other race858 8.4% White alone, not Hispanic / Latino224 5.7% Hispanic or LatinoMoved within same state 346 3.1% White / Caucasian94 2.5% Black or African American10 51.0% Asian31 1.2% Other race44 2.0% Two or more races326 3.2% White alone, not Hispanic / Latino129 3.3% Hispanic or LatinoMoved from different state 115 1.0% White / Caucasian33 0.9% Black or African American10 0.4% Other race99 1.0% White alone, not Hispanic / Latino37 0.9% Hispanic or LatinoMoved from abroad 18 0.2% White114 4.4% Other race18 0.2% White alone, not Hispanic / Latino77 1.9% Hispanic or Latino
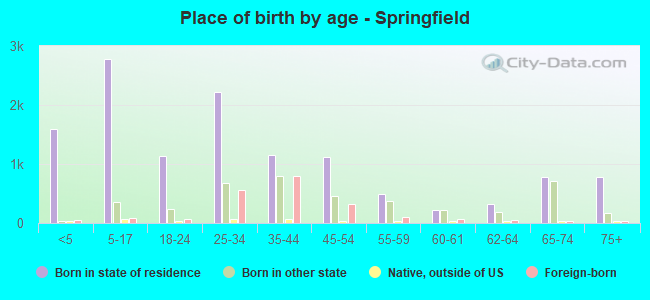
Children Nativity (place of birth) in Springfield
Children under 6 years - Living with two parents Both parents native 513 100.0% NativeBoth parents foreign-born 178 85.0% Native31 15.0% Foreign-bornOne native, one foreign-born parent 384 100.0% NativeChildren under 6 years - Living with one parent Native parent 567 99.9% Native1 0.1% Foreign-bornForeign-born parent 109 86.4% Native17 13.6% Foreign-bornChildren 6 to 17 years - Living with two parents Both parents native 970 100.0% NativeBoth parents foreign-born 296 72.9% Native110 27.1% Foreign-bornOne native, one foreign-born parent 199 100.0% NativeChildren 6 to 17 years - Living with one parent Native parent 1,008 100.0% NativeForeign-born parent 214 62.1% Native131 37.9% Foreign-born
Grandparents responsible for own grandchildren in Springfield
Grandparents (30 to 59 years) White / Caucasian 43 88.9% Responsible for grandchildren5 11.1% Not responsible for grandchildrenBlack or African American 40 74.6% Responsible for grandchildren14 25.4% Not responsible for grandchildrenTwo or more races 16 14.2% Responsible for grandchildren99 85.8% Not responsible for grandchildrenWhite alone, not Hispanic / Latino 43 88.7% Responsible for grandchildren5 11.3% Not responsible for grandchildrenHispanic or Latino 21 100.0% Not responsible for grandchildrenGrandparents (60 years and over) White / Caucasian 43 40.7% Responsible for grandchildren63 59.3% Not responsible for grandchildrenBlack or African American 72 51.2% Responsible for grandchildren68 48.8% Not responsible for grandchildrenWhite alone, not Hispanic / Latino 44 40.8% Responsible for grandchildren63 59.2% Not responsible for grandchildren