Races in Springbrook, Wisconsin (WI) Detailed Stats
Ancestries, Foreign-born residents, place of birth
Data:
1.1% of Springbrook, WI residents are foreign-born , which is 346.7% less than the foreign-born rate of 5.0% across the entire state of Wisconsin.
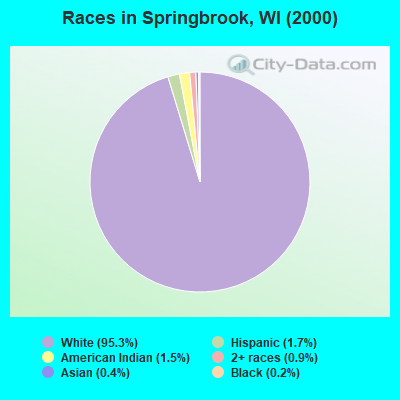
Race distribution in Springbrook

- 51195.3%White alone
- 91.7%Hispanic
- 81.5%American Indian alone
- 50.9%Two or more races
- 20.4%Asian alone
- 10.2%Black alone
2000
2022
-
- 4,681,63087.3%White alone
- 300,2455.6%Black alone
- 192,9213.6%Hispanic
- 87,9951.6%Asian alone
- 51,9211.0%Two or more races
- 43,9800.8%American Indian alone
- 3,6370.07%Other race alone
- 1,3460.03%Native Hawaiian and Other
Pacific Islander alone
-
- 4,654,03179.0%White alone
- 447,0227.6%Hispanic
- 345,6785.9%Black alone
- 217,5323.7%Two or more races
- 172,2422.9%Asian alone
- 33,7620.6%American Indian alone
- 19,6800.3%Other race alone
- 2,5920.04%Native Hawaiian and Other
Pacific Islander alone
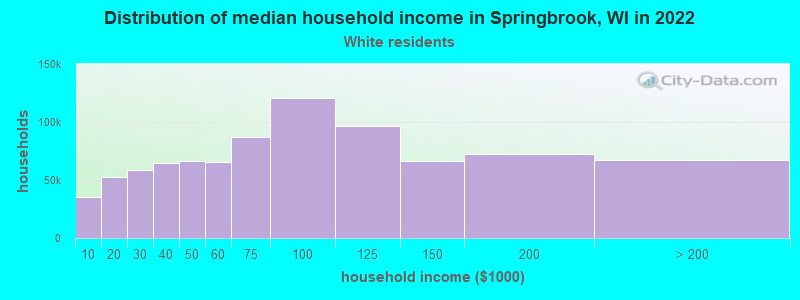
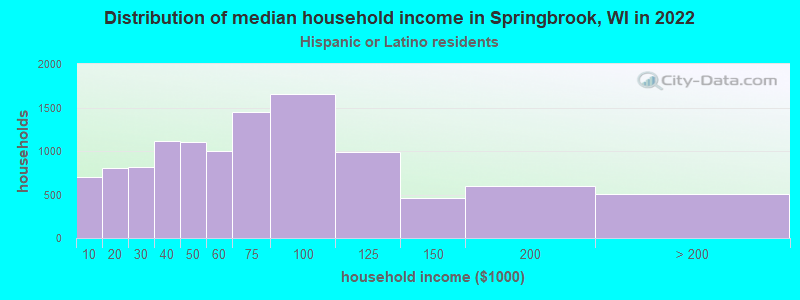
Income and house value in Springbrook
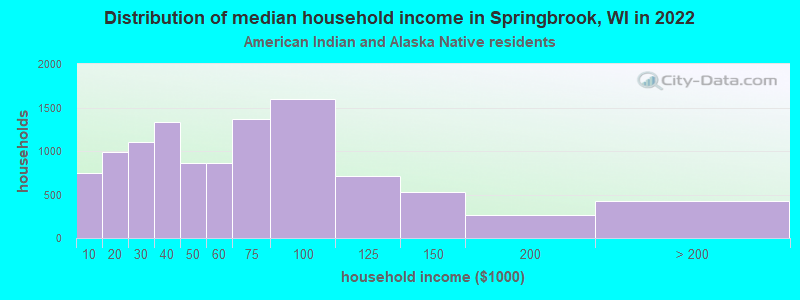
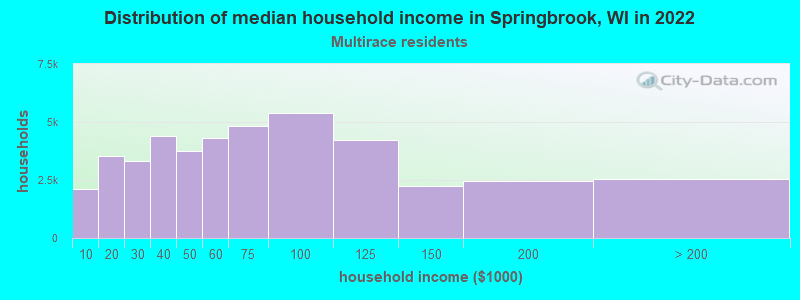
- Median household income in 2022
- $62,398White non-Hispanic householders
- $71,151American Indian and Alaska Native householders
- $40,140Two or more races householders
- $10,327Hispanic or Latino race householders
- Median 2022 house value
- $195,022White Non-Hispanic householders
- $139,846American Indian or Alaska Native householders
- $139,846Two or more races householders
Foreign-born residents in Springbrook
6 residents are foreign born
| This city: | 1.1% |
| Wisconsin: | 3.6% |
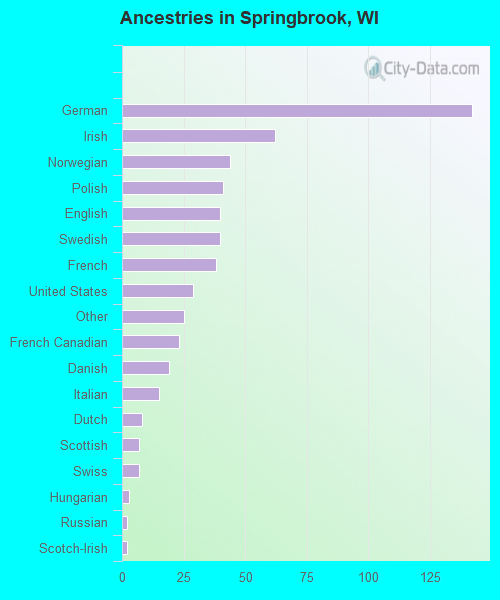
Ancestries in Springbrook

- 14226.0%German
- 6211.3%Irish
- 448.0%Norwegian
- 417.5%Polish
- 407.3%English
- 407.3%Swedish
- 386.9%French
- 295.3%United States
- 254.6%Other
- 234.2%French Canadian
- 193.5%Danish
- 152.7%Italian
- 81.5%Dutch
- 71.3%Scottish
- 71.3%Swiss
- 30.5%Hungarian
- 20.4%Russian
- 20.4%Scotch-Irish