Races in Spokane Reservation, Washington (WA) Detailed Stats
Ancestries, Foreign-born residents, place of birth
Race distribution in Spokane Reservation

- 1,46773.2%American Indian alone
- 36518.2%White alone
- 874.3%Hispanic
- 663.3%Two or more races
- 120.6%Asian alone
- 60.3%Black alone
- 10.05%Native Hawaiian and Other
Pacific Islander alone
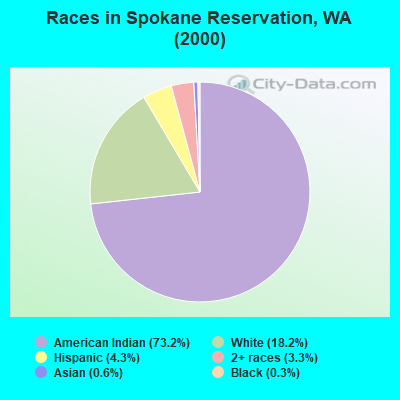
2000
2022
-
- 4,652,49078.9%White alone
- 441,5097.5%Hispanic
- 319,4015.4%Asian alone
- 184,6313.1%Black alone
- 175,9263.0%Two or more races
- 85,3961.4%American Indian alone
- 22,7790.4%Native Hawaiian and Other
Pacific Islander alone - 11,9890.2%Other race alone

-
- 4,941,45663.5%White alone
- 1,093,31314.0%Hispanic
- 755,8329.7%Asian alone
- 523,4486.7%Two or more races
- 299,5373.8%Black alone
- 69,0240.9%American Indian alone
- 52,2310.7%Native Hawaiian and Other
Pacific Islander alone - 50,9450.7%Other race alone

Income and house value in Spokane Reservation
- Median household income in 2022
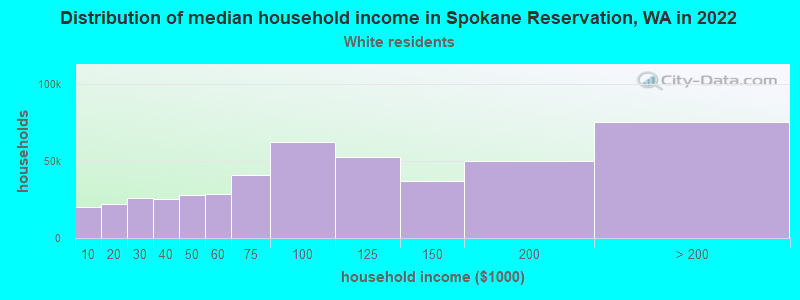
- $37,917White non-Hispanic householders
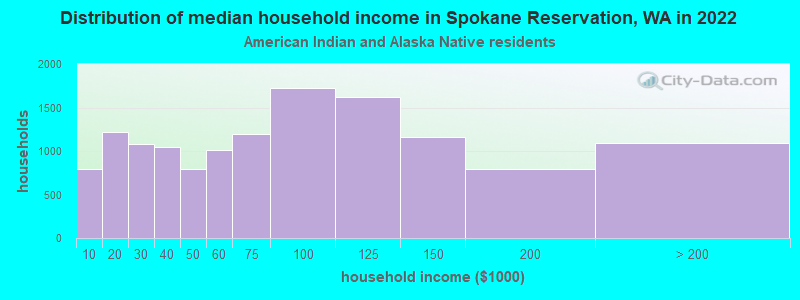
- $55,807American Indian and Alaska Native householders
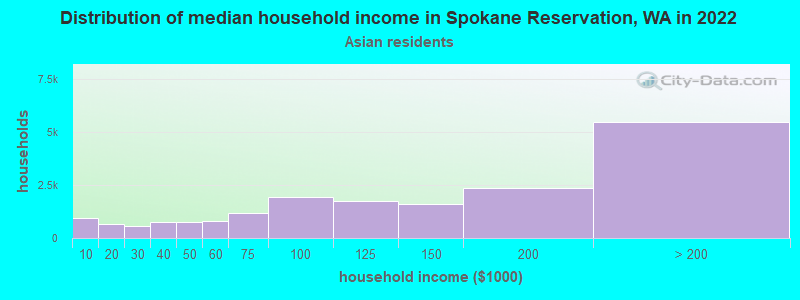
- $11,272Asian householders
- $11,961Some other race householders
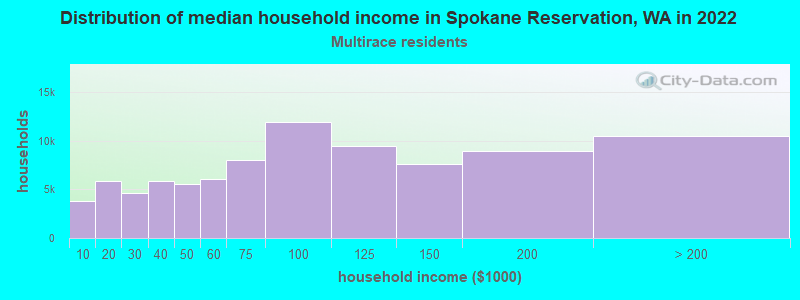
- $54,918Two or more races householders
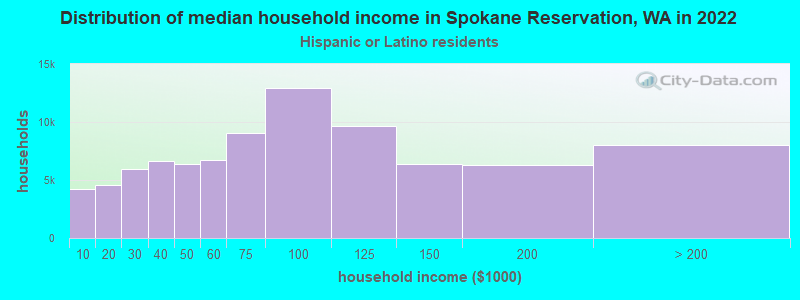
- $43,095Hispanic or Latino race householders
- Median 2022 house value
- $247,563White Non-Hispanic householders
- $221,878American Indian or Alaska Native householders
- $348,136Some other race householders
- $105,833Two or more races householders
- $348,136Hispanic or Latino householders
Household income for White non-Hispanic householders
Household income for American Indian and Alaska Native householders
Household income for Asian householders
Household income for Two or more races householders
Household income for Hispanic or Latino race householders