Races in Spanish Fork, Utah (UT) Detailed Stats
Data:
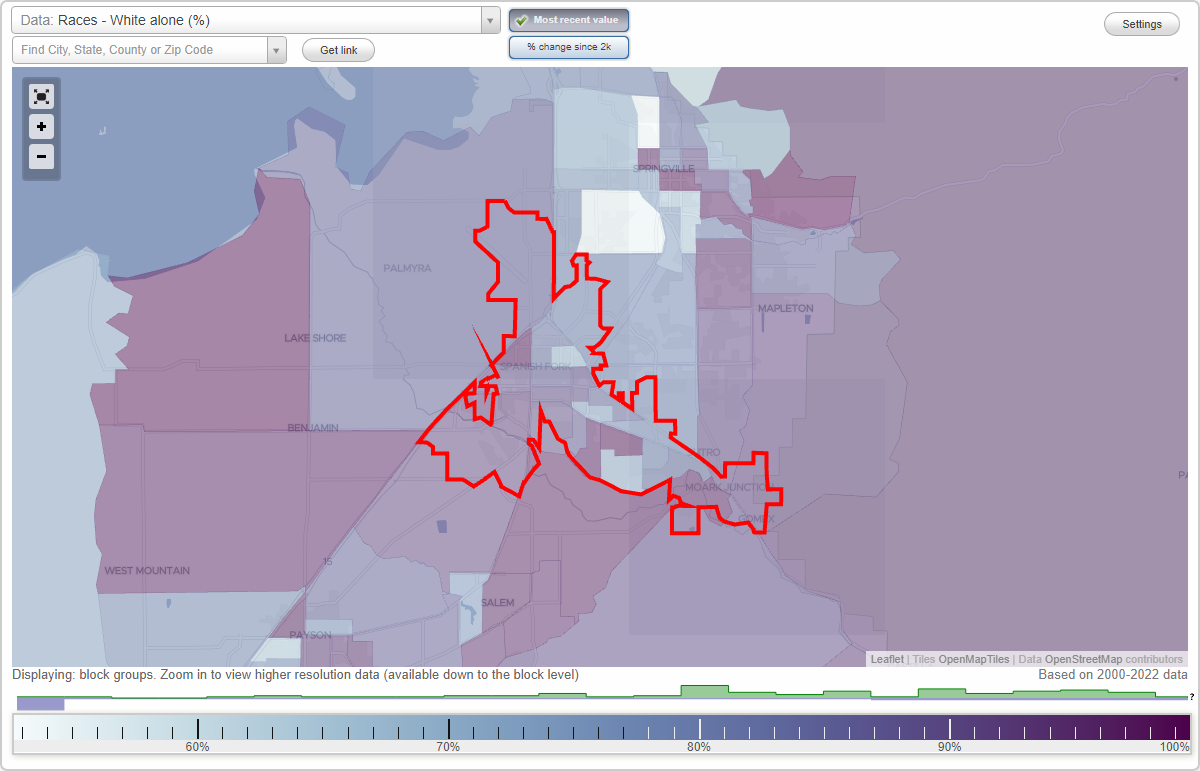
Races - White alone (%)
Races - White alone (% change since 2000)
Races - Black alone (%)
Races - Black alone (% change since 2000)
Races - American Indian alone (%)
Races - American Indian alone (% change since 2000)
Races - Asian alone (%)
Races - Asian alone (% change since 2000)
Races - Hispanic (%)
Races - Hispanic (% change since 2000)
Races - Native Hawaiian and Other Pacific Islander alone (%)
Races - Native Hawaiian and Other Pacific Islander alone (% change since 2000)
Races - Two or more races(%)
Races - Two or more races(% change since 2000)
Races - Other race alone (%)
Races - Other race alone (% change since 2000)
Racial diversity
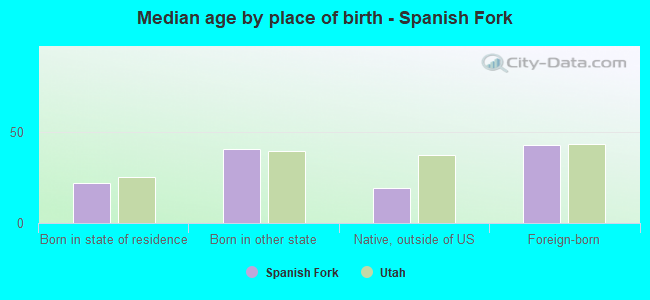
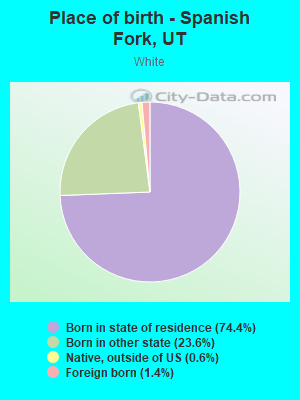
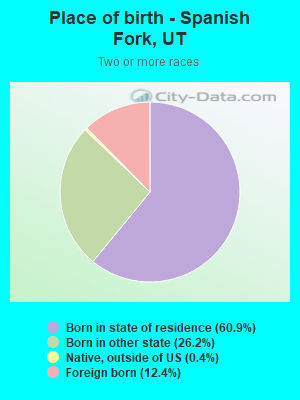
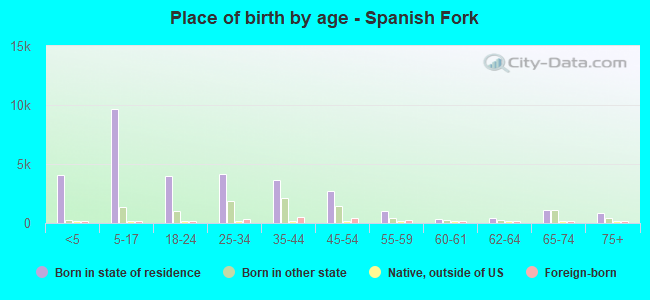
Place of birth - Born in state of residence (%)
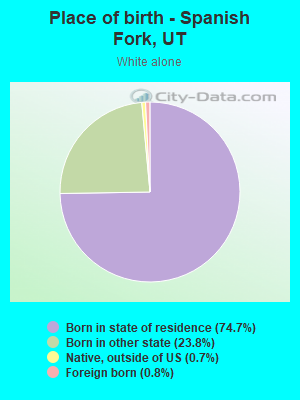
Place of birth - Born in state of residence (%) - White
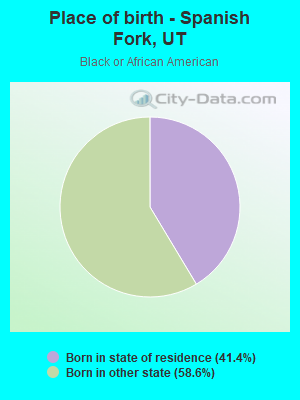
Place of birth - Born in state of residence (%) - Black or African American
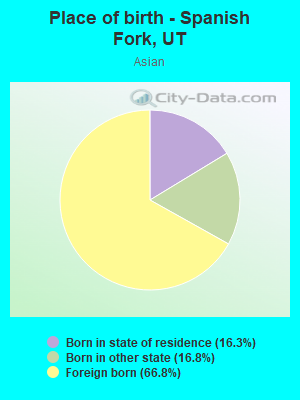
Place of birth - Born in state of residence (%) - Asian
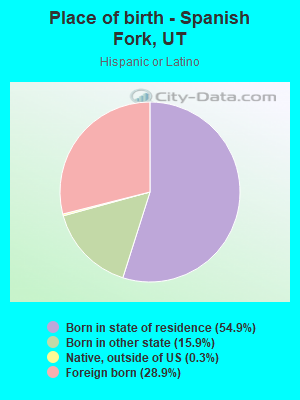
Place of birth - Born in state of residence (%) - Hispanic or Latino
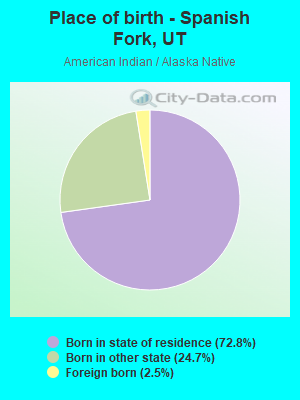
Place of birth - Born in state of residence (%) - American Indian and Alaska Native
Place of birth - Born in state of residence (%) - Multirace
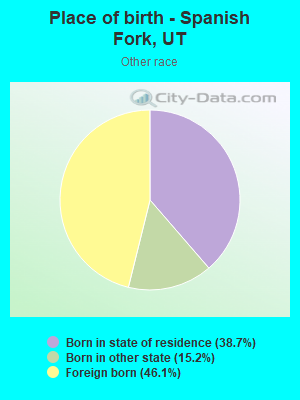
Place of birth - Born in state of residence (%) - Other Race
Place of birth - Born in other state (%)
Place of birth - Born in other state (%) - White
Place of birth - Born in other state (%) - Black or African American
Place of birth - Born in other state (%) - Asian
Place of birth - Born in other state (%) - Hispanic or Latino
Place of birth - Born in other state (%) - American Indian and Alaska Native
Place of birth - Born in other state (%) - Multirace
Place of birth - Born in other state (%) - Other Race
Place of birth - Native, outside of US (%)
Place of birth - Native, outside of US (%) - White
Place of birth - Native, outside of US (%) - Black or African American
Place of birth - Native, outside of US (%) - Asian
Place of birth - Native, outside of US (%) - Hispanic or Latino
Place of birth - Native, outside of US (%) - American Indian and Alaska Native
Place of birth - Native, outside of US (%) - Multirace
Place of birth - Native, outside of US (%) - Other Race
Place of birth - Foreign born (%)
Place of birth - Foreign born (%) - White
Place of birth - Foreign born (%) - Black or African American
Place of birth - Foreign born (%) - Asian
Place of birth - Foreign born (%) - Hispanic or Latino
Place of birth - Foreign born (%) - American Indian and Alaska Native
Place of birth - Foreign born (%) - Multirace
Place of birth - Foreign born (%) - Other Race
Residents speaking English at home (%)
Residents speaking English at home - Born in the United States (%)
Residents speaking English at home - Native, born elsewhere (%)
Residents speaking English at home - Foreign born (%)
Residents speaking Spanish at home (%)
Residents speaking Spanish at home - Born in the United States (%)
Residents speaking Spanish at home - Native, born elsewhere (%)
Residents speaking Spanish at home - Foreign born (%)
Residents speaking other language at home (%)
Residents speaking other language at home - Born in the United States (%)
Residents speaking other language at home - Native, born elsewhere (%)
Residents speaking other language at home - Foreign born (%)
Marital status - Never married (%)
Marital status - Now married (%)
Marital status - Separated (%)
Marital status - Widowed (%)
Marital status - Divorced (%)
Ancestries Reported - Arab (%)
Ancestries Reported - Czech (%)
Ancestries Reported - Danish (%)
Ancestries Reported - Dutch (%)
Ancestries Reported - English (%)
Ancestries Reported - French (%)
Ancestries Reported - French Canadian (%)
Ancestries Reported - German (%)
Ancestries Reported - Greek (%)
Ancestries Reported - Hungarian (%)
Ancestries Reported - Irish (%)
Ancestries Reported - Italian (%)
Ancestries Reported - Lithuanian (%)
Ancestries Reported - Norwegian (%)
Ancestries Reported - Polish (%)
Ancestries Reported - Portuguese (%)
Ancestries Reported - Russian (%)
Ancestries Reported - Scotch-Irish (%)
Ancestries Reported - Scottish (%)
Ancestries Reported - Slovak (%)
Ancestries Reported - Subsaharan African (%)
Ancestries Reported - Swedish (%)
Ancestries Reported - Swiss (%)
Ancestries Reported - Ukrainian (%)
Ancestries Reported - United States (%)
Ancestries Reported - Welsh (%)
Ancestries Reported - West Indian (%)
Ancestries Reported - Other (%)
Geographical mobility - Same house 1 year ago (%)
Geographical mobility - Same house 1 year ago (%) - White
Geographical mobility - Same house 1 year ago (%) - Black or African American
Geographical mobility - Same house 1 year ago (%) - Asian
Geographical mobility - Same house 1 year ago (%) - Hispanic or Latino
Geographical mobility - Same house 1 year ago (%) - American Indian and Alaska Native
Geographical mobility - Same house 1 year ago (%) - Multirace
Geographical mobility - Same house 1 year ago (%) - Other Race
Geographical mobility - Moved within same county (%)
Geographical mobility - Moved within same county (%) - White
Geographical mobility - Moved within same county (%) - Black or African American
Geographical mobility - Moved within same county (%) - Asian
Geographical mobility - Moved within same county (%) - Hispanic or Latino
Geographical mobility - Moved within same county (%) - American Indian and Alaska Native
Geographical mobility - Moved within same county (%) - Multirace
Geographical mobility - Moved within same county (%) - Other Race
Geographical mobility - Moved from different county within same state (%)
Geographical mobility - Moved from different county within same state (%) - White
Geographical mobility - Moved from different county within same state (%) - Black or African American
Geographical mobility - Moved from different county within same state (%) - Asian
Geographical mobility - Moved from different county within same state (%) - Hispanic or Latino
Geographical mobility - Moved from different county within same state (%) - American Indian and Alaska Native
Geographical mobility - Moved from different county within same state (%) - Multirace
Geographical mobility - Moved from different county within same state (%) - Other Race
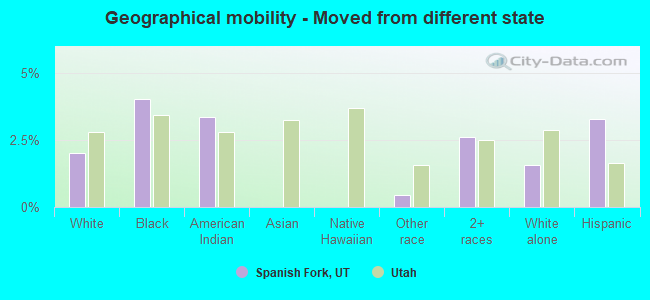
Geographical mobility - Moved from different state (%)
Geographical mobility - Moved from different state (%) - White
Geographical mobility - Moved from different state (%) - Black or African American
Geographical mobility - Moved from different state (%) - Asian
Geographical mobility - Moved from different state (%) - Hispanic or Latino
Geographical mobility - Moved from different state (%) - American Indian and Alaska Native
Geographical mobility - Moved from different state (%) - Multirace
Geographical mobility - Moved from different state (%) - Other Race
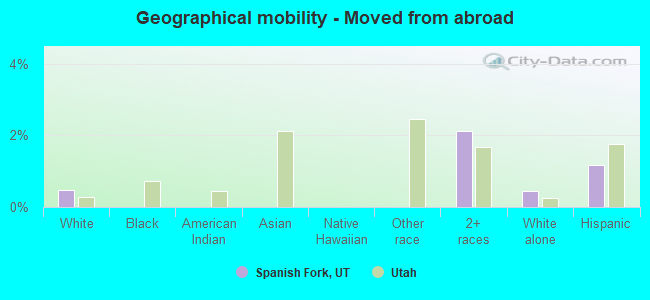
Geographical mobility - Moved from abroad (%)
Geographical mobility - Moved from abroad (%) - White
Geographical mobility - Moved from abroad (%) - Black or African American
Geographical mobility - Moved from abroad (%) - Asian
Geographical mobility - Moved from abroad (%) - Hispanic or Latino
Geographical mobility - Moved from abroad (%) - American Indian and Alaska Native
Geographical mobility - Moved from abroad (%) - Multirace
Geographical mobility - Moved from abroad (%) - Other Race
Place of birth for the foreign-born population - Ireland (%)
Place of birth for the foreign-born population - Denmark (%)
Place of birth for the foreign-born population - Norway (%)
Place of birth for the foreign-born population - Sweden (%)
Place of birth for the foreign-born population - United Kingdom (%)
Place of birth for the foreign-born population - England (%)
Place of birth for the foreign-born population - Scotland (%)
Place of birth for the foreign-born population - Other Northern Europe (%)
Place of birth for the foreign-born population - Austria (%)
Place of birth for the foreign-born population - Belgium (%)
Place of birth for the foreign-born population - France (%)
Place of birth for the foreign-born population - Germany (%)
Place of birth for the foreign-born population - Netherlands (%)
Place of birth for the foreign-born population - Switzerland (%)
Place of birth for the foreign-born population - Other Western Europe (%)
Place of birth for the foreign-born population - Greece (%)
Place of birth for the foreign-born population - Italy (%)
Place of birth for the foreign-born population - Portugal (%)
Place of birth for the foreign-born population - Spain (%)
Place of birth for the foreign-born population - Other Southern Europe (%)
Place of birth for the foreign-born population - Albania (%)
Place of birth for the foreign-born population - Belarus (%)
Place of birth for the foreign-born population - Bosnia and Herzegovina (%)
Place of birth for the foreign-born population - Bulgaria (%)
Place of birth for the foreign-born population - Croatia (%)
Place of birth for the foreign-born population - Czechoslovakia (%)
Place of birth for the foreign-born population - Hungary (%)
Place of birth for the foreign-born population - Latvia (%)
Place of birth for the foreign-born population - Lithuania (%)
Place of birth for the foreign-born population - North Macedonia (Macedonia) (%)
Place of birth for the foreign-born population - Moldova (%)
Place of birth for the foreign-born population - Poland (%)
Place of birth for the foreign-born population - Romania (%)
Place of birth for the foreign-born population - Russia (%)
Place of birth for the foreign-born population - Serbia (%)
Place of birth for the foreign-born population - Ukraine (%)
Place of birth for the foreign-born population - Other Eastern Europe (%)
Place of birth for the foreign-born population - China (%)
Place of birth for the foreign-born population - Hong Kong (%)
Place of birth for the foreign-born population - Taiwan (%)
Place of birth for the foreign-born population - Japan (%)
Place of birth for the foreign-born population - Korea (%)
Place of birth for the foreign-born population - Other Eastern Asia (%)
Place of birth for the foreign-born population - Afghanistan (%)
Place of birth for the foreign-born population - Bangladesh (%)
Place of birth for the foreign-born population - India (%)
Place of birth for the foreign-born population - Iran (%)
Place of birth for the foreign-born population - Kazakhstan (%)
Place of birth for the foreign-born population - Nepal (%)
Place of birth for the foreign-born population - Pakistan (%)
Place of birth for the foreign-born population - Sri Lanka (%)
Place of birth for the foreign-born population - Uzbekistan (%)
Place of birth for the foreign-born population - Other South Central Asia (%)
Place of birth for the foreign-born population - Burma (%)
Place of birth for the foreign-born population - Cambodia (%)
Place of birth for the foreign-born population - Indonesia (%)
Place of birth for the foreign-born population - Laos (%)
Place of birth for the foreign-born population - Malaysia (%)
Place of birth for the foreign-born population - Philippines (%)
Place of birth for the foreign-born population - Singapore (%)
Place of birth for the foreign-born population - Thailand (%)
Place of birth for the foreign-born population - Vietnam (%)
Place of birth for the foreign-born population - Other South Eastern Asia (%)
Place of birth for the foreign-born population - Armenia (%)
Place of birth for the foreign-born population - Iraq (%)
Place of birth for the foreign-born population - Israel (%)
Place of birth for the foreign-born population - Jordan (%)
Place of birth for the foreign-born population - Kuwait (%)
Place of birth for the foreign-born population - Lebanon (%)
Place of birth for the foreign-born population - Saudi Arabia (%)
Place of birth for the foreign-born population - Syria (%)
Place of birth for the foreign-born population - Turkey (%)
Place of birth for the foreign-born population - Yemen (%)
Place of birth for the foreign-born population - Other Western Asia (%)
Place of birth for the foreign-born population - Eritrea (%)
Place of birth for the foreign-born population - Ethiopia (%)
Place of birth for the foreign-born population - Kenya (%)
Place of birth for the foreign-born population - Somalia (%)
Place of birth for the foreign-born population - Uganda (%)
Place of birth for the foreign-born population - Zimbabwe (%)
Place of birth for the foreign-born population - Other Eastern Africa (%)
Place of birth for the foreign-born population - Cameroon (%)
Place of birth for the foreign-born population - Congo (%)
Place of birth for the foreign-born population - Democratic Republic of Congo (Zaire) (%)
Place of birth for the foreign-born population - Other Middle Africa (%)
Place of birth for the foreign-born population - Egypt (%)
Place of birth for the foreign-born population - Morocco (%)
Place of birth for the foreign-born population - Sudan (%)
Place of birth for the foreign-born population - Other Northern Africa (%)
Place of birth for the foreign-born population - South Africa (%)
Place of birth for the foreign-born population - Other Southern Africa (%)
Place of birth for the foreign-born population - Cabo Verde (%)
Place of birth for the foreign-born population - Ghana (%)
Place of birth for the foreign-born population - Liberia (%)
Place of birth for the foreign-born population - Nigeria (%)
Place of birth for the foreign-born population - Senegal (%)
Place of birth for the foreign-born population - Sierra Leone (%)
Place of birth for the foreign-born population - Other Western Africa (%)
Place of birth for the foreign-born population - Australia (%)
Place of birth for the foreign-born population - New Zealand (%)
Place of birth for the foreign-born population - Fiji (%)
Place of birth for the foreign-born population - Micronesia (%)
Place of birth for the foreign-born population - Bahamas (%)
Place of birth for the foreign-born population - Barbados (%)
Place of birth for the foreign-born population - Cuba (%)
Place of birth for the foreign-born population - Dominica (%)
Place of birth for the foreign-born population - Dominican Republic (%)
Place of birth for the foreign-born population - Grenada (%)
Place of birth for the foreign-born population - Haiti (%)
Place of birth for the foreign-born population - Jamaica (%)
Place of birth for the foreign-born population - St. Vincent and the Grenadines (%)
Place of birth for the foreign-born population - Trinidad and Tobago (%)
Place of birth for the foreign-born population - West Indies (%)
Place of birth for the foreign-born population - Other Caribbean (%)
Place of birth for the foreign-born population - Belize (%)
Place of birth for the foreign-born population - Costa Rica (%)
Place of birth for the foreign-born population - El Salvador (%)
Place of birth for the foreign-born population - Guatemala (%)
Place of birth for the foreign-born population - Honduras (%)
Place of birth for the foreign-born population - Mexico (%)
Place of birth for the foreign-born population - Nicaragua (%)
Place of birth for the foreign-born population - Panama (%)
Place of birth for the foreign-born population - Other Central America (%)
Place of birth for the foreign-born population - Argentina (%)
Place of birth for the foreign-born population - Bolivia (%)
Place of birth for the foreign-born population - Brazil (%)
Place of birth for the foreign-born population - Chile (%)
Place of birth for the foreign-born population - Colombia (%)
Place of birth for the foreign-born population - Ecuador (%)
Place of birth for the foreign-born population - Guyana (%)
Place of birth for the foreign-born population - Peru (%)
Place of birth for the foreign-born population - Uruguay (%)
Place of birth for the foreign-born population - Venezuela (%)
Place of birth for the foreign-born population - Other South America (%)
Place of birth for the foreign-born population - Canada (%)
Place of birth for the foreign-born population - Other Northern America (%)
Place of birth for the foreign-born population - Other (%)
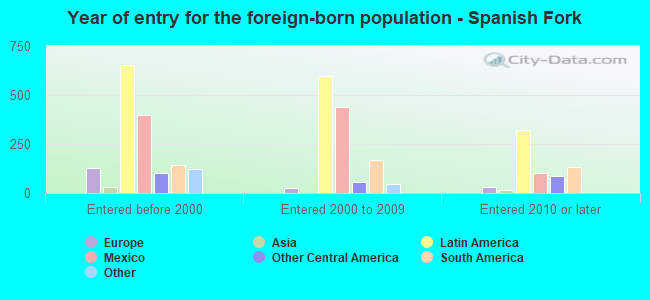
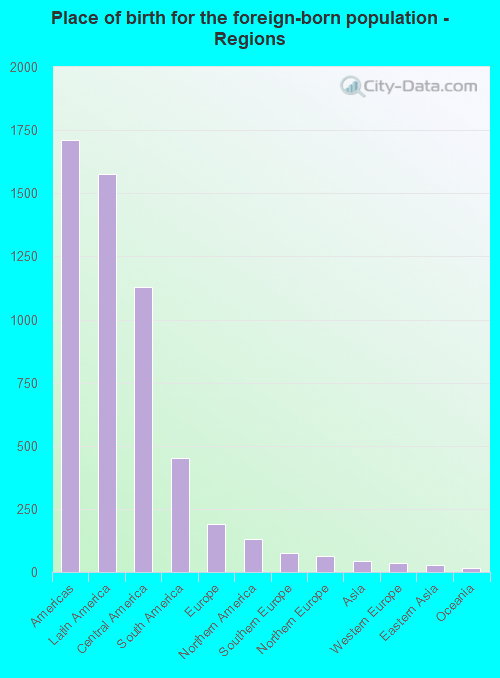
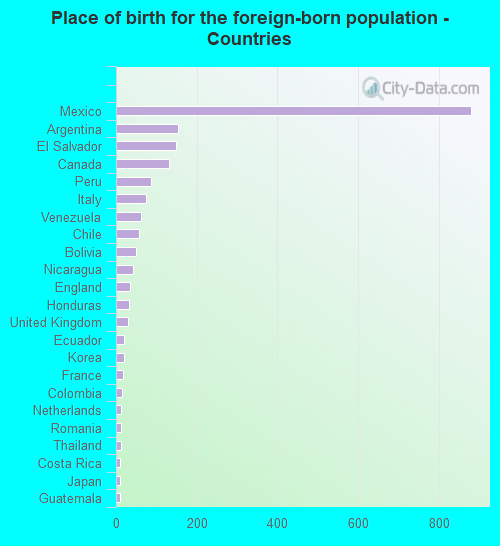
According to 2022 data, the most numerous races in Spanish Fork, UT are White alone (36,804 residents), Hispanic (5,672 residents), and Two or more races (1,575 residents). 88.3% of Spanish Fork residents speak English at home. 4.4% of Spanish Fork, UT residents are foreign-born (3.5% born in Latin America), which is 83.3% less than the foreign-born rate of 8.0% across the entire state of Utah.
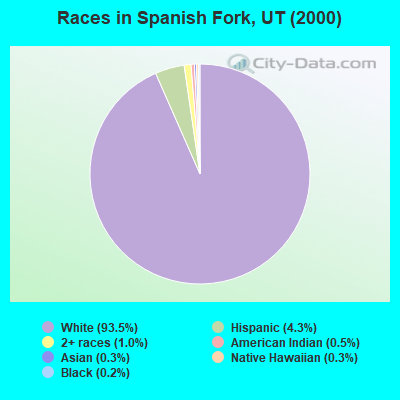
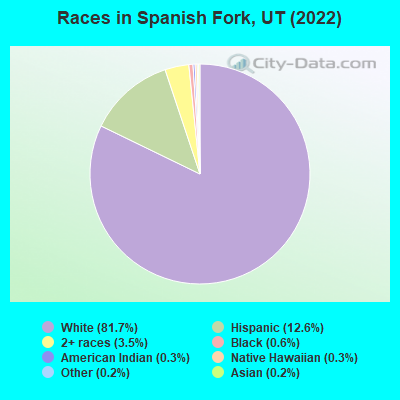
Race distribution in Spanish Fork
2000 2022
1,904,265 85.3% White alone 201,559 9.0% Hispanic 36,483 1.6% Asian alone 31,308 1.4% Two or more races 26,663 1.2% American Indian alone 14,806 0.7% Native Hawaiian and Other 16,137 0.7% Black alone 1,948 0.09% Other race alone
2,557,466 75.6% White alone 512,086 15.1% Hispanic 119,308 3.5% Two or more races 82,388 2.4% Asian alone 36,978 1.1% Native Hawaiian and Other 34,873 1.0% Black alone 22,803 0.7% American Indian alone 14,898 0.4% Other race alone
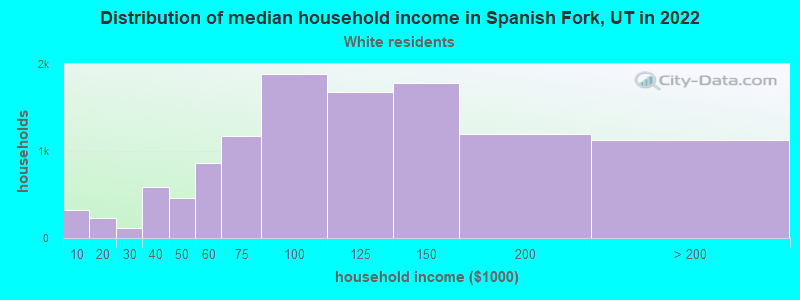
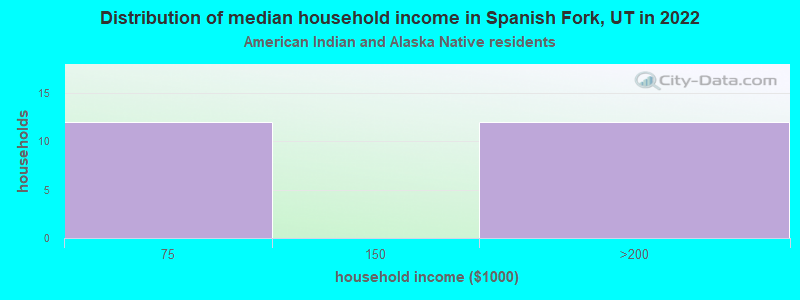
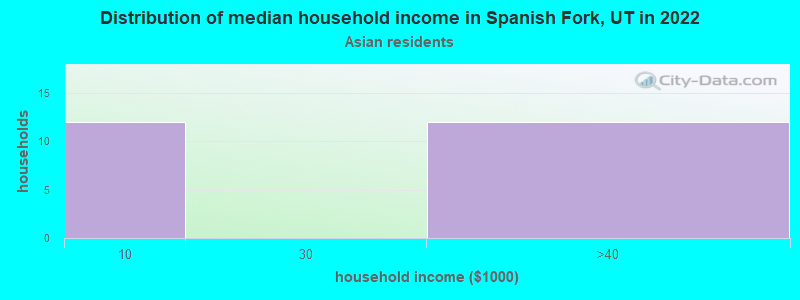
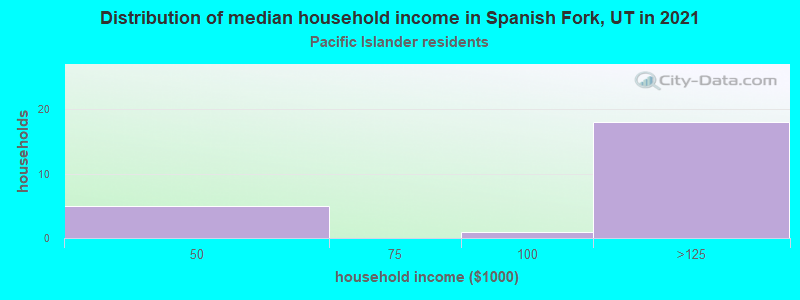
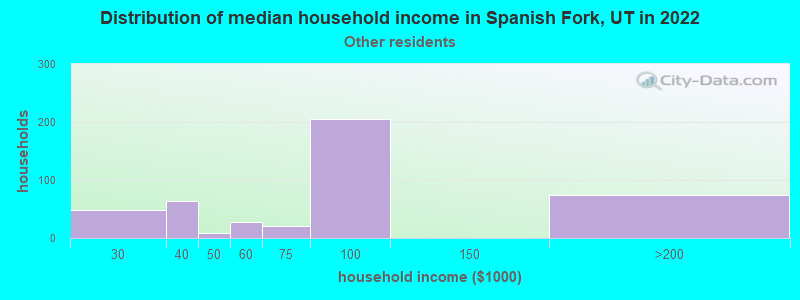
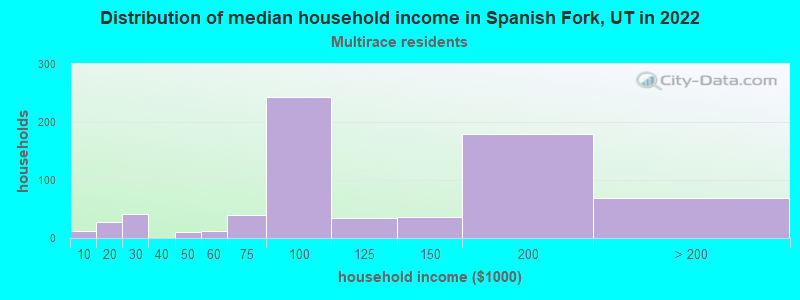
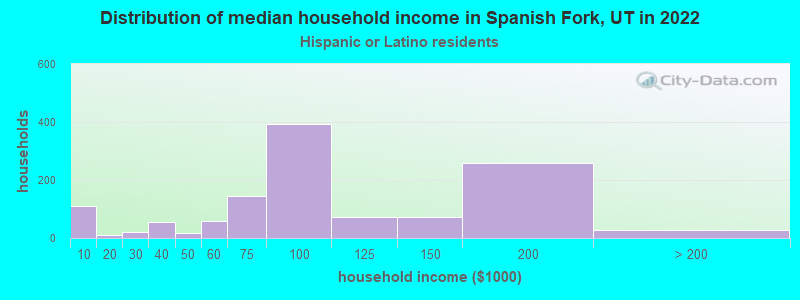
Income and house value in Spanish Fork Median household income in 2022 $101,226 White non-Hispanic householdersover $200,000 Native Hawaiian and other Pacific Islander householders$78,657 Some other race householders$85,506 Two or more races householders$88,448 Hispanic or Latino race householdersMedian 2022 house value $496,670 White Non-Hispanic householders$599,977 American Indian or Alaska Native householders$481,499 Native Hawaiian and other Pacific Islander householders$471,024 Some other race householders$684,863 Two or more races householders$535,320 Hispanic or Latino householders
Median age by race in Spanish Fork
28.8 Median age for White residents29.4 28.6 16.1 Median age for Black or African American residents15.0 12.3 23.9 Median age for American Indian / Alaska Native residents24.3 22.4 56.2 Median age for Asian residents-702,020,201.3 56.0 41.9 Median age for Native Hawaiian / Pacific Islander residents-749,999,999.2 -583,006,535.4 30.4 Median age for Other race residents29.4 31.4 18.8 Median age for Two or more races residents20.1 17.8 29.6 Median age for White alone residents29.5 29.8 21.2 Median age for Hispanic or Latino residents25.8 18.7
Owner/renter occupied households by race in Spanish Fork
House owners and renters - White residents 9,074 80.1% Owner occupied2,261 19.9% Renter occupiedHouse owners and renters - American Indian / Alaska Native residents 3 23.7% Owner occupied11 76.3% Renter occupiedHouse owners and renters - Asian residents 15 58.0% Owner occupied11 42.0% Renter occupiedHouse owners and renters - Native Hawaiian / Pacific Islander residents 171 97.2% Owner occupied5 2.8% Renter occupiedHouse owners and renters - Other race residents 353 84.8% Owner occupied63 15.2% Renter occupiedHouse owners and renters - Two or more races residents 600 79.5% Owner occupied155 20.5% Renter occupiedHouse owners and renters - White alone residents 8,824 80.2% Owner occupied2,177 19.8% Renter occupiedHouse owners and renters - Hispanic or Latino residents 916 76.0% Owner occupied289 24.0% Renter occupied
Language usage in Spanish Fork
English speakers - Total 88.3% of residents of Spanish Fork speak English at home.
10.1% of residents speak Spanish at home 2,483 60.6% Speak English very well1,617 39.4% Speak English less than very well1.5% of residents speak other language at home 533 89.6% Speak English very well62 10.4% Speak English less than very well
English speakers - Born in the United States 90.8% of residents of Spanish Fork speak English at home.
6.2% of residents speak Spanish at home 546 84.5% Speak English very well100 15.5% Speak English less than very well2.9% of residents speak other language at home 299 98.7% Speak English very well4 1.3% Speak English less than very well
English speakers - Native, born elsewhere 66.8% of residents of Spanish Fork speak English at home.
21.7% of residents speak Spanish at home 18 38.3% Speak English very well29 61.7% Speak English less than very well
English speakers - Foreign-born 27.0% of residents of Spanish Fork speak English at home.
72.2% of residents speak Spanish at home 511 33.5% Speak English very well1,013 66.5% Speak English less than very well2.4% of residents speak other language at home 5 10.0% Speak English very well45 90.0% Speak English less than very well
White (Caucasian) - Speak only English Native:
95.9% (32,804)Foreign-born:
56.8% (309)
White (Caucasian) - Speak another language Native:
4.4% (1,516)Foreign-born:
53.0% (289)
American Indian / Alaska Native - Speak only English Native:
71.9% (141)Foreign-born:
100.0% (7)
American Indian / Alaska Native - Speak another language Native:
24.3% (48)Foreign-born:
38.4% (3)
Asian - Speak only English Native:
89.3% (27)Foreign-born:
17.5% (10)
Other race - Speak only English Native:
27.5% (239)Foreign-born:
13.1% (106)
Other race - Speak another language Native:
73.1% (637)Foreign-born:
80.5% (654)
Two or more races - Speak only English Native:
65.2% (1,667)Foreign-born:
9.0% (41)
Two or more races - Speak another language Native:
36.9% (943)Foreign-born:
90.9% (413)
White alone - Speak only English Native:
96.3% (32,048)Foreign-born:
100.0% (286)
White alone - Speak another language Native:
3.8% (1,252)Foreign-born:
5.7% (16)
Hispanic or Latino - Speak only English Native:
48.7% (1,533)Foreign-born:
7.8% (130)
Hispanic or Latino - Speak another language Native:
51.2% (1,611)Foreign-born:
89.4% (1,494)
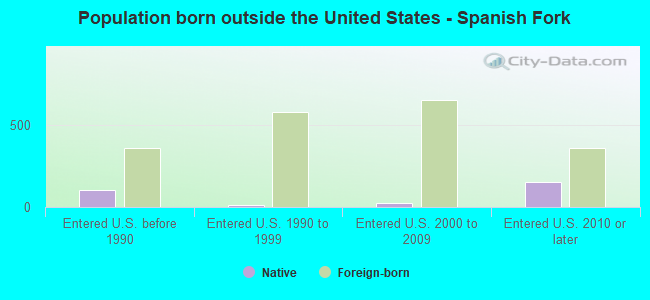
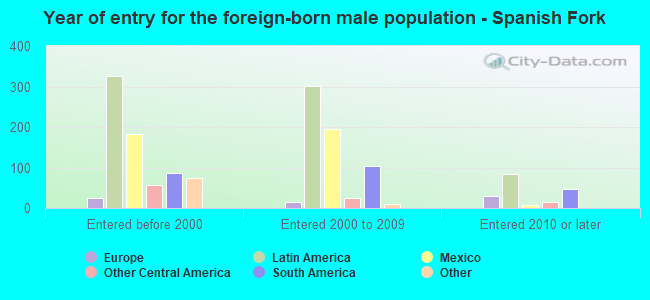
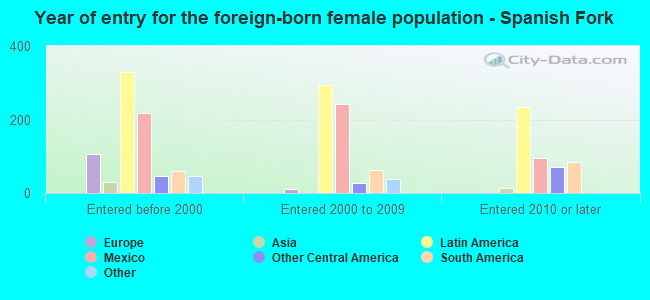
Foreign-born residents in Spanish Fork 1,965 residents are foreign born (3.5% Latin America ).
Marital status for residents in Spanish Fork Marital status - White (Caucasian) population 15 years and over
Males 29.3% Never married63.8% Now married0.7% Separated1.8% Widowed4.4% DivorcedFemales 23.1% Never married64.1% Now married1.2% Separated4.6% Widowed7.0% DivorcedWomen who gave birth in the past 12 months Now married:
89.5% (813)Unmarried:
10.5% (95)
Women who did not give birth in the past 12 months Now married:
60.9% (5,384)Unmarried:
39.1% (3,451)
Marital status - Black or African American population 15 years and over
Males 92.6% Never married1.9% Now married0.0% Separated0.0% Widowed5.6% DivorcedFemales 100.0% Never married0.0% Now married0.0% Separated0.0% Widowed0.0% DivorcedWomen who did not give birth in the past 12 months Now married:
0.0% (0)Unmarried:
100.0% (46)
Marital status - American Indian / Alaska Native population 15 years and over
Males 59.0% Never married31.4% Now married0.0% Separated0.0% Widowed9.5% DivorcedFemales 66.7% Never married33.3% Now married0.0% Separated0.0% Widowed0.0% DivorcedWomen who did not give birth in the past 12 months Now married:
26.2% (12)Unmarried:
73.8% (33)
Marital status - Asian population 15 years and over
Males 0.0% Never married100.0% Now married0.0% Separated0.0% Widowed0.0% DivorcedFemales 26.2% Never married27.7% Now married0.0% Separated18.5% Widowed27.7% DivorcedWomen who gave birth in the past 12 months Now married:
100.0% (12)Unmarried:
0.0% (0)
Women who did not give birth in the past 12 months Now married:
0.0% (0)Unmarried:
100.0% (20)
Marital status - Native Hawaiian / Pacific Islander population 15 years and over
Males 0.0% Never married100.0% Now married0.0% Separated0.0% Widowed0.0% DivorcedFemales 50.0% Never married50.0% Now married0.0% Separated0.0% Widowed0.0% DivorcedWomen who did not give birth in the past 12 months Now married:
0.0% (0)Unmarried:
100.0% (12)
Marital status - Other race population 15 years and over
Males 39.1% Never married57.6% Now married0.0% Separated0.0% Widowed3.2% DivorcedFemales 23.5% Never married69.8% Now married0.0% Separated1.3% Widowed5.4% DivorcedWomen who gave birth in the past 12 months Now married:
100.0% (158)Unmarried:
0.0% (0)
Women who did not give birth in the past 12 months Now married:
47.7% (121)Unmarried:
52.3% (132)
Marital status - Two or more races population 15 years and over
Males 42.7% Never married53.7% Now married0.0% Separated0.0% Widowed3.6% DivorcedFemales 49.5% Never married37.5% Now married3.7% Separated3.7% Widowed5.6% DivorcedWomen who gave birth in the past 12 months Now married:
59.3% (21)Unmarried:
40.7% (14)
Women who did not give birth in the past 12 months Now married:
34.5% (253)Unmarried:
65.5% (480)
Marital status - White alone, not Hispanic / Latino population 15 years and over
Males 28.8% Never married64.0% Now married0.7% Separated1.9% Widowed4.6% DivorcedFemales 22.8% Never married64.0% Now married1.1% Separated4.9% Widowed7.3% DivorcedWomen who gave birth in the past 12 months Now married:
88.8% (783)Unmarried:
11.2% (98)
Women who did not give birth in the past 12 months Now married:
60.8% (5,174)Unmarried:
39.2% (3,336)
Marital status - Hispanic or Latino population 15 years and over
Males 36.2% Never married61.0% Now married0.0% Separated0.0% Widowed2.8% DivorcedFemales 34.4% Never married57.5% Now married3.0% Separated1.7% Widowed3.4% DivorcedWomen who gave birth in the past 12 months Now married:
100.0% (166)Unmarried:
0.0% (0)
Women who did not give birth in the past 12 months Now married:
50.4% (639)Unmarried:
49.6% (629)
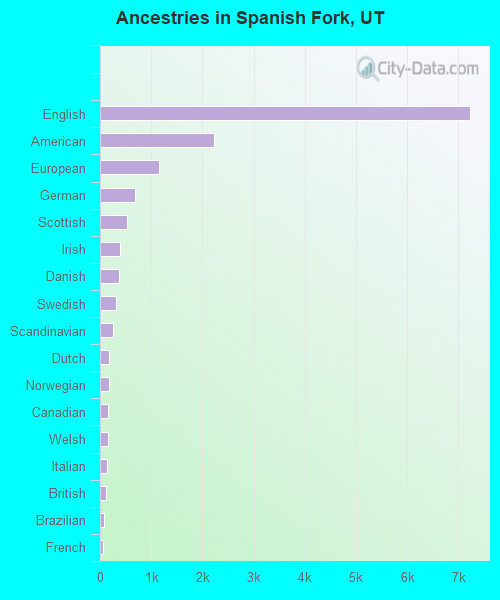
Ancestries in Spanish Fork
7,236 36.6% English2,232 11.3% American1,161 5.9% European693 3.5% German528 2.7% Scottish391 2.0% Irish363 1.8% Danish315 1.6% Swedish253 1.3% Scandinavian178 0.9% Dutch167 0.8% Norwegian158 0.8% Canadian147 0.7% Welsh142 0.7% Italian124 0.6% British76 0.4% Brazilian68 0.3% French48 0.2% Swiss33 0.2% Scotch-Irish29 0.1% Icelander28 0.1% French Canadian27 0.1% Polish26 0.1% Northern European21 0.1% Slovene18 0.09% Basque18 0.09% African16 0.08% Greek15 0.08% Russian11 0.06% Czech10 0.05% Arab10 0.05% Romanian8 0.04% Armenian7 0.04% Portuguese
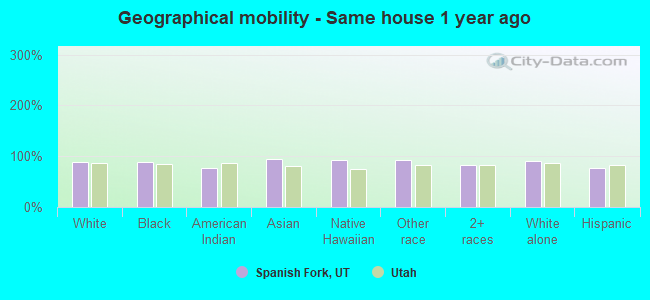
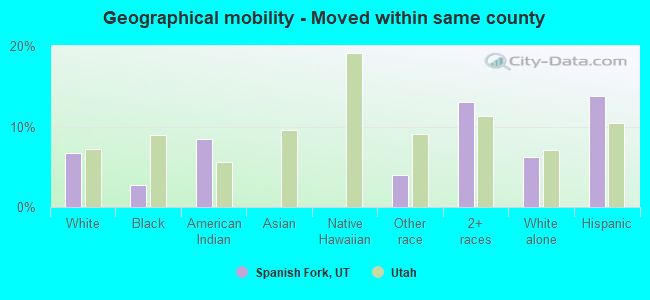
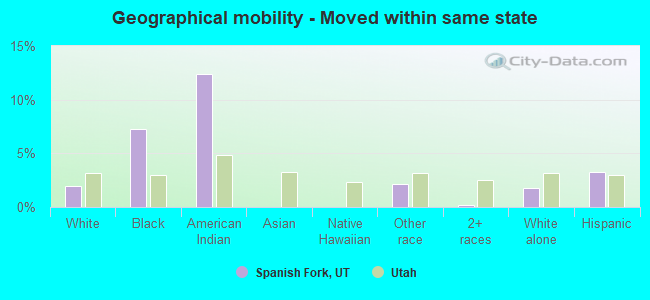
Geographical mobility in Spanish Fork Same house 1 year ago 33,405 89.1% White (Caucasian)225 89.3% Black or African American158 76.7% American Indian / Alaska Native83 94.4% Asian102 92.6% Native Hawaiian / Pacific Islander1,601 93.2% Other race3,055 82.6% Two or more races32,637 90.4% White alone, not Hispanic / Latino4,218 77.6% Hispanic or LatinoMoved within same county 2,521 6.7% White / Caucasian7 2.8% Black or African American17 8.4% American Indian / Alaska Native69 4.0% Other race481 13.0% Two or more races2,229 6.2% White alone, not Hispanic / Latino747 13.7% Hispanic or LatinoMoved within same state 743 2.0% White / Caucasian18 7.3% Black or African American26 12.4% American Indian / Alaska Native37 2.2% Other race7 0.2% Two or more races626 1.7% White alone, not Hispanic / Latino178 3.3% Hispanic or LatinoMoved from different state 754 2.0% White / Caucasian10 4.0% Black or African American7 3.3% American Indian / Alaska Native7 0.4% Other race96 2.6% Two or more races568 1.6% White alone, not Hispanic / Latino178 3.3% Hispanic or LatinoMoved from abroad 180 0.5% White79 2.1% Two or more races159 0.4% White alone, not Hispanic / Latino64 1.2% Hispanic or Latino
Children Nativity (place of birth) in Spanish Fork
Children under 6 years - Living with two parents Both parents native 3,793 100.0% NativeBoth parents foreign-born 93 100.0% NativeOne native, one foreign-born parent 702 100.0% NativeChildren under 6 years - Living with one parent Native parent 504 100.0% NativeForeign-born parent 21 100.0% NativeChildren 6 to 17 years - Living with two parents Both parents native 7,605 100.0% Native2 0.0% Foreign-bornBoth parents foreign-born 493 94.9% Native26 5.1% Foreign-bornOne native, one foreign-born parent 380 100.0% NativeChildren 6 to 17 years - Living with one parent Native parent 1,104 99.8% Native2 0.2% Foreign-bornForeign-born parent 112 67.7% Native53 32.3% Foreign-born
Grandparents responsible for own grandchildren in Spanish Fork
Grandparents (30 to 59 years) White / Caucasian 66 10.1% Responsible for grandchildren588 89.9% Not responsible for grandchildrenAmerican Indian / Alaska Native 4 100.0% Responsible for grandchildrenTwo or more races 8 100.0% Not responsible for grandchildrenWhite alone, not Hispanic / Latino 71 10.4% Responsible for grandchildren616 89.6% Not responsible for grandchildrenHispanic or Latino 40 100.0% Not responsible for grandchildrenGrandparents (60 years and over) White / Caucasian 77 24.0% Responsible for grandchildren244 76.0% Not responsible for grandchildrenTwo or more races 68 100.0% Not responsible for grandchildrenWhite alone, not Hispanic / Latino 79 26.7% Responsible for grandchildren216 73.3% Not responsible for grandchildrenHispanic or Latino 110 100.0% Not responsible for grandchildren