Races in Southwest Bell, Texas (TX) Detailed Stats
Ancestries, Foreign-born residents, place of birth
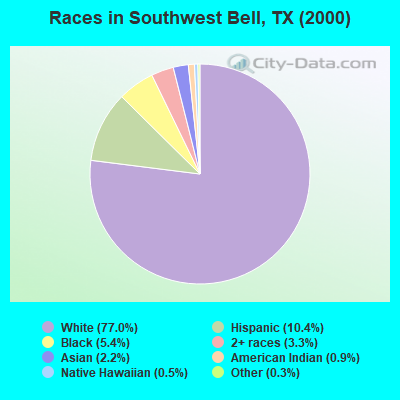
Race distribution in Southwest Bell

- 4,00377.0%White alone
- 54210.4%Hispanic
- 2825.4%Black alone
- 1713.3%Two or more races
- 1152.2%Asian alone
- 470.9%American Indian alone
- 240.5%Native Hawaiian and Other
Pacific Islander alone - 170.3%Other race alone
2000
2022
-
- 10,933,31352.4%White alone
- 6,669,66632.0%Hispanic
- 2,364,25511.3%Black alone
- 554,4452.7%Asian alone
- 230,5671.1%Two or more races
- 68,8590.3%American Indian alone
- 19,9580.10%Other race alone
- 10,7570.05%Native Hawaiian and Other
Pacific Islander alone

-
- 12,070,64240.2%Hispanic
- 11,683,43038.9%White alone
- 3,508,70611.7%Black alone
- 1,608,1735.4%Asian alone
- 956,5603.2%Two or more races
- 125,7630.4%Other race alone
- 47,0230.2%American Indian alone
- 29,2750.10%Native Hawaiian and Other
Pacific Islander alone

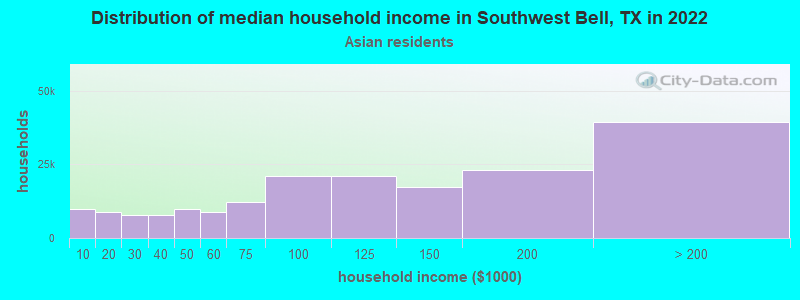
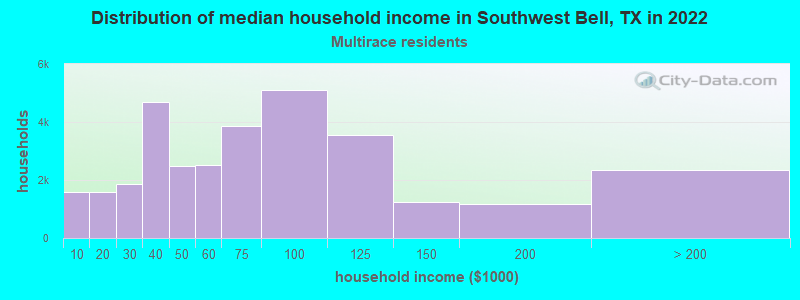
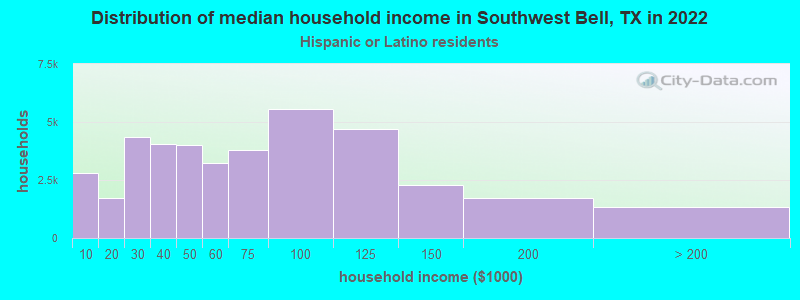
Income and house value in Southwest Bell
- Median household income in 2022
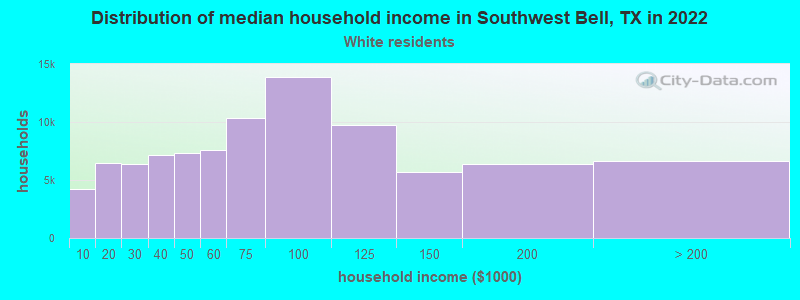
- $87,311White non-Hispanic householders
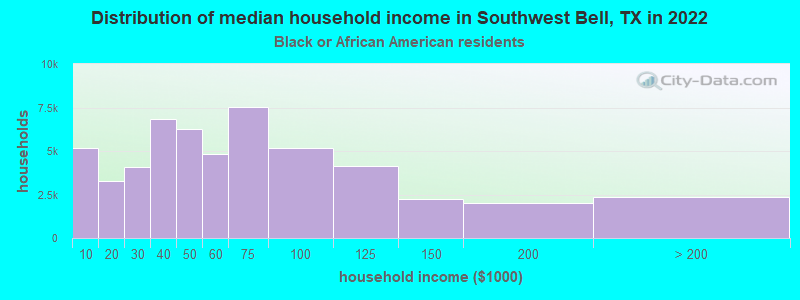
- $80,399Black householders
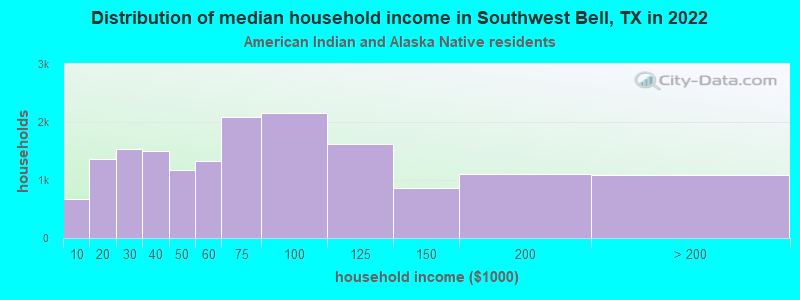
- $20,227American Indian and Alaska Native householders
- $66,397Asian householders
- $66,059Some other race householders
- $144,607Two or more races householders
- $70,169Hispanic or Latino race householders
- Median 2022 house value
- $305,892White Non-Hispanic householders
- $302,185Black or African American householders
- $502,097Asian householders
- $282,410Some other race householders
- $370,779Two or more races householders
- $277,157Hispanic or Latino householders
Household income for White non-Hispanic householders
Household income for Black householders
Household income for American Indian and Alaska Native householders
Household income for Asian householders
Household income for Two or more races householders
Household income for Hispanic or Latino race householders
Zip code: 76542