Races in Southfield, Michigan (MI) Detailed Stats
Data:
Races - White alone (%)
Races - White alone (% change since 2000)
Races - Black alone (%)
Races - Black alone (% change since 2000)
Races - American Indian alone (%)
Races - American Indian alone (% change since 2000)
Races - Asian alone (%)
Races - Asian alone (% change since 2000)
Races - Hispanic (%)
Races - Hispanic (% change since 2000)
Races - Native Hawaiian and Other Pacific Islander alone (%)
Races - Native Hawaiian and Other Pacific Islander alone (% change since 2000)
Races - Two or more races(%)
Races - Two or more races(% change since 2000)
Races - Other race alone (%)
Races - Other race alone (% change since 2000)
Racial diversity
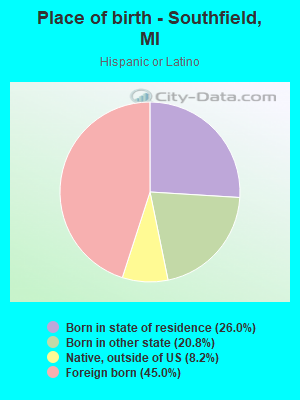
Place of birth - Born in state of residence (%)
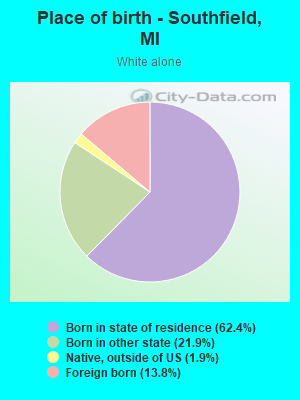
Place of birth - Born in state of residence (%) - White
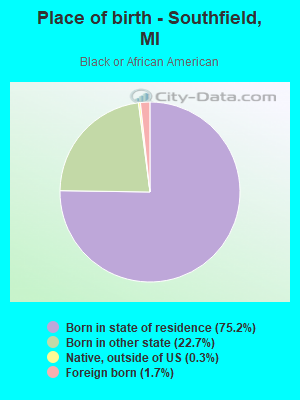
Place of birth - Born in state of residence (%) - Black or African American
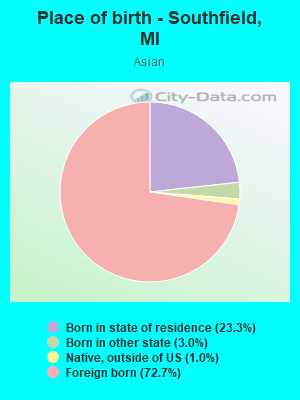
Place of birth - Born in state of residence (%) - Asian
Place of birth - Born in state of residence (%) - Hispanic or Latino
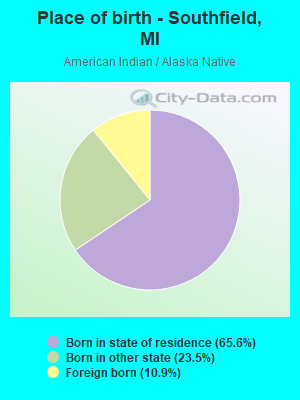
Place of birth - Born in state of residence (%) - American Indian and Alaska Native
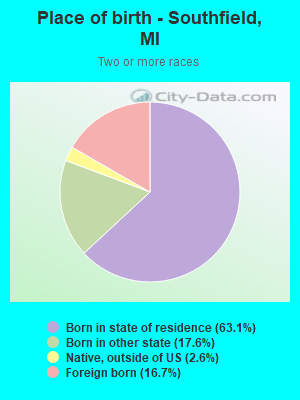
Place of birth - Born in state of residence (%) - Multirace
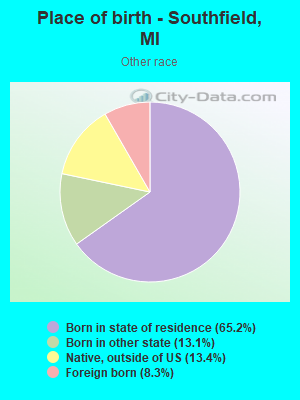
Place of birth - Born in state of residence (%) - Other Race
Place of birth - Born in other state (%)
Place of birth - Born in other state (%) - White
Place of birth - Born in other state (%) - Black or African American
Place of birth - Born in other state (%) - Asian
Place of birth - Born in other state (%) - Hispanic or Latino
Place of birth - Born in other state (%) - American Indian and Alaska Native
Place of birth - Born in other state (%) - Multirace
Place of birth - Born in other state (%) - Other Race
Place of birth - Native, outside of US (%)
Place of birth - Native, outside of US (%) - White
Place of birth - Native, outside of US (%) - Black or African American
Place of birth - Native, outside of US (%) - Asian
Place of birth - Native, outside of US (%) - Hispanic or Latino
Place of birth - Native, outside of US (%) - American Indian and Alaska Native
Place of birth - Native, outside of US (%) - Multirace
Place of birth - Native, outside of US (%) - Other Race
Place of birth - Foreign born (%)
Place of birth - Foreign born (%) - White
Place of birth - Foreign born (%) - Black or African American
Place of birth - Foreign born (%) - Asian
Place of birth - Foreign born (%) - Hispanic or Latino
Place of birth - Foreign born (%) - American Indian and Alaska Native
Place of birth - Foreign born (%) - Multirace
Place of birth - Foreign born (%) - Other Race
Residents speaking English at home (%)
Residents speaking English at home - Born in the United States (%)
Residents speaking English at home - Native, born elsewhere (%)
Residents speaking English at home - Foreign born (%)
Residents speaking Spanish at home (%)
Residents speaking Spanish at home - Born in the United States (%)
Residents speaking Spanish at home - Native, born elsewhere (%)
Residents speaking Spanish at home - Foreign born (%)
Residents speaking other language at home (%)
Residents speaking other language at home - Born in the United States (%)
Residents speaking other language at home - Native, born elsewhere (%)
Residents speaking other language at home - Foreign born (%)
Marital status - Never married (%)
Marital status - Now married (%)
Marital status - Separated (%)
Marital status - Widowed (%)
Marital status - Divorced (%)
Ancestries Reported - Arab (%)
Ancestries Reported - Czech (%)
Ancestries Reported - Danish (%)
Ancestries Reported - Dutch (%)
Ancestries Reported - English (%)
Ancestries Reported - French (%)
Ancestries Reported - French Canadian (%)
Ancestries Reported - German (%)
Ancestries Reported - Greek (%)
Ancestries Reported - Hungarian (%)
Ancestries Reported - Irish (%)
Ancestries Reported - Italian (%)
Ancestries Reported - Lithuanian (%)
Ancestries Reported - Norwegian (%)
Ancestries Reported - Polish (%)
Ancestries Reported - Portuguese (%)
Ancestries Reported - Russian (%)
Ancestries Reported - Scotch-Irish (%)
Ancestries Reported - Scottish (%)
Ancestries Reported - Slovak (%)
Ancestries Reported - Subsaharan African (%)
Ancestries Reported - Swedish (%)
Ancestries Reported - Swiss (%)
Ancestries Reported - Ukrainian (%)
Ancestries Reported - United States (%)
Ancestries Reported - Welsh (%)
Ancestries Reported - West Indian (%)
Ancestries Reported - Other (%)
Geographical mobility - Same house 1 year ago (%)
Geographical mobility - Same house 1 year ago (%) - White
Geographical mobility - Same house 1 year ago (%) - Black or African American
Geographical mobility - Same house 1 year ago (%) - Asian
Geographical mobility - Same house 1 year ago (%) - Hispanic or Latino
Geographical mobility - Same house 1 year ago (%) - American Indian and Alaska Native
Geographical mobility - Same house 1 year ago (%) - Multirace
Geographical mobility - Same house 1 year ago (%) - Other Race
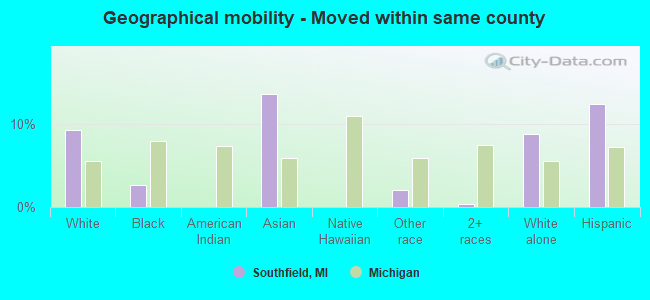
Geographical mobility - Moved within same county (%)
Geographical mobility - Moved within same county (%) - White
Geographical mobility - Moved within same county (%) - Black or African American
Geographical mobility - Moved within same county (%) - Asian
Geographical mobility - Moved within same county (%) - Hispanic or Latino
Geographical mobility - Moved within same county (%) - American Indian and Alaska Native
Geographical mobility - Moved within same county (%) - Multirace
Geographical mobility - Moved within same county (%) - Other Race
Geographical mobility - Moved from different county within same state (%)
Geographical mobility - Moved from different county within same state (%) - White
Geographical mobility - Moved from different county within same state (%) - Black or African American
Geographical mobility - Moved from different county within same state (%) - Asian
Geographical mobility - Moved from different county within same state (%) - Hispanic or Latino
Geographical mobility - Moved from different county within same state (%) - American Indian and Alaska Native
Geographical mobility - Moved from different county within same state (%) - Multirace
Geographical mobility - Moved from different county within same state (%) - Other Race
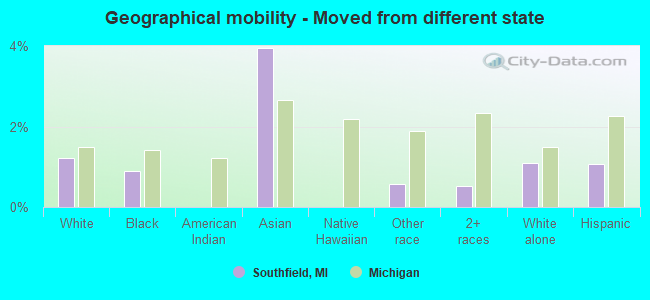
Geographical mobility - Moved from different state (%)
Geographical mobility - Moved from different state (%) - White
Geographical mobility - Moved from different state (%) - Black or African American
Geographical mobility - Moved from different state (%) - Asian
Geographical mobility - Moved from different state (%) - Hispanic or Latino
Geographical mobility - Moved from different state (%) - American Indian and Alaska Native
Geographical mobility - Moved from different state (%) - Multirace
Geographical mobility - Moved from different state (%) - Other Race
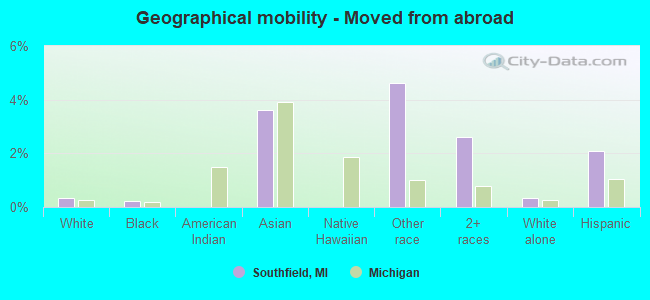
Geographical mobility - Moved from abroad (%)
Geographical mobility - Moved from abroad (%) - White
Geographical mobility - Moved from abroad (%) - Black or African American
Geographical mobility - Moved from abroad (%) - Asian
Geographical mobility - Moved from abroad (%) - Hispanic or Latino
Geographical mobility - Moved from abroad (%) - American Indian and Alaska Native
Geographical mobility - Moved from abroad (%) - Multirace
Geographical mobility - Moved from abroad (%) - Other Race
Place of birth for the foreign-born population - Ireland (%)
Place of birth for the foreign-born population - Denmark (%)
Place of birth for the foreign-born population - Norway (%)
Place of birth for the foreign-born population - Sweden (%)
Place of birth for the foreign-born population - United Kingdom (%)
Place of birth for the foreign-born population - England (%)
Place of birth for the foreign-born population - Scotland (%)
Place of birth for the foreign-born population - Other Northern Europe (%)
Place of birth for the foreign-born population - Austria (%)
Place of birth for the foreign-born population - Belgium (%)
Place of birth for the foreign-born population - France (%)
Place of birth for the foreign-born population - Germany (%)
Place of birth for the foreign-born population - Netherlands (%)
Place of birth for the foreign-born population - Switzerland (%)
Place of birth for the foreign-born population - Other Western Europe (%)
Place of birth for the foreign-born population - Greece (%)
Place of birth for the foreign-born population - Italy (%)
Place of birth for the foreign-born population - Portugal (%)
Place of birth for the foreign-born population - Spain (%)
Place of birth for the foreign-born population - Other Southern Europe (%)
Place of birth for the foreign-born population - Albania (%)
Place of birth for the foreign-born population - Belarus (%)
Place of birth for the foreign-born population - Bosnia and Herzegovina (%)
Place of birth for the foreign-born population - Bulgaria (%)
Place of birth for the foreign-born population - Croatia (%)
Place of birth for the foreign-born population - Czechoslovakia (%)
Place of birth for the foreign-born population - Hungary (%)
Place of birth for the foreign-born population - Latvia (%)
Place of birth for the foreign-born population - Lithuania (%)
Place of birth for the foreign-born population - North Macedonia (Macedonia) (%)
Place of birth for the foreign-born population - Moldova (%)
Place of birth for the foreign-born population - Poland (%)
Place of birth for the foreign-born population - Romania (%)
Place of birth for the foreign-born population - Russia (%)
Place of birth for the foreign-born population - Serbia (%)
Place of birth for the foreign-born population - Ukraine (%)
Place of birth for the foreign-born population - Other Eastern Europe (%)
Place of birth for the foreign-born population - China (%)
Place of birth for the foreign-born population - Hong Kong (%)
Place of birth for the foreign-born population - Taiwan (%)
Place of birth for the foreign-born population - Japan (%)
Place of birth for the foreign-born population - Korea (%)
Place of birth for the foreign-born population - Other Eastern Asia (%)
Place of birth for the foreign-born population - Afghanistan (%)
Place of birth for the foreign-born population - Bangladesh (%)
Place of birth for the foreign-born population - India (%)
Place of birth for the foreign-born population - Iran (%)
Place of birth for the foreign-born population - Kazakhstan (%)
Place of birth for the foreign-born population - Nepal (%)
Place of birth for the foreign-born population - Pakistan (%)
Place of birth for the foreign-born population - Sri Lanka (%)
Place of birth for the foreign-born population - Uzbekistan (%)
Place of birth for the foreign-born population - Other South Central Asia (%)
Place of birth for the foreign-born population - Burma (%)
Place of birth for the foreign-born population - Cambodia (%)
Place of birth for the foreign-born population - Indonesia (%)
Place of birth for the foreign-born population - Laos (%)
Place of birth for the foreign-born population - Malaysia (%)
Place of birth for the foreign-born population - Philippines (%)
Place of birth for the foreign-born population - Singapore (%)
Place of birth for the foreign-born population - Thailand (%)
Place of birth for the foreign-born population - Vietnam (%)
Place of birth for the foreign-born population - Other South Eastern Asia (%)
Place of birth for the foreign-born population - Armenia (%)
Place of birth for the foreign-born population - Iraq (%)
Place of birth for the foreign-born population - Israel (%)
Place of birth for the foreign-born population - Jordan (%)
Place of birth for the foreign-born population - Kuwait (%)
Place of birth for the foreign-born population - Lebanon (%)
Place of birth for the foreign-born population - Saudi Arabia (%)
Place of birth for the foreign-born population - Syria (%)
Place of birth for the foreign-born population - Turkey (%)
Place of birth for the foreign-born population - Yemen (%)
Place of birth for the foreign-born population - Other Western Asia (%)
Place of birth for the foreign-born population - Eritrea (%)
Place of birth for the foreign-born population - Ethiopia (%)
Place of birth for the foreign-born population - Kenya (%)
Place of birth for the foreign-born population - Somalia (%)
Place of birth for the foreign-born population - Uganda (%)
Place of birth for the foreign-born population - Zimbabwe (%)
Place of birth for the foreign-born population - Other Eastern Africa (%)
Place of birth for the foreign-born population - Cameroon (%)
Place of birth for the foreign-born population - Congo (%)
Place of birth for the foreign-born population - Democratic Republic of Congo (Zaire) (%)
Place of birth for the foreign-born population - Other Middle Africa (%)
Place of birth for the foreign-born population - Egypt (%)
Place of birth for the foreign-born population - Morocco (%)
Place of birth for the foreign-born population - Sudan (%)
Place of birth for the foreign-born population - Other Northern Africa (%)
Place of birth for the foreign-born population - South Africa (%)
Place of birth for the foreign-born population - Other Southern Africa (%)
Place of birth for the foreign-born population - Cabo Verde (%)
Place of birth for the foreign-born population - Ghana (%)
Place of birth for the foreign-born population - Liberia (%)
Place of birth for the foreign-born population - Nigeria (%)
Place of birth for the foreign-born population - Senegal (%)
Place of birth for the foreign-born population - Sierra Leone (%)
Place of birth for the foreign-born population - Other Western Africa (%)
Place of birth for the foreign-born population - Australia (%)
Place of birth for the foreign-born population - New Zealand (%)
Place of birth for the foreign-born population - Fiji (%)
Place of birth for the foreign-born population - Micronesia (%)
Place of birth for the foreign-born population - Bahamas (%)
Place of birth for the foreign-born population - Barbados (%)
Place of birth for the foreign-born population - Cuba (%)
Place of birth for the foreign-born population - Dominica (%)
Place of birth for the foreign-born population - Dominican Republic (%)
Place of birth for the foreign-born population - Grenada (%)
Place of birth for the foreign-born population - Haiti (%)
Place of birth for the foreign-born population - Jamaica (%)
Place of birth for the foreign-born population - St. Vincent and the Grenadines (%)
Place of birth for the foreign-born population - Trinidad and Tobago (%)
Place of birth for the foreign-born population - West Indies (%)
Place of birth for the foreign-born population - Other Caribbean (%)
Place of birth for the foreign-born population - Belize (%)
Place of birth for the foreign-born population - Costa Rica (%)
Place of birth for the foreign-born population - El Salvador (%)
Place of birth for the foreign-born population - Guatemala (%)
Place of birth for the foreign-born population - Honduras (%)
Place of birth for the foreign-born population - Mexico (%)
Place of birth for the foreign-born population - Nicaragua (%)
Place of birth for the foreign-born population - Panama (%)
Place of birth for the foreign-born population - Other Central America (%)
Place of birth for the foreign-born population - Argentina (%)
Place of birth for the foreign-born population - Bolivia (%)
Place of birth for the foreign-born population - Brazil (%)
Place of birth for the foreign-born population - Chile (%)
Place of birth for the foreign-born population - Colombia (%)
Place of birth for the foreign-born population - Ecuador (%)
Place of birth for the foreign-born population - Guyana (%)
Place of birth for the foreign-born population - Peru (%)
Place of birth for the foreign-born population - Uruguay (%)
Place of birth for the foreign-born population - Venezuela (%)
Place of birth for the foreign-born population - Other South America (%)
Place of birth for the foreign-born population - Canada (%)
Place of birth for the foreign-born population - Other Northern America (%)
Place of birth for the foreign-born population - Other (%)
Latest news about races in Southfield, MI collected exclusively by city-data.com from local newspapers, TV, and radio stations
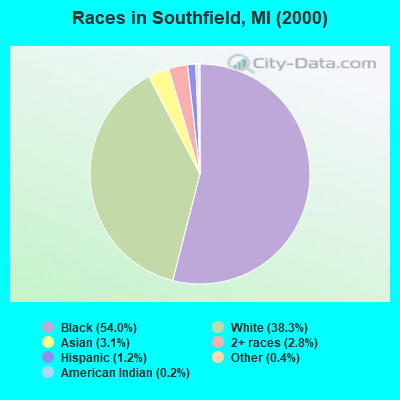
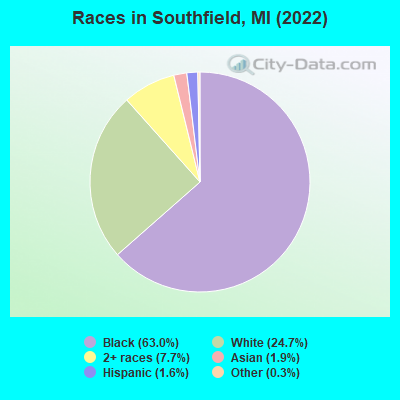
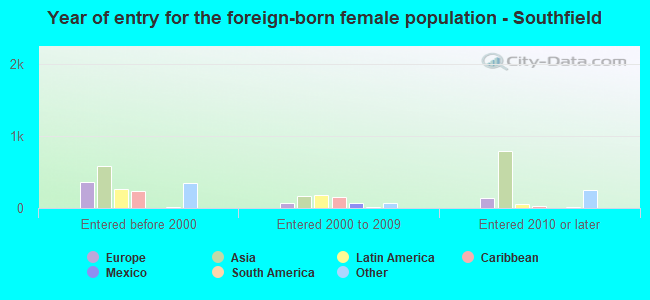
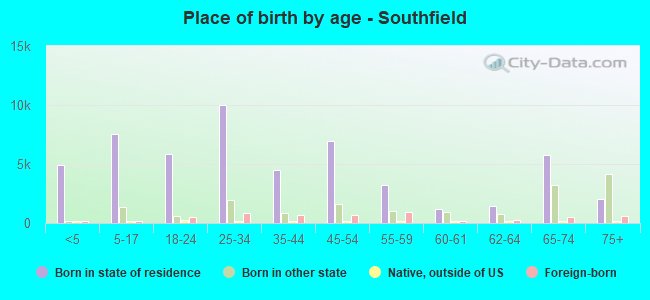
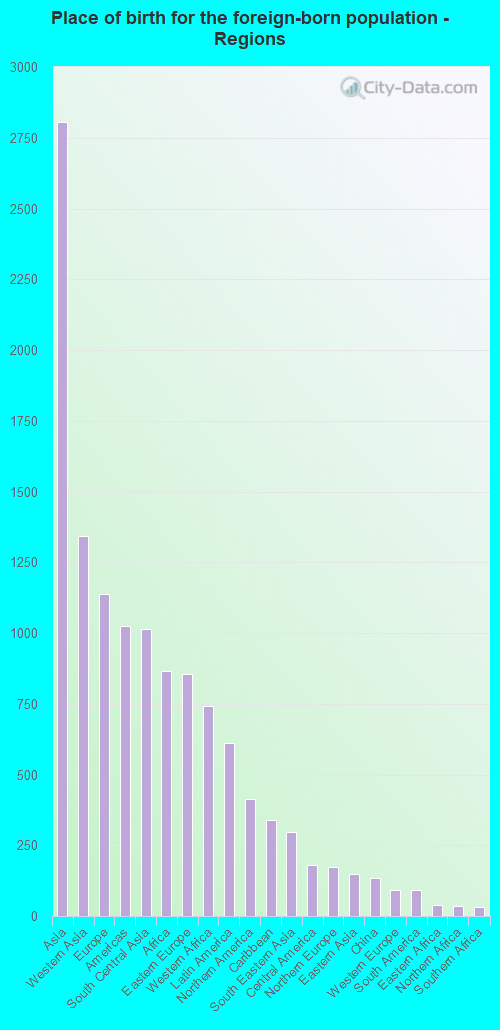
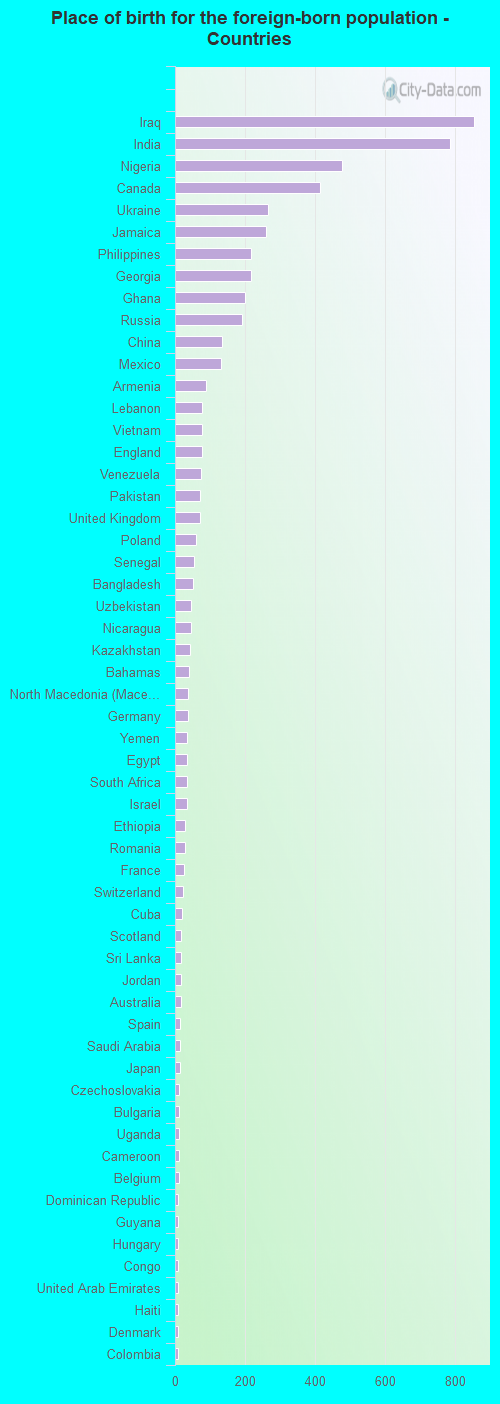
According to 2022 data, the most numerous races in Southfield, MI are White alone (18,731 residents), Black alone (47,845 residents), and Hispanic (1,234 residents). 89.9% of Southfield residents speak English at home. 7.7% of Southfield, MI residents are foreign-born (3.7% born in Asia, 1.5% born in Europe, 1.1% born in Africa, 0.8% born in Latin America), which is 22.2% greater than the foreign-born rate of 6.0% across the entire state of Michigan.
Race distribution in Southfield
2000 2022
7,806,691 78.6% White alone 1,402,047 14.1% Black alone 323,877 3.3% Hispanic 175,311 1.8% Asian alone 163,487 1.6% Two or more races 53,421 0.5% American Indian alone 11,465 0.1% Other race alone 2,145 0.02% Native Hawaiian and Other
7,289,051 72.6% White alone 1,310,464 13.1% Black alone 572,405 5.7% Hispanic 450,031 4.5% Two or more races 335,732 3.3% Asian alone 45,217 0.5% Other race alone 29,011 0.3% American Indian alone 2,207 0.02% Native Hawaiian and Other
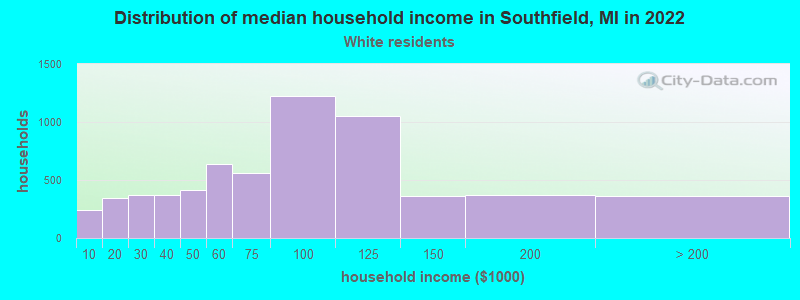
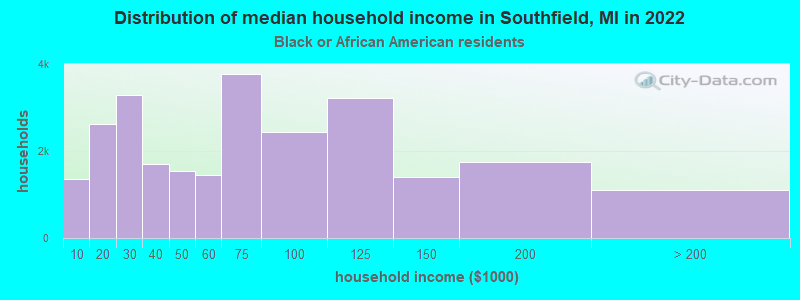
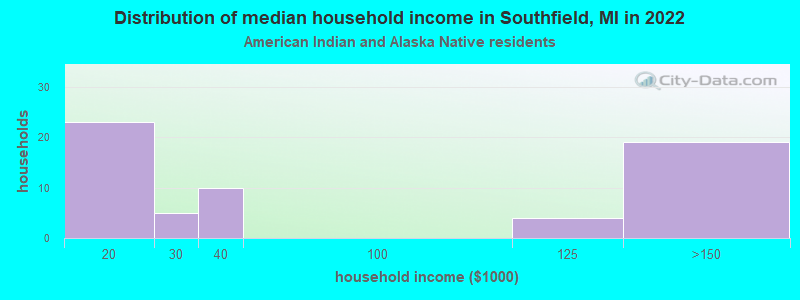
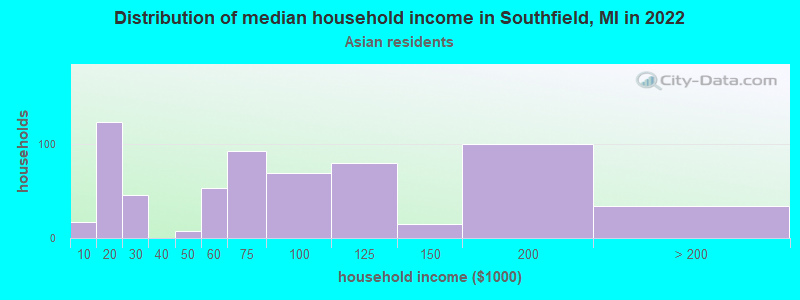
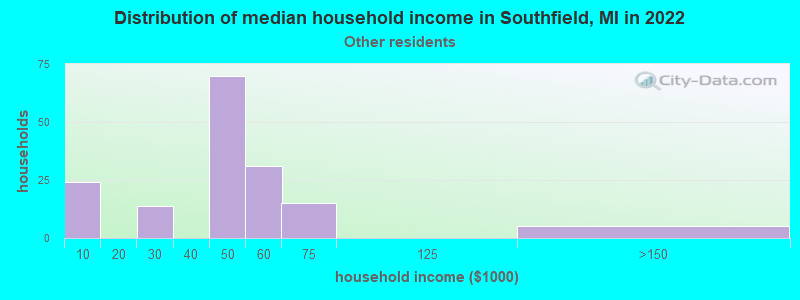
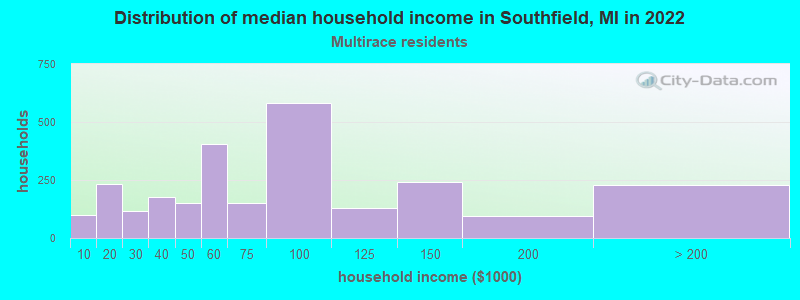
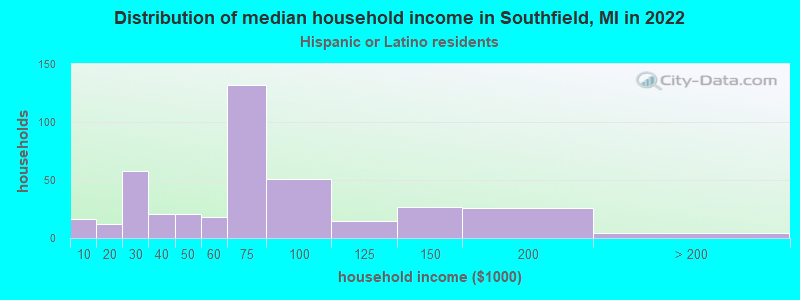
Income and house value in Southfield Median household income in 2022 $78,750 White non-Hispanic householders$64,253 Black householders$84,124 Asian householders$75,804 Two or more races householders$62,436 Hispanic or Latino race householdersMedian 2022 house value $230,929 White Non-Hispanic householders$267,579 Black or African American householders$169,466 American Indian or Alaska Native householders $264,660 Asian householders$267,579 Some other race householders$259,470 Two or more races householders$247,146 Hispanic or Latino householders
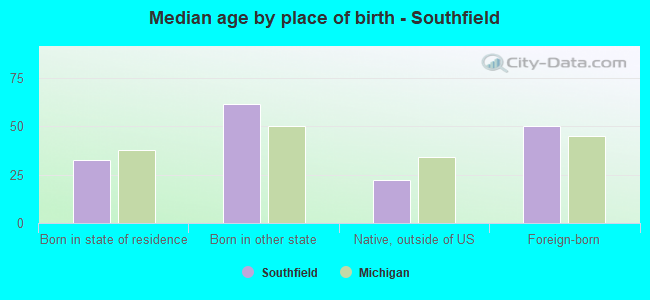
Median age by race in Southfield
37.2 Median age for White residents34.4 38.6 44.4 Median age for Black or African American residents39.1 47.4 -666,666,666.0 Median age for American Indian / Alaska Native residents-666,666,666.0 -666,666,666.0 30.6 Median age for Asian residents30.2 55.9 -666,666,666.0 Median age for Native Hawaiian / Pacific Islander residents-666,666,666.0 -666,666,666.0 35.2 Median age for Other race residents41.4 32.7 38.1 Median age for Two or more races residents28.7 44.9 37.4 Median age for White alone residents34.6 38.4 23.9 Median age for Hispanic or Latino residents22.2 44.3
Owner/renter occupied households by race in Southfield
House owners and renters - White residents 4,540 71.8% Owner occupied1,780 28.2% Renter occupiedHouse owners and renters - Black or African American residents 12,842 50.2% Owner occupied12,733 49.8% Renter occupiedHouse owners and renters - American Indian / Alaska Native residents 8 12.6% Owner occupied58 87.4% Renter occupiedHouse owners and renters - Asian residents 369 35.2% Owner occupied680 64.8% Renter occupiedHouse owners and renters - Other race residents 54 39.5% Owner occupied82 60.5% Renter occupiedHouse owners and renters - Two or more races residents 1,384 59.5% Owner occupied941 40.5% Renter occupiedHouse owners and renters - White alone residents 4,540 73.1% Owner occupied1,674 26.9% Renter occupiedHouse owners and renters - Hispanic or Latino residents 220 37.3% Owner occupied370 62.7% Renter occupied
Language usage in Southfield
English speakers - Total 89.9% of residents of Southfield speak English at home.
1.4% of residents speak Spanish at home 609 60.7% Speak English very well394 39.3% Speak English less than very well8.5% of residents speak other language at home 4,289 70.3% Speak English very well1,816 29.7% Speak English less than very well
English speakers - Born in the United States 95.4% of residents of Southfield speak English at home.
1.9% of residents speak Spanish at home 251 87.8% Speak English very well35 12.2% Speak English less than very well2.5% of residents speak other language at home 343 94.5% Speak English very well20 5.5% Speak English less than very well
English speakers - Native, born elsewhere 81.1% of residents of Southfield speak English at home.
3.3% of residents speak Spanish at home 5 22.7% Speak English very well17 77.3% Speak English less than very well23.1% of residents speak other language at home 124 80.5% Speak English very well30 19.5% Speak English less than very well
English speakers - Foreign-born 24.2% of residents of Southfield speak English at home.
5.2% of residents speak Spanish at home 101 32.7% Speak English very well208 67.3% Speak English less than very well68.7% of residents speak other language at home 2,376 58.7% Speak English very well1,673 41.3% Speak English less than very well
White (Caucasian) - Speak only English Native:
88.6% (11,215)Foreign-born:
21.2% (499)
White (Caucasian) - Speak another language Native:
11.4% (1,437)Foreign-born:
78.8% (1,853)
Black or African American - Speak only English Native:
98.9% (43,657)Foreign-born:
31.4% (520)
Black or African American - Speak another language Native:
1.1% (504)Foreign-born:
64.8% (1,075)
Asian - Speak only English Native:
68.9% (263)Foreign-born:
18.6% (193)
Asian - Speak another language Native:
32.1% (123)Foreign-born:
81.7% (848)
Other race - Speak only English Native:
57.4% (264)Foreign-born:
13.9% (6)
Other race - Speak another language Native:
42.5% (196)Foreign-born:
73.4% (30)
Two or more races - Speak only English Native:
87.3% (3,814)Foreign-born:
22.4% (196)
Two or more races - Speak another language Native:
12.7% (556)Foreign-born:
77.6% (680)
White alone - Speak only English Native:
88.5% (11,061)Foreign-born:
22.2% (499)
White alone - Speak another language Native:
11.5% (1,437)Foreign-born:
77.8% (1,747)
Hispanic or Latino - Speak only English Native:
60.1% (444)Foreign-born:
16.6% (64)
Hispanic or Latino - Speak another language Native:
40.2% (297)Foreign-born:
79.2% (308)
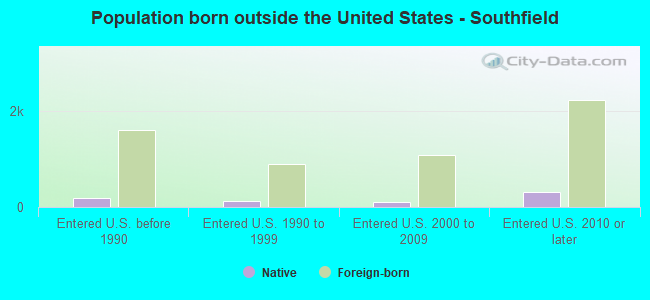
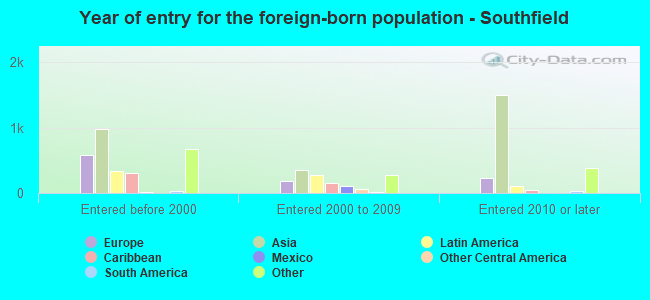
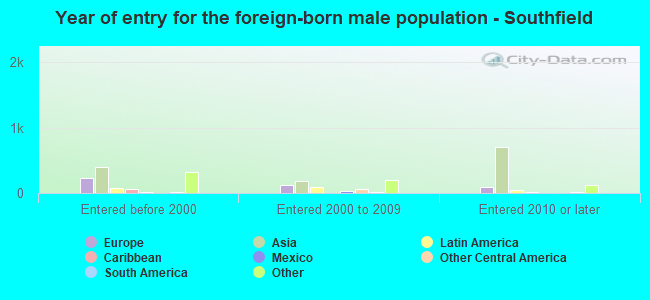
Foreign-born residents in Southfield 5,854 residents are foreign born (3.7% Asia , 1.5% Europe , 1.1% Africa , 0.8% Latin America ).
This city:
7.7%Michigan:
6.9%
Marital status for residents in Southfield Marital status - White (Caucasian) population 15 years and over
Males 42.9% Never married47.8% Now married0.0% Separated3.2% Widowed6.0% DivorcedFemales 25.5% Never married52.3% Now married0.0% Separated10.3% Widowed12.0% DivorcedWomen who gave birth in the past 12 months Now married:
100.0% (227)Unmarried:
0.0% (0)
Women who did not give birth in the past 12 months Now married:
52.6% (1,628)Unmarried:
47.4% (1,466)
Marital status - Black or African American population 15 years and over
Males 48.4% Never married39.2% Now married0.6% Separated3.0% Widowed8.8% DivorcedFemales 41.4% Never married26.6% Now married1.4% Separated14.0% Widowed16.6% DivorcedWomen who gave birth in the past 12 months Now married:
21.9% (101)Unmarried:
78.1% (361)
Women who did not give birth in the past 12 months Now married:
23.4% (2,518)Unmarried:
76.6% (8,234)
Marital status - American Indian / Alaska Native population 15 years and over
Males 23.2% Never married10.7% Now married0.0% Separated42.9% Widowed23.2% DivorcedFemales 0.0% Never married100.0% Now married0.0% Separated0.0% Widowed0.0% DivorcedWomen who did not give birth in the past 12 months Now married:
100.0% (5)Unmarried:
0.0% (0)
Marital status - Asian population 15 years and over
Males 60.4% Never married32.5% Now married0.0% Separated3.6% Widowed3.6% DivorcedFemales 32.2% Never married53.9% Now married2.4% Separated8.7% Widowed2.9% DivorcedWomen who did not give birth in the past 12 months Now married:
36.4% (111)Unmarried:
63.6% (194)
Marital status - Other race population 15 years and over
Males 73.6% Never married26.4% Now married0.0% Separated0.0% Widowed0.0% DivorcedFemales 36.1% Never married33.3% Now married4.2% Separated13.2% Widowed13.2% DivorcedWomen who did not give birth in the past 12 months Now married:
27.2% (37)Unmarried:
72.8% (98)
Marital status - Two or more races population 15 years and over
Males 60.8% Never married30.7% Now married1.5% Separated1.5% Widowed5.5% DivorcedFemales 44.6% Never married24.9% Now married5.3% Separated2.0% Widowed23.1% DivorcedWomen who gave birth in the past 12 months Now married:
0.0% (0)Unmarried:
100.0% (104)
Women who did not give birth in the past 12 months Now married:
37.1% (683)Unmarried:
62.9% (1,156)
Marital status - White alone, not Hispanic / Latino population 15 years and over
Males 42.0% Never married48.7% Now married0.0% Separated3.2% Widowed6.1% DivorcedFemales 25.4% Never married51.8% Now married0.0% Separated10.5% Widowed12.3% DivorcedWomen who gave birth in the past 12 months Now married:
100.0% (227)Unmarried:
0.0% (0)
Women who did not give birth in the past 12 months Now married:
53.4% (1,628)Unmarried:
46.6% (1,423)
Marital status - Hispanic or Latino population 15 years and over
Males 55.9% Never married30.6% Now married6.2% Separated0.0% Widowed7.3% DivorcedFemales 35.6% Never married43.9% Now married1.4% Separated3.4% Widowed15.6% DivorcedWomen who gave birth in the past 12 months Now married:
0.0% (0)Unmarried:
100.0% (30)
Women who did not give birth in the past 12 months Now married:
41.2% (106)Unmarried:
58.8% (152)
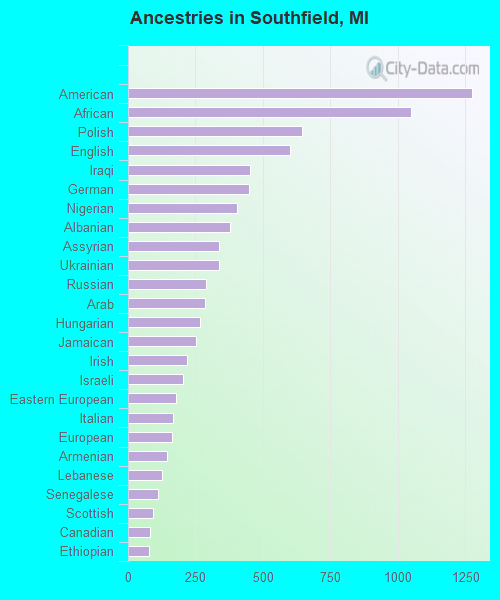
Ancestries in Southfield
1,274 2.7% American1,048 2.2% African644 1.4% Polish601 1.3% English452 1.0% Iraqi449 1.0% German405 0.9% Nigerian379 0.8% Albanian336 0.7% Assyrian336 0.7% Ukrainian289 0.6% Russian287 0.6% Arab268 0.6% Hungarian251 0.5% Jamaican220 0.5% Irish204 0.4% Israeli178 0.4% Eastern European168 0.4% Italian163 0.3% European145 0.3% Armenian127 0.3% Lebanese110 0.2% Senegalese94 0.2% Scottish83 0.2% Canadian78 0.2% Ethiopian63 0.1% Dutch60 0.1% Estonian59 0.1% Danish58 0.1% Haitian57 0.1% Palestinian54 0.1% British50 0.1% French40 0.09% Macedonian34 0.07% French Canadian34 0.07% Welsh33 0.07% South African28 0.06% Syrian28 0.06% Scotch-Irish27 0.06% Lithuanian22 0.05% Norwegian22 0.05% Finnish22 0.05% Carpatho Rusyn19 0.04% Belgian17 0.04% Romanian16 0.03% Portuguese15 0.03% Bulgarian14 0.03% Slovak11 0.02% Barbadian9 0.02% Austrian8 0.02% Slovene8 0.02% Scandinavian8 0.02% Moroccan5 0.01% Czech5 0.01% Czechoslovakian4 0.01% Trinidadian and Tobagonian3 0.01% Latvian
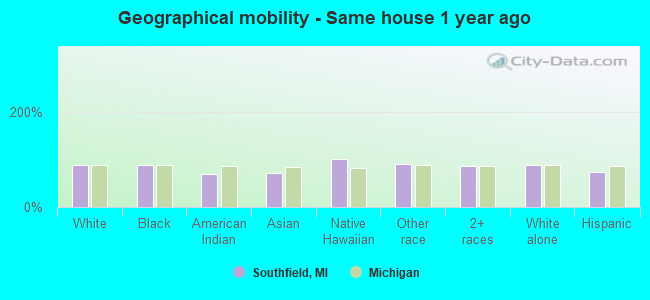
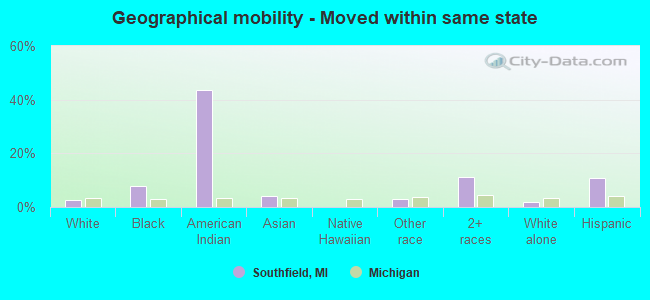
Geographical mobility in Southfield Same house 1 year ago 14,075 86.6% White (Caucasian)44,797 88.5% Black or African American46 70.4% American Indian / Alaska Native1,012 70.9% Asian37 100.0% Native Hawaiian / Pacific Islander441 89.9% Other race4,486 85.5% Two or more races14,047 87.9% White alone, not Hispanic / Latino870 74.1% Hispanic or LatinoMoved within same county 1,510 9.3% White / Caucasian1,353 2.7% Black or African American196 13.7% Asian10 2.1% Other race19 0.4% Two or more races1,404 8.8% White alone, not Hispanic / Latino147 12.5% Hispanic or LatinoMoved within same state 409 2.5% White / Caucasian3,878 7.7% Black or African American29 43.7% American Indian / Alaska Native60 4.2% Asian15 3.0% Other race577 11.0% Two or more races306 1.9% White alone, not Hispanic / Latino129 10.9% Hispanic or LatinoMoved from different state 196 1.2% White / Caucasian446 0.9% Black or African American56 3.9% Asian3 0.6% Other race28 0.5% Two or more races173 1.1% White alone, not Hispanic / Latino12 1.1% Hispanic or LatinoMoved from abroad 56 0.3% White120 0.2% Black or African American51 3.6% Asian23 4.6% Other race136 2.6% Two or more races56 0.4% White alone, not Hispanic / Latino24 2.1% Hispanic or Latino
Children Nativity (place of birth) in Southfield
Children under 6 years - Living with two parents Both parents native 2,425 100.0% Native0 0.0% Foreign-bornBoth parents foreign-born 239 96.2% Native10 3.8% Foreign-bornOne native, one foreign-born parent 172 100.0% NativeChildren under 6 years - Living with one parent Native parent 1,859 100.0% NativeForeign-born parent 38 100.0% NativeChildren 6 to 17 years - Living with two parents Both parents native 3,699 100.0% NativeBoth parents foreign-born 542 66.5% Native273 33.5% Foreign-bornOne native, one foreign-born parent 202 91.0% Native20 9.0% Foreign-bornChildren 6 to 17 years - Living with one parent Native parent 4,397 100.0% NativeForeign-born parent 67 46.9% Native76 53.1% Foreign-born
Grandparents responsible for own grandchildren in Southfield
Grandparents (30 to 59 years) White / Caucasian 40 100.0% Not responsible for grandchildrenBlack or African American 48 11.5% Responsible for grandchildren366 88.5% Not responsible for grandchildrenAmerican Indian / Alaska Native 4 100.0% Responsible for grandchildrenTwo or more races 26 100.0% Not responsible for grandchildrenWhite alone, not Hispanic / Latino 41 100.0% Not responsible for grandchildrenHispanic or Latino 4 100.0% Responsible for grandchildrenGrandparents (60 years and over) White / Caucasian 10 8.0% Responsible for grandchildren109 92.0% Not responsible for grandchildrenBlack or African American 117 11.5% Responsible for grandchildren893 88.5% Not responsible for grandchildrenWhite alone, not Hispanic / Latino 10 8.3% Responsible for grandchildren110 91.7% Not responsible for grandchildren