Races in Southbridge, Massachusetts (MA) Detailed Stats
Ancestries, Foreign-born residents, place of birth

Recent posts about races in Southbridge, Massachusetts on our local forum with over 2,400,000 registered users:

Latest news about races in Southbridge, MA collected exclusively by city-data.com from local newspapers, TV, and radio stations
5.3% of Southbridge, MA residents are foreign-born (1.6% born in Asia, 1.5% born in Europe, 1.1% born in North America, 1.0% born in Latin America), which is 241.4% less than the foreign-born rate of 18.0% across the entire state of Massachusetts.
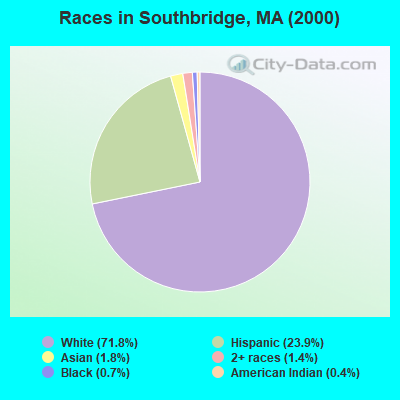
Race distribution in Southbridge

- 9,24571.8%White alone
- 3,07323.9%Hispanic
- 2311.8%Asian alone
- 1791.4%Two or more races
- 890.7%Black alone
- 470.4%American Indian alone
- 90.07%Other race alone
- 50.04%Native Hawaiian and Other
Pacific Islander alone
2000
2022
-
- 5,198,35981.9%White alone
- 428,7296.8%Hispanic
- 318,3295.0%Black alone
- 236,7863.7%Asian alone
- 110,3381.7%Two or more races
- 43,5860.7%Other race alone
- 11,2640.2%American Indian alone
- 1,7060.03%Native Hawaiian and Other
Pacific Islander alone

-
- 4,676,62767.0%White alone
- 911,03813.0%Hispanic
- 501,4637.2%Asian alone
- 459,7406.6%Black alone
- 341,8894.9%Two or more races
- 84,4031.2%Other race alone
- 5,8380.08%American Indian alone
- 9760.01%Native Hawaiian and Other
Pacific Islander alone

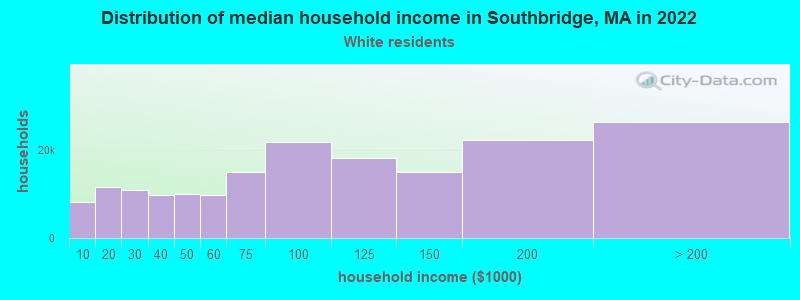
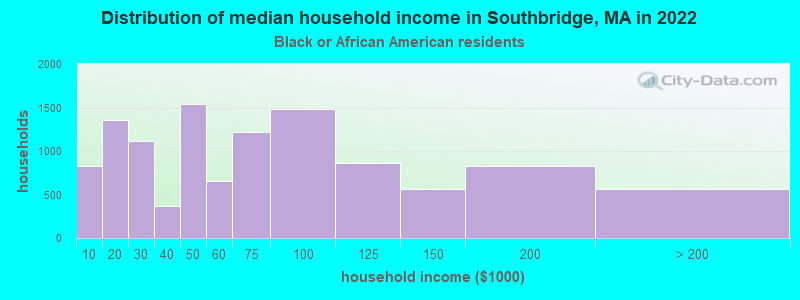
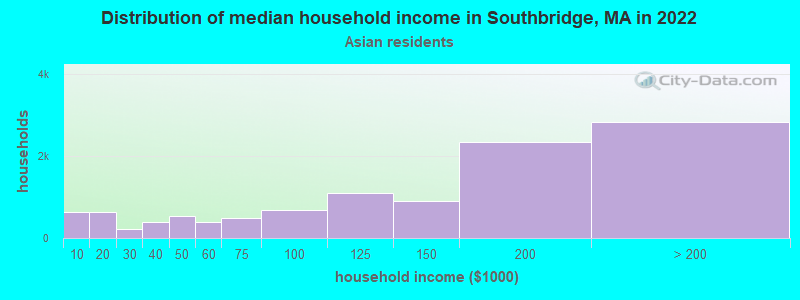
Income and house value in Southbridge
- Median household income in 2022
- $63,080White non-Hispanic householders
- $43,799Black householders
- $100,515Asian householders
- $67,635Some other race householders
- $22,859Two or more races householders
- $47,688Hispanic or Latino race householders
- Median 2022 house value
- $296,316White Non-Hispanic householders
- $216,230Asian householders
- $316,476Some other race householders
- $285,270Hispanic or Latino householders
Household income for White non-Hispanic householders
Household income for Black householders
Household income for Asian householders
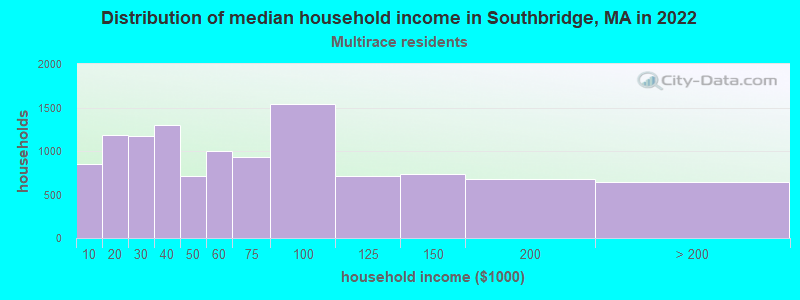
Household income for Two or more races householders
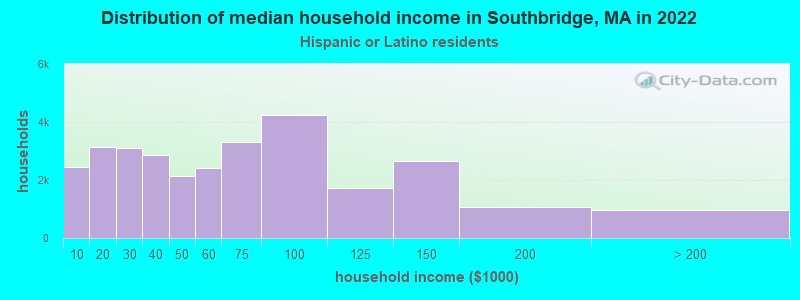
Household income for Hispanic or Latino race householders
Foreign-born residents in Southbridge
679 residents are foreign born (1.6% Asia, 1.5% Europe, 1.1% North America, 1.0% Latin America).
| This city: | 5.3% |
| Massachusetts: | 12.2% |
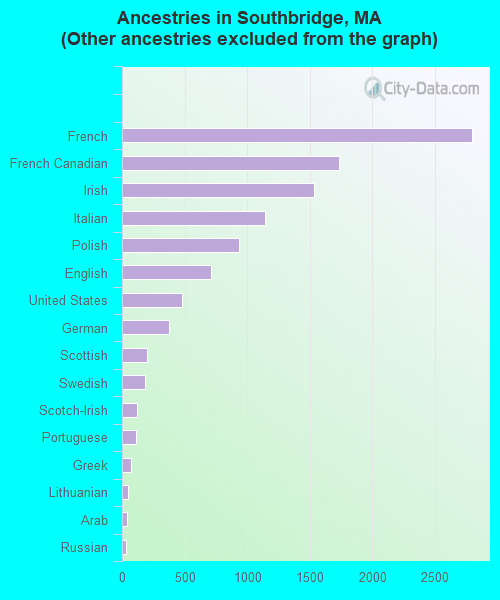
Ancestries in Southbridge

- 3,87226.7%Other
- 2,79619.3%French
- 1,73312.0%French Canadian
- 1,53310.6%Irish
- 1,1417.9%Italian
- 9336.4%Polish
- 7114.9%English
- 4823.3%United States
- 3772.6%German
- 1981.4%Scottish
- 1861.3%Swedish
- 1220.8%Scotch-Irish
- 1080.7%Portuguese
- 750.5%Greek
- 470.3%Lithuanian
- 370.3%Arab
- 350.2%Russian
- 210.1%Slovak
- 170.1%Danish
- 110.08%Norwegian
- 110.08%Subsaharan African
- 80.06%Hungarian
- 80.06%West Indian
- 70.05%Ukrainian
- 60.04%Czech
- 50.03%Dutch
- 40.03%Welsh
Zip codes: 01550.