Races in South Yakima, Washington (WA) Detailed Stats
Ancestries, Foreign-born residents, place of birth
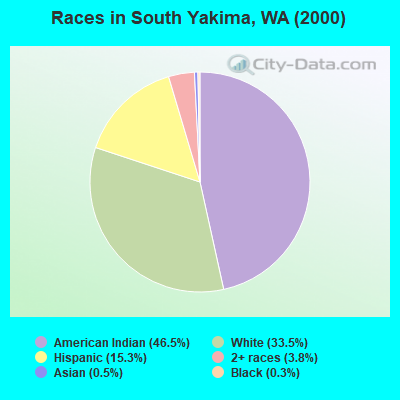
Race distribution in South Yakima

- 2,01246.5%American Indian alone
- 1,44833.5%White alone
- 66015.3%Hispanic
- 1643.8%Two or more races
- 220.5%Asian alone
- 150.3%Black alone
- 30.07%Other race alone
- 20.05%Native Hawaiian and Other
Pacific Islander alone
2000
2022
-
- 4,652,49078.9%White alone
- 441,5097.5%Hispanic
- 319,4015.4%Asian alone
- 184,6313.1%Black alone
- 175,9263.0%Two or more races
- 85,3961.4%American Indian alone
- 22,7790.4%Native Hawaiian and Other
Pacific Islander alone - 11,9890.2%Other race alone

-
- 4,941,45663.5%White alone
- 1,093,31314.0%Hispanic
- 755,8329.7%Asian alone
- 523,4486.7%Two or more races
- 299,5373.8%Black alone
- 69,0240.9%American Indian alone
- 52,2310.7%Native Hawaiian and Other
Pacific Islander alone - 50,9450.7%Other race alone

Income and house value in South Yakima
- Median household income in 2022
- $72,564White non-Hispanic householders
- $102,046Black householders
- $61,643American Indian and Alaska Native householders
- $48,607Asian householders
- $47,350Some other race householders
- $59,331Two or more races householders
- $52,552Hispanic or Latino race householders
- Median 2022 house value
- $409,421White Non-Hispanic householders
- $221,361American Indian or Alaska Native householders
- $278,171Asian householders
- $156,156Some other race householders
- $167,910Hispanic or Latino householders
Household income for White non-Hispanic householders

Household income for Black householders

Household income for American Indian and Alaska Native householders

Household income for Asian householders

Household income for Two or more races householders

Household income for Hispanic or Latino race householders

Zip code: 98952