Races in South Valley Stream, New York (NY) Detailed Stats
Data:
Races - White alone (%)
Races - White alone (% change since 2000)
Races - Black alone (%)
Races - Black alone (% change since 2000)
Races - American Indian alone (%)
Races - American Indian alone (% change since 2000)
Races - Asian alone (%)
Races - Asian alone (% change since 2000)
Races - Hispanic (%)
Races - Hispanic (% change since 2000)
Races - Native Hawaiian and Other Pacific Islander alone (%)
Races - Native Hawaiian and Other Pacific Islander alone (% change since 2000)
Races - Two or more races(%)
Races - Two or more races(% change since 2000)
Races - Other race alone (%)
Races - Other race alone (% change since 2000)
Racial diversity
Place of birth - Born in state of residence (%)
Place of birth - Born in state of residence (%) - White
Place of birth - Born in state of residence (%) - Black or African American
Place of birth - Born in state of residence (%) - Asian
Place of birth - Born in state of residence (%) - Hispanic or Latino
Place of birth - Born in state of residence (%) - American Indian and Alaska Native
Place of birth - Born in state of residence (%) - Multirace
Place of birth - Born in state of residence (%) - Other Race
Place of birth - Born in other state (%)
Place of birth - Born in other state (%) - White
Place of birth - Born in other state (%) - Black or African American
Place of birth - Born in other state (%) - Asian
Place of birth - Born in other state (%) - Hispanic or Latino
Place of birth - Born in other state (%) - American Indian and Alaska Native
Place of birth - Born in other state (%) - Multirace
Place of birth - Born in other state (%) - Other Race
Place of birth - Native, outside of US (%)
Place of birth - Native, outside of US (%) - White
Place of birth - Native, outside of US (%) - Black or African American
Place of birth - Native, outside of US (%) - Asian
Place of birth - Native, outside of US (%) - Hispanic or Latino
Place of birth - Native, outside of US (%) - American Indian and Alaska Native
Place of birth - Native, outside of US (%) - Multirace
Place of birth - Native, outside of US (%) - Other Race
Place of birth - Foreign born (%)
Place of birth - Foreign born (%) - White
Place of birth - Foreign born (%) - Black or African American
Place of birth - Foreign born (%) - Asian
Place of birth - Foreign born (%) - Hispanic or Latino
Place of birth - Foreign born (%) - American Indian and Alaska Native
Place of birth - Foreign born (%) - Multirace
Place of birth - Foreign born (%) - Other Race
Residents speaking English at home (%)
Residents speaking English at home - Born in the United States (%)
Residents speaking English at home - Native, born elsewhere (%)
Residents speaking English at home - Foreign born (%)
Residents speaking Spanish at home (%)
Residents speaking Spanish at home - Born in the United States (%)
Residents speaking Spanish at home - Native, born elsewhere (%)
Residents speaking Spanish at home - Foreign born (%)
Residents speaking other language at home (%)
Residents speaking other language at home - Born in the United States (%)
Residents speaking other language at home - Native, born elsewhere (%)
Residents speaking other language at home - Foreign born (%)
Marital status - Never married (%)
Marital status - Now married (%)
Marital status - Separated (%)
Marital status - Widowed (%)
Marital status - Divorced (%)
Ancestries Reported - Arab (%)
Ancestries Reported - Czech (%)
Ancestries Reported - Danish (%)
Ancestries Reported - Dutch (%)
Ancestries Reported - English (%)
Ancestries Reported - French (%)
Ancestries Reported - French Canadian (%)
Ancestries Reported - German (%)
Ancestries Reported - Greek (%)
Ancestries Reported - Hungarian (%)
Ancestries Reported - Irish (%)
Ancestries Reported - Italian (%)
Ancestries Reported - Lithuanian (%)
Ancestries Reported - Norwegian (%)
Ancestries Reported - Polish (%)
Ancestries Reported - Portuguese (%)
Ancestries Reported - Russian (%)
Ancestries Reported - Scotch-Irish (%)
Ancestries Reported - Scottish (%)
Ancestries Reported - Slovak (%)
Ancestries Reported - Subsaharan African (%)
Ancestries Reported - Swedish (%)
Ancestries Reported - Swiss (%)
Ancestries Reported - Ukrainian (%)
Ancestries Reported - United States (%)
Ancestries Reported - Welsh (%)
Ancestries Reported - West Indian (%)
Ancestries Reported - Other (%)
Geographical mobility - Same house 1 year ago (%)
Geographical mobility - Same house 1 year ago (%) - White
Geographical mobility - Same house 1 year ago (%) - Black or African American
Geographical mobility - Same house 1 year ago (%) - Asian
Geographical mobility - Same house 1 year ago (%) - Hispanic or Latino
Geographical mobility - Same house 1 year ago (%) - American Indian and Alaska Native
Geographical mobility - Same house 1 year ago (%) - Multirace
Geographical mobility - Same house 1 year ago (%) - Other Race
Geographical mobility - Moved within same county (%)
Geographical mobility - Moved within same county (%) - White
Geographical mobility - Moved within same county (%) - Black or African American
Geographical mobility - Moved within same county (%) - Asian
Geographical mobility - Moved within same county (%) - Hispanic or Latino
Geographical mobility - Moved within same county (%) - American Indian and Alaska Native
Geographical mobility - Moved within same county (%) - Multirace
Geographical mobility - Moved within same county (%) - Other Race
Geographical mobility - Moved from different county within same state (%)
Geographical mobility - Moved from different county within same state (%) - White
Geographical mobility - Moved from different county within same state (%) - Black or African American
Geographical mobility - Moved from different county within same state (%) - Asian
Geographical mobility - Moved from different county within same state (%) - Hispanic or Latino
Geographical mobility - Moved from different county within same state (%) - American Indian and Alaska Native
Geographical mobility - Moved from different county within same state (%) - Multirace
Geographical mobility - Moved from different county within same state (%) - Other Race
Geographical mobility - Moved from different state (%)
Geographical mobility - Moved from different state (%) - White
Geographical mobility - Moved from different state (%) - Black or African American
Geographical mobility - Moved from different state (%) - Asian
Geographical mobility - Moved from different state (%) - Hispanic or Latino
Geographical mobility - Moved from different state (%) - American Indian and Alaska Native
Geographical mobility - Moved from different state (%) - Multirace
Geographical mobility - Moved from different state (%) - Other Race
Geographical mobility - Moved from abroad (%)
Geographical mobility - Moved from abroad (%) - White
Geographical mobility - Moved from abroad (%) - Black or African American
Geographical mobility - Moved from abroad (%) - Asian
Geographical mobility - Moved from abroad (%) - Hispanic or Latino
Geographical mobility - Moved from abroad (%) - American Indian and Alaska Native
Geographical mobility - Moved from abroad (%) - Multirace
Geographical mobility - Moved from abroad (%) - Other Race
Place of birth for the foreign-born population - Ireland (%)
Place of birth for the foreign-born population - Denmark (%)
Place of birth for the foreign-born population - Norway (%)
Place of birth for the foreign-born population - Sweden (%)
Place of birth for the foreign-born population - United Kingdom (%)
Place of birth for the foreign-born population - England (%)
Place of birth for the foreign-born population - Scotland (%)
Place of birth for the foreign-born population - Other Northern Europe (%)
Place of birth for the foreign-born population - Austria (%)
Place of birth for the foreign-born population - Belgium (%)
Place of birth for the foreign-born population - France (%)
Place of birth for the foreign-born population - Germany (%)
Place of birth for the foreign-born population - Netherlands (%)
Place of birth for the foreign-born population - Switzerland (%)
Place of birth for the foreign-born population - Other Western Europe (%)
Place of birth for the foreign-born population - Greece (%)
Place of birth for the foreign-born population - Italy (%)
Place of birth for the foreign-born population - Portugal (%)
Place of birth for the foreign-born population - Spain (%)
Place of birth for the foreign-born population - Other Southern Europe (%)
Place of birth for the foreign-born population - Albania (%)
Place of birth for the foreign-born population - Belarus (%)
Place of birth for the foreign-born population - Bosnia and Herzegovina (%)
Place of birth for the foreign-born population - Bulgaria (%)
Place of birth for the foreign-born population - Croatia (%)
Place of birth for the foreign-born population - Czechoslovakia (%)
Place of birth for the foreign-born population - Hungary (%)
Place of birth for the foreign-born population - Latvia (%)
Place of birth for the foreign-born population - Lithuania (%)
Place of birth for the foreign-born population - North Macedonia (Macedonia) (%)
Place of birth for the foreign-born population - Moldova (%)
Place of birth for the foreign-born population - Poland (%)
Place of birth for the foreign-born population - Romania (%)
Place of birth for the foreign-born population - Russia (%)
Place of birth for the foreign-born population - Serbia (%)
Place of birth for the foreign-born population - Ukraine (%)
Place of birth for the foreign-born population - Other Eastern Europe (%)
Place of birth for the foreign-born population - China (%)
Place of birth for the foreign-born population - Hong Kong (%)
Place of birth for the foreign-born population - Taiwan (%)
Place of birth for the foreign-born population - Japan (%)
Place of birth for the foreign-born population - Korea (%)
Place of birth for the foreign-born population - Other Eastern Asia (%)
Place of birth for the foreign-born population - Afghanistan (%)
Place of birth for the foreign-born population - Bangladesh (%)
Place of birth for the foreign-born population - India (%)
Place of birth for the foreign-born population - Iran (%)
Place of birth for the foreign-born population - Kazakhstan (%)
Place of birth for the foreign-born population - Nepal (%)
Place of birth for the foreign-born population - Pakistan (%)
Place of birth for the foreign-born population - Sri Lanka (%)
Place of birth for the foreign-born population - Uzbekistan (%)
Place of birth for the foreign-born population - Other South Central Asia (%)
Place of birth for the foreign-born population - Burma (%)
Place of birth for the foreign-born population - Cambodia (%)
Place of birth for the foreign-born population - Indonesia (%)
Place of birth for the foreign-born population - Laos (%)
Place of birth for the foreign-born population - Malaysia (%)
Place of birth for the foreign-born population - Philippines (%)
Place of birth for the foreign-born population - Singapore (%)
Place of birth for the foreign-born population - Thailand (%)
Place of birth for the foreign-born population - Vietnam (%)
Place of birth for the foreign-born population - Other South Eastern Asia (%)
Place of birth for the foreign-born population - Armenia (%)
Place of birth for the foreign-born population - Iraq (%)
Place of birth for the foreign-born population - Israel (%)
Place of birth for the foreign-born population - Jordan (%)
Place of birth for the foreign-born population - Kuwait (%)
Place of birth for the foreign-born population - Lebanon (%)
Place of birth for the foreign-born population - Saudi Arabia (%)
Place of birth for the foreign-born population - Syria (%)
Place of birth for the foreign-born population - Turkey (%)
Place of birth for the foreign-born population - Yemen (%)
Place of birth for the foreign-born population - Other Western Asia (%)
Place of birth for the foreign-born population - Eritrea (%)
Place of birth for the foreign-born population - Ethiopia (%)
Place of birth for the foreign-born population - Kenya (%)
Place of birth for the foreign-born population - Somalia (%)
Place of birth for the foreign-born population - Uganda (%)
Place of birth for the foreign-born population - Zimbabwe (%)
Place of birth for the foreign-born population - Other Eastern Africa (%)
Place of birth for the foreign-born population - Cameroon (%)
Place of birth for the foreign-born population - Congo (%)
Place of birth for the foreign-born population - Democratic Republic of Congo (Zaire) (%)
Place of birth for the foreign-born population - Other Middle Africa (%)
Place of birth for the foreign-born population - Egypt (%)
Place of birth for the foreign-born population - Morocco (%)
Place of birth for the foreign-born population - Sudan (%)
Place of birth for the foreign-born population - Other Northern Africa (%)
Place of birth for the foreign-born population - South Africa (%)
Place of birth for the foreign-born population - Other Southern Africa (%)
Place of birth for the foreign-born population - Cabo Verde (%)
Place of birth for the foreign-born population - Ghana (%)
Place of birth for the foreign-born population - Liberia (%)
Place of birth for the foreign-born population - Nigeria (%)
Place of birth for the foreign-born population - Senegal (%)
Place of birth for the foreign-born population - Sierra Leone (%)
Place of birth for the foreign-born population - Other Western Africa (%)
Place of birth for the foreign-born population - Australia (%)
Place of birth for the foreign-born population - New Zealand (%)
Place of birth for the foreign-born population - Fiji (%)
Place of birth for the foreign-born population - Micronesia (%)
Place of birth for the foreign-born population - Bahamas (%)
Place of birth for the foreign-born population - Barbados (%)
Place of birth for the foreign-born population - Cuba (%)
Place of birth for the foreign-born population - Dominica (%)
Place of birth for the foreign-born population - Dominican Republic (%)
Place of birth for the foreign-born population - Grenada (%)
Place of birth for the foreign-born population - Haiti (%)
Place of birth for the foreign-born population - Jamaica (%)
Place of birth for the foreign-born population - St. Vincent and the Grenadines (%)
Place of birth for the foreign-born population - Trinidad and Tobago (%)
Place of birth for the foreign-born population - West Indies (%)
Place of birth for the foreign-born population - Other Caribbean (%)
Place of birth for the foreign-born population - Belize (%)
Place of birth for the foreign-born population - Costa Rica (%)
Place of birth for the foreign-born population - El Salvador (%)
Place of birth for the foreign-born population - Guatemala (%)
Place of birth for the foreign-born population - Honduras (%)
Place of birth for the foreign-born population - Mexico (%)
Place of birth for the foreign-born population - Nicaragua (%)
Place of birth for the foreign-born population - Panama (%)
Place of birth for the foreign-born population - Other Central America (%)
Place of birth for the foreign-born population - Argentina (%)
Place of birth for the foreign-born population - Bolivia (%)
Place of birth for the foreign-born population - Brazil (%)
Place of birth for the foreign-born population - Chile (%)
Place of birth for the foreign-born population - Colombia (%)
Place of birth for the foreign-born population - Ecuador (%)
Place of birth for the foreign-born population - Guyana (%)
Place of birth for the foreign-born population - Peru (%)
Place of birth for the foreign-born population - Uruguay (%)
Place of birth for the foreign-born population - Venezuela (%)
Place of birth for the foreign-born population - Other South America (%)
Place of birth for the foreign-born population - Canada (%)
Place of birth for the foreign-born population - Other Northern America (%)
Place of birth for the foreign-born population - Other (%)
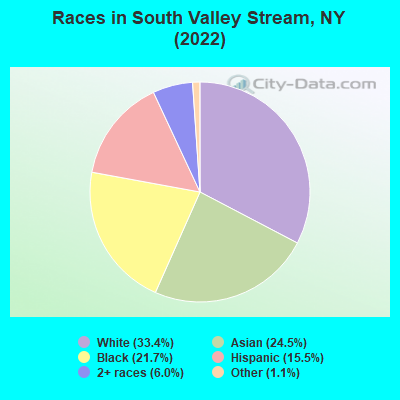
According to 2022 data, the most numerous races in South Valley Stream, NY are White alone (2,169 residents), Hispanic (1,006 residents), and Black alone (1,410 residents). 71.8% of South Valley Stream residents speak English at home. 30.6% of South Valley Stream, NY residents are foreign-born (17.6% born in Latin America, 9.6% born in Asia), which is 28.1% greater than the foreign-born rate of 22.0% across the entire state of New York.
Race distribution in South Valley Stream
2000 2022
11,760,981 62.0% White alone 2,867,583 15.1% Hispanic 2,812,623 14.8% Black alone 1,035,926 5.5% Asian alone 366,116 1.9% Two or more races 75,499 0.4% Other race alone 52,499 0.3% American Indian alone 5,230 0.03% Native Hawaiian and Other
10,408,933 52.9% White alone 3,867,299 19.7% Hispanic 2,633,840 13.4% Black alone 1,776,286 9.0% Asian alone 732,670 3.7% Two or more races 216,110 1.1% Other race alone 35,082 0.2% American Indian alone 6,931 0.04% Native Hawaiian and Other
Income and house value in South Valley Stream Median household income in 2022 $128,250 White non-Hispanic householders$178,082 Black householders$189,579 Asian householders$77,515 Two or more races householdersMedian 2022 house value $636,406 White Non-Hispanic householders$635,626 Black or African American householders $689,678 Asian householders$671,227 Some other race householders$724,759 Two or more races householders$594,827 Hispanic or Latino householders
Median age by race in South Valley Stream
44.2 Median age for White residents45.0 39.1 50.8 Median age for Black or African American residents55.1 50.3 75.6 Median age for American Indian / Alaska Native residents-607,543,322.5 -837,121,211.3 32.3 Median age for Asian residents34.4 31.0 -487,992,314.6 Median age for Native Hawaiian / Pacific Islander residents-477,502,295.2 -497,387,669.3 52.8 Median age for Other race residents24.3 53.1 16.1 Median age for Two or more races residents14.2 61.8 47.9 Median age for White alone residents48.2 42.9 47.7 Median age for Hispanic or Latino residents22.6 51.9
Owner/renter occupied households by race in South Valley Stream
House owners and renters - White residents 725 85.6% Owner occupied122 14.4% Renter occupiedHouse owners and renters - Black or African American residents 431 80.9% Owner occupied102 19.1% Renter occupiedHouse owners and renters - Asian residents 187 69.5% Owner occupied82 30.5% Renter occupiedHouse owners and renters - Other race residents 137 51.7% Owner occupied128 48.3% Renter occupiedHouse owners and renters - Two or more races residents 16 31.1% Owner occupied34 68.9% Renter occupiedHouse owners and renters - White alone residents 719 87.2% Owner occupied105 12.8% Renter occupiedHouse owners and renters - Hispanic or Latino residents 134 48.4% Owner occupied143 51.6% Renter occupied
Language usage in South Valley Stream
English speakers - Total 71.8% of residents of South Valley Stream speak English at home.
6.8% of residents speak Spanish at home 227 53.2% Speak English very well200 46.8% Speak English less than very well21.6% of residents speak other language at home 1,159 85.2% Speak English very well202 14.8% Speak English less than very well
English speakers - Born in the United States 92.2% of residents of South Valley Stream speak English at home.
4.9% of residents speak other language at home 5 100.0% Speak English very well
English speakers - Native, born elsewhere 84.9% of residents of South Valley Stream speak English at home.
10.9% of residents speak Spanish at home 36 100.0% Speak English very well
English speakers - Foreign-born 41.3% of residents of South Valley Stream speak English at home.
12.9% of residents speak Spanish at home 92 34.7% Speak English very well173 65.3% Speak English less than very well45.6% of residents speak other language at home 743 79.2% Speak English very well195 20.8% Speak English less than very well
White (Caucasian) - Speak only English Native:
94.0% (1,913)Foreign-born:
38.2% (61)
White (Caucasian) - Speak another language Native:
6.1% (123)Foreign-born:
63.7% (101)
Black or African American - Speak only English Native:
99.1% (601)Foreign-born:
83.7% (637)
Asian - Speak only English Native:
58.7% (456)Foreign-born:
6.1% (41)
Asian - Speak another language Native:
41.9% (326)Foreign-born:
95.4% (639)
Other race - Speak only English Native:
97.1% (541)Foreign-born:
5.2% (16)
Other race - Speak another language Native:
11.7% (65)Foreign-born:
95.5% (296)
Two or more races - Speak only English Native:
83.2% (352)Foreign-born:
56.6% (114)
Two or more races - Speak another language Native:
12.5% (53)Foreign-born:
37.4% (75)
White alone - Speak only English Native:
95.4% (1,822)Foreign-born:
31.3% (64)
White alone - Speak another language Native:
4.6% (89)Foreign-born:
68.7% (141)
Hispanic or Latino - Speak only English Native:
78.1% (559)Foreign-born:
9.7% (28)
Hispanic or Latino - Speak another language Native:
21.1% (151)Foreign-born:
90.3% (260)
Foreign-born residents in South Valley Stream 1,989 residents are foreign born (17.6% Latin America , 9.6% Asia ).
This city:
30.6%New York:
22.6%
Marital status for residents in South Valley Stream Marital status - White (Caucasian) population 15 years and over
Males 22.0% Never married62.1% Now married0.0% Separated13.5% Widowed2.5% DivorcedFemales 24.5% Never married54.3% Now married0.9% Separated11.4% Widowed8.9% DivorcedWomen who gave birth in the past 12 months Now married:
100.0% (54)Unmarried:
0.0% (0)
Women who did not give birth in the past 12 months Now married:
28.1% (98)Unmarried:
71.9% (251)
Marital status - Black or African American population 15 years and over
Males 23.1% Never married70.0% Now married0.0% Separated0.0% Widowed6.9% DivorcedFemales 37.1% Never married47.4% Now married3.6% Separated0.0% Widowed11.9% DivorcedWomen who gave birth in the past 12 months Now married:
100.0% (10)Unmarried:
0.0% (0)
Women who did not give birth in the past 12 months Now married:
36.2% (134)Unmarried:
63.8% (236)
Marital status - American Indian / Alaska Native population 15 years and over
Males 100.0% Never married0.0% Now married0.0% Separated0.0% Widowed0.0% DivorcedFemales 52.6% Never married47.4% Now married0.0% Separated0.0% Widowed0.0% DivorcedMarital status - Asian population 15 years and over
Males 44.1% Never married55.9% Now married0.0% Separated0.0% Widowed0.0% DivorcedFemales 20.4% Never married64.9% Now married8.4% Separated2.0% Widowed4.3% DivorcedWomen who gave birth in the past 12 months Now married:
100.0% (17)Unmarried:
0.0% (0)
Women who did not give birth in the past 12 months Now married:
59.5% (165)Unmarried:
40.5% (112)
Marital status - Other race population 15 years and over
Males 47.2% Never married52.8% Now married0.0% Separated0.0% Widowed0.0% DivorcedFemales 43.1% Never married36.0% Now married0.0% Separated20.9% Widowed0.0% DivorcedWomen who did not give birth in the past 12 months Now married:
28.0% (48)Unmarried:
72.0% (123)
Marital status - Two or more races population 15 years and over
Males 92.2% Never married7.8% Now married0.0% Separated0.0% Widowed0.0% DivorcedFemales 19.7% Never married34.6% Now married0.0% Separated45.7% Widowed0.0% DivorcedWomen who did not give birth in the past 12 months Now married:
0.0% (0)Unmarried:
100.0% (18)
Marital status - White alone, not Hispanic / Latino population 15 years and over
Males 22.4% Never married61.4% Now married0.0% Separated13.7% Widowed2.5% DivorcedFemales 23.0% Never married56.4% Now married0.9% Separated11.8% Widowed7.9% DivorcedWomen who gave birth in the past 12 months Now married:
100.0% (57)Unmarried:
0.0% (0)
Women who did not give birth in the past 12 months Now married:
31.0% (105)Unmarried:
69.0% (234)
Marital status - Hispanic or Latino population 15 years and over
Males 37.5% Never married62.5% Now married0.0% Separated0.0% Widowed0.0% DivorcedFemales 44.6% Never married34.9% Now married0.0% Separated17.6% Widowed2.9% DivorcedWomen who did not give birth in the past 12 months Now married:
22.6% (42)Unmarried:
77.4% (143)
Ancestries in South Valley Stream
520 19.1% Jamaican209 7.7% Trinidadian and Tobagonian168 6.2% Guyanese166 6.1% Italian105 3.9% American93 3.4% Eastern European75 2.8% West Indian74 2.7% Haitian59 2.2% Russian43 1.6% Polish37 1.4% Nigerian27 1.0% Israeli21 0.8% Hungarian13 0.5% Greek6 0.2% Syrian5 0.2% German5 0.2% Irish5 0.2% Ukrainian3 0.1% Canadian3 0.1% Swedish
Children Nativity (place of birth) in South Valley Stream
Children under 6 years - Living with two parents Both parents native 78 100.0% NativeBoth parents foreign-born 51 100.0% NativeOne native, one foreign-born parent 5 100.0% NativeChildren under 6 years - Living with one parent Native parent 138 100.0% NativeChildren 6 to 17 years - Living with two parents Both parents native 126 100.0% NativeBoth parents foreign-born 374 100.0% NativeOne native, one foreign-born parent 306 100.0% NativeChildren 6 to 17 years - Living with one parent Native parent 221 100.0% NativeForeign-born parent 174 47.2% Native195 52.8% Foreign-born