Races in South Sioux City, Nebraska (NE) Detailed Stats
Data:
Races - White alone (%)
Races - White alone (% change since 2000)
Races - Black alone (%)
Races - Black alone (% change since 2000)
Races - American Indian alone (%)
Races - American Indian alone (% change since 2000)
Races - Asian alone (%)
Races - Asian alone (% change since 2000)
Races - Hispanic (%)
Races - Hispanic (% change since 2000)
Races - Native Hawaiian and Other Pacific Islander alone (%)
Races - Native Hawaiian and Other Pacific Islander alone (% change since 2000)
Races - Two or more races(%)
Races - Two or more races(% change since 2000)
Races - Other race alone (%)
Races - Other race alone (% change since 2000)
Racial diversity
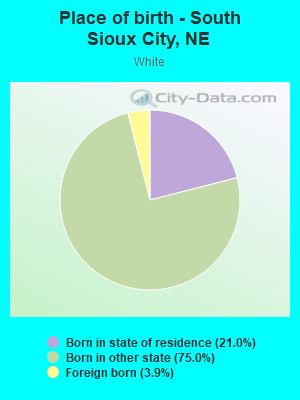
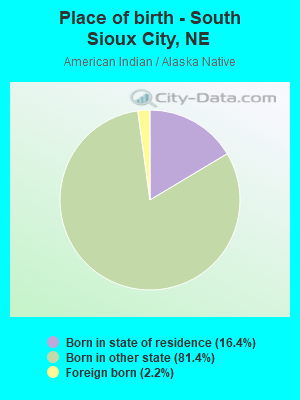
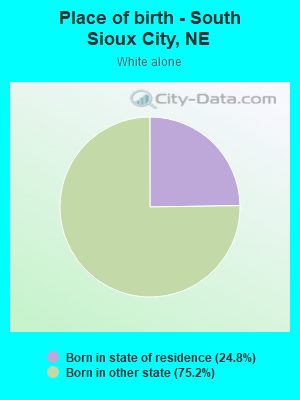
Place of birth - Born in state of residence (%)
Place of birth - Born in state of residence (%) - White
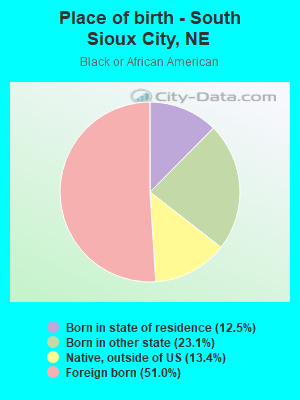
Place of birth - Born in state of residence (%) - Black or African American
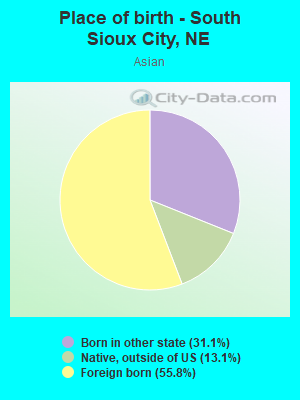
Place of birth - Born in state of residence (%) - Asian
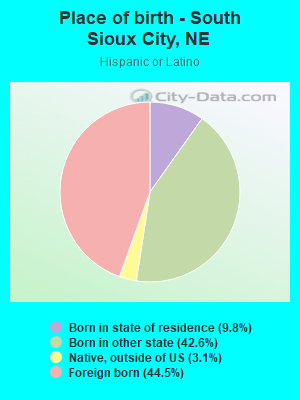
Place of birth - Born in state of residence (%) - Hispanic or Latino
Place of birth - Born in state of residence (%) - American Indian and Alaska Native
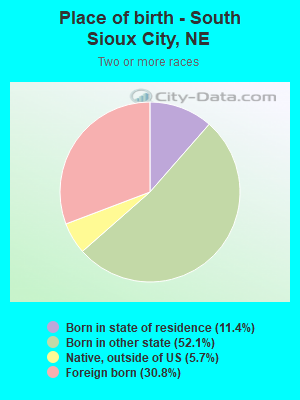
Place of birth - Born in state of residence (%) - Multirace
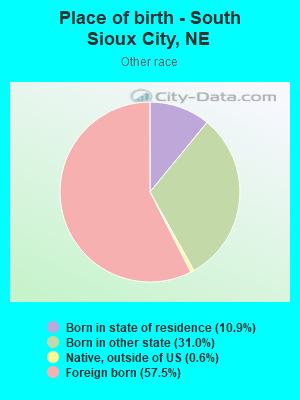
Place of birth - Born in state of residence (%) - Other Race
Place of birth - Born in other state (%)
Place of birth - Born in other state (%) - White
Place of birth - Born in other state (%) - Black or African American
Place of birth - Born in other state (%) - Asian
Place of birth - Born in other state (%) - Hispanic or Latino
Place of birth - Born in other state (%) - American Indian and Alaska Native
Place of birth - Born in other state (%) - Multirace
Place of birth - Born in other state (%) - Other Race
Place of birth - Native, outside of US (%)
Place of birth - Native, outside of US (%) - White
Place of birth - Native, outside of US (%) - Black or African American
Place of birth - Native, outside of US (%) - Asian
Place of birth - Native, outside of US (%) - Hispanic or Latino
Place of birth - Native, outside of US (%) - American Indian and Alaska Native
Place of birth - Native, outside of US (%) - Multirace
Place of birth - Native, outside of US (%) - Other Race
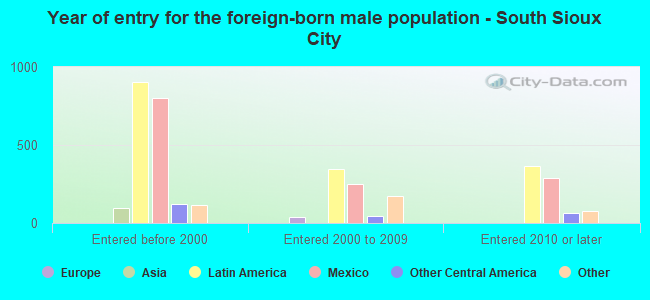
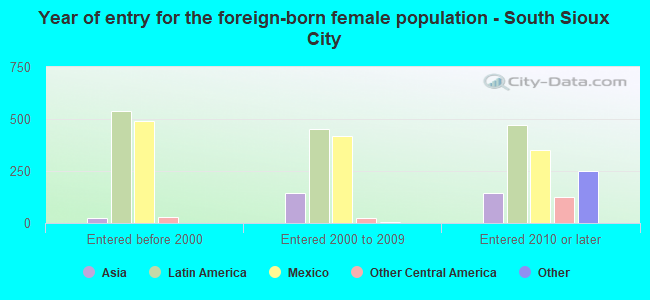
Place of birth - Foreign born (%)
Place of birth - Foreign born (%) - White
Place of birth - Foreign born (%) - Black or African American
Place of birth - Foreign born (%) - Asian
Place of birth - Foreign born (%) - Hispanic or Latino
Place of birth - Foreign born (%) - American Indian and Alaska Native
Place of birth - Foreign born (%) - Multirace
Place of birth - Foreign born (%) - Other Race
Residents speaking English at home (%)
Residents speaking English at home - Born in the United States (%)
Residents speaking English at home - Native, born elsewhere (%)
Residents speaking English at home - Foreign born (%)
Residents speaking Spanish at home (%)
Residents speaking Spanish at home - Born in the United States (%)
Residents speaking Spanish at home - Native, born elsewhere (%)
Residents speaking Spanish at home - Foreign born (%)
Residents speaking other language at home (%)
Residents speaking other language at home - Born in the United States (%)
Residents speaking other language at home - Native, born elsewhere (%)
Residents speaking other language at home - Foreign born (%)
Marital status - Never married (%)
Marital status - Now married (%)
Marital status - Separated (%)
Marital status - Widowed (%)
Marital status - Divorced (%)
Ancestries Reported - Arab (%)
Ancestries Reported - Czech (%)
Ancestries Reported - Danish (%)
Ancestries Reported - Dutch (%)
Ancestries Reported - English (%)
Ancestries Reported - French (%)
Ancestries Reported - French Canadian (%)
Ancestries Reported - German (%)
Ancestries Reported - Greek (%)
Ancestries Reported - Hungarian (%)
Ancestries Reported - Irish (%)
Ancestries Reported - Italian (%)
Ancestries Reported - Lithuanian (%)
Ancestries Reported - Norwegian (%)
Ancestries Reported - Polish (%)
Ancestries Reported - Portuguese (%)
Ancestries Reported - Russian (%)
Ancestries Reported - Scotch-Irish (%)
Ancestries Reported - Scottish (%)
Ancestries Reported - Slovak (%)
Ancestries Reported - Subsaharan African (%)
Ancestries Reported - Swedish (%)
Ancestries Reported - Swiss (%)
Ancestries Reported - Ukrainian (%)
Ancestries Reported - United States (%)
Ancestries Reported - Welsh (%)
Ancestries Reported - West Indian (%)
Ancestries Reported - Other (%)
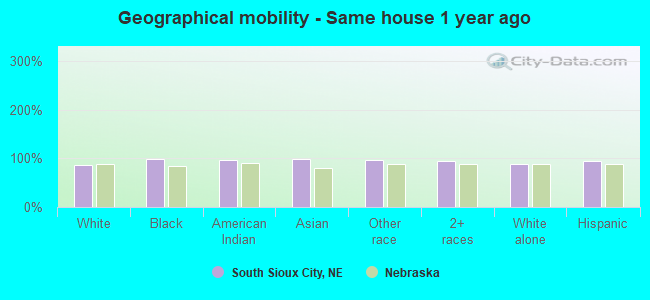
Geographical mobility - Same house 1 year ago (%)
Geographical mobility - Same house 1 year ago (%) - White
Geographical mobility - Same house 1 year ago (%) - Black or African American
Geographical mobility - Same house 1 year ago (%) - Asian
Geographical mobility - Same house 1 year ago (%) - Hispanic or Latino
Geographical mobility - Same house 1 year ago (%) - American Indian and Alaska Native
Geographical mobility - Same house 1 year ago (%) - Multirace
Geographical mobility - Same house 1 year ago (%) - Other Race
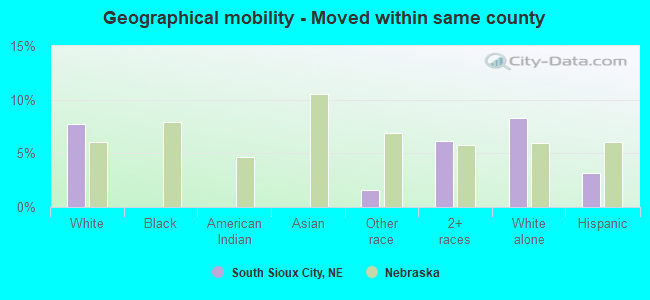
Geographical mobility - Moved within same county (%)
Geographical mobility - Moved within same county (%) - White
Geographical mobility - Moved within same county (%) - Black or African American
Geographical mobility - Moved within same county (%) - Asian
Geographical mobility - Moved within same county (%) - Hispanic or Latino
Geographical mobility - Moved within same county (%) - American Indian and Alaska Native
Geographical mobility - Moved within same county (%) - Multirace
Geographical mobility - Moved within same county (%) - Other Race
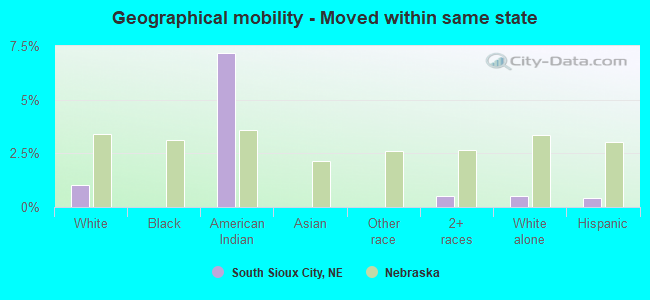
Geographical mobility - Moved from different county within same state (%)
Geographical mobility - Moved from different county within same state (%) - White
Geographical mobility - Moved from different county within same state (%) - Black or African American
Geographical mobility - Moved from different county within same state (%) - Asian
Geographical mobility - Moved from different county within same state (%) - Hispanic or Latino
Geographical mobility - Moved from different county within same state (%) - American Indian and Alaska Native
Geographical mobility - Moved from different county within same state (%) - Multirace
Geographical mobility - Moved from different county within same state (%) - Other Race
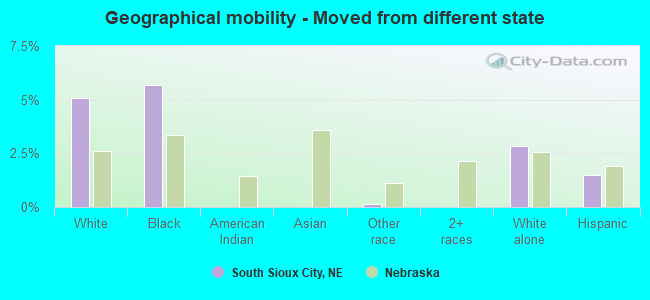
Geographical mobility - Moved from different state (%)
Geographical mobility - Moved from different state (%) - White
Geographical mobility - Moved from different state (%) - Black or African American
Geographical mobility - Moved from different state (%) - Asian
Geographical mobility - Moved from different state (%) - Hispanic or Latino
Geographical mobility - Moved from different state (%) - American Indian and Alaska Native
Geographical mobility - Moved from different state (%) - Multirace
Geographical mobility - Moved from different state (%) - Other Race
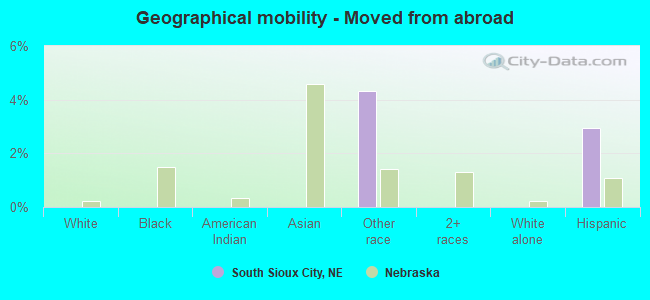
Geographical mobility - Moved from abroad (%)
Geographical mobility - Moved from abroad (%) - White
Geographical mobility - Moved from abroad (%) - Black or African American
Geographical mobility - Moved from abroad (%) - Asian
Geographical mobility - Moved from abroad (%) - Hispanic or Latino
Geographical mobility - Moved from abroad (%) - American Indian and Alaska Native
Geographical mobility - Moved from abroad (%) - Multirace
Geographical mobility - Moved from abroad (%) - Other Race
Place of birth for the foreign-born population - Ireland (%)
Place of birth for the foreign-born population - Denmark (%)
Place of birth for the foreign-born population - Norway (%)
Place of birth for the foreign-born population - Sweden (%)
Place of birth for the foreign-born population - United Kingdom (%)
Place of birth for the foreign-born population - England (%)
Place of birth for the foreign-born population - Scotland (%)
Place of birth for the foreign-born population - Other Northern Europe (%)
Place of birth for the foreign-born population - Austria (%)
Place of birth for the foreign-born population - Belgium (%)
Place of birth for the foreign-born population - France (%)
Place of birth for the foreign-born population - Germany (%)
Place of birth for the foreign-born population - Netherlands (%)
Place of birth for the foreign-born population - Switzerland (%)
Place of birth for the foreign-born population - Other Western Europe (%)
Place of birth for the foreign-born population - Greece (%)
Place of birth for the foreign-born population - Italy (%)
Place of birth for the foreign-born population - Portugal (%)
Place of birth for the foreign-born population - Spain (%)
Place of birth for the foreign-born population - Other Southern Europe (%)
Place of birth for the foreign-born population - Albania (%)
Place of birth for the foreign-born population - Belarus (%)
Place of birth for the foreign-born population - Bosnia and Herzegovina (%)
Place of birth for the foreign-born population - Bulgaria (%)
Place of birth for the foreign-born population - Croatia (%)
Place of birth for the foreign-born population - Czechoslovakia (%)
Place of birth for the foreign-born population - Hungary (%)
Place of birth for the foreign-born population - Latvia (%)
Place of birth for the foreign-born population - Lithuania (%)
Place of birth for the foreign-born population - North Macedonia (Macedonia) (%)
Place of birth for the foreign-born population - Moldova (%)
Place of birth for the foreign-born population - Poland (%)
Place of birth for the foreign-born population - Romania (%)
Place of birth for the foreign-born population - Russia (%)
Place of birth for the foreign-born population - Serbia (%)
Place of birth for the foreign-born population - Ukraine (%)
Place of birth for the foreign-born population - Other Eastern Europe (%)
Place of birth for the foreign-born population - China (%)
Place of birth for the foreign-born population - Hong Kong (%)
Place of birth for the foreign-born population - Taiwan (%)
Place of birth for the foreign-born population - Japan (%)
Place of birth for the foreign-born population - Korea (%)
Place of birth for the foreign-born population - Other Eastern Asia (%)
Place of birth for the foreign-born population - Afghanistan (%)
Place of birth for the foreign-born population - Bangladesh (%)
Place of birth for the foreign-born population - India (%)
Place of birth for the foreign-born population - Iran (%)
Place of birth for the foreign-born population - Kazakhstan (%)
Place of birth for the foreign-born population - Nepal (%)
Place of birth for the foreign-born population - Pakistan (%)
Place of birth for the foreign-born population - Sri Lanka (%)
Place of birth for the foreign-born population - Uzbekistan (%)
Place of birth for the foreign-born population - Other South Central Asia (%)
Place of birth for the foreign-born population - Burma (%)
Place of birth for the foreign-born population - Cambodia (%)
Place of birth for the foreign-born population - Indonesia (%)
Place of birth for the foreign-born population - Laos (%)
Place of birth for the foreign-born population - Malaysia (%)
Place of birth for the foreign-born population - Philippines (%)
Place of birth for the foreign-born population - Singapore (%)
Place of birth for the foreign-born population - Thailand (%)
Place of birth for the foreign-born population - Vietnam (%)
Place of birth for the foreign-born population - Other South Eastern Asia (%)
Place of birth for the foreign-born population - Armenia (%)
Place of birth for the foreign-born population - Iraq (%)
Place of birth for the foreign-born population - Israel (%)
Place of birth for the foreign-born population - Jordan (%)
Place of birth for the foreign-born population - Kuwait (%)
Place of birth for the foreign-born population - Lebanon (%)
Place of birth for the foreign-born population - Saudi Arabia (%)
Place of birth for the foreign-born population - Syria (%)
Place of birth for the foreign-born population - Turkey (%)
Place of birth for the foreign-born population - Yemen (%)
Place of birth for the foreign-born population - Other Western Asia (%)
Place of birth for the foreign-born population - Eritrea (%)
Place of birth for the foreign-born population - Ethiopia (%)
Place of birth for the foreign-born population - Kenya (%)
Place of birth for the foreign-born population - Somalia (%)
Place of birth for the foreign-born population - Uganda (%)
Place of birth for the foreign-born population - Zimbabwe (%)
Place of birth for the foreign-born population - Other Eastern Africa (%)
Place of birth for the foreign-born population - Cameroon (%)
Place of birth for the foreign-born population - Congo (%)
Place of birth for the foreign-born population - Democratic Republic of Congo (Zaire) (%)
Place of birth for the foreign-born population - Other Middle Africa (%)
Place of birth for the foreign-born population - Egypt (%)
Place of birth for the foreign-born population - Morocco (%)
Place of birth for the foreign-born population - Sudan (%)
Place of birth for the foreign-born population - Other Northern Africa (%)
Place of birth for the foreign-born population - South Africa (%)
Place of birth for the foreign-born population - Other Southern Africa (%)
Place of birth for the foreign-born population - Cabo Verde (%)
Place of birth for the foreign-born population - Ghana (%)
Place of birth for the foreign-born population - Liberia (%)
Place of birth for the foreign-born population - Nigeria (%)
Place of birth for the foreign-born population - Senegal (%)
Place of birth for the foreign-born population - Sierra Leone (%)
Place of birth for the foreign-born population - Other Western Africa (%)
Place of birth for the foreign-born population - Australia (%)
Place of birth for the foreign-born population - New Zealand (%)
Place of birth for the foreign-born population - Fiji (%)
Place of birth for the foreign-born population - Micronesia (%)
Place of birth for the foreign-born population - Bahamas (%)
Place of birth for the foreign-born population - Barbados (%)
Place of birth for the foreign-born population - Cuba (%)
Place of birth for the foreign-born population - Dominica (%)
Place of birth for the foreign-born population - Dominican Republic (%)
Place of birth for the foreign-born population - Grenada (%)
Place of birth for the foreign-born population - Haiti (%)
Place of birth for the foreign-born population - Jamaica (%)
Place of birth for the foreign-born population - St. Vincent and the Grenadines (%)
Place of birth for the foreign-born population - Trinidad and Tobago (%)
Place of birth for the foreign-born population - West Indies (%)
Place of birth for the foreign-born population - Other Caribbean (%)
Place of birth for the foreign-born population - Belize (%)
Place of birth for the foreign-born population - Costa Rica (%)
Place of birth for the foreign-born population - El Salvador (%)
Place of birth for the foreign-born population - Guatemala (%)
Place of birth for the foreign-born population - Honduras (%)
Place of birth for the foreign-born population - Mexico (%)
Place of birth for the foreign-born population - Nicaragua (%)
Place of birth for the foreign-born population - Panama (%)
Place of birth for the foreign-born population - Other Central America (%)
Place of birth for the foreign-born population - Argentina (%)
Place of birth for the foreign-born population - Bolivia (%)
Place of birth for the foreign-born population - Brazil (%)
Place of birth for the foreign-born population - Chile (%)
Place of birth for the foreign-born population - Colombia (%)
Place of birth for the foreign-born population - Ecuador (%)
Place of birth for the foreign-born population - Guyana (%)
Place of birth for the foreign-born population - Peru (%)
Place of birth for the foreign-born population - Uruguay (%)
Place of birth for the foreign-born population - Venezuela (%)
Place of birth for the foreign-born population - Other South America (%)
Place of birth for the foreign-born population - Canada (%)
Place of birth for the foreign-born population - Other Northern America (%)
Place of birth for the foreign-born population - Other (%)
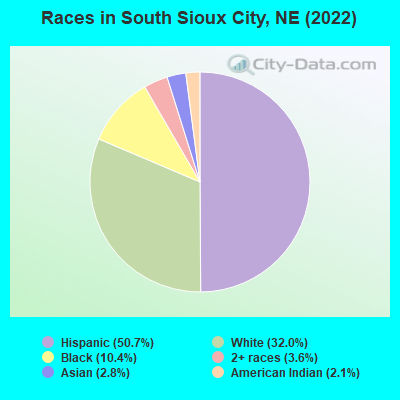
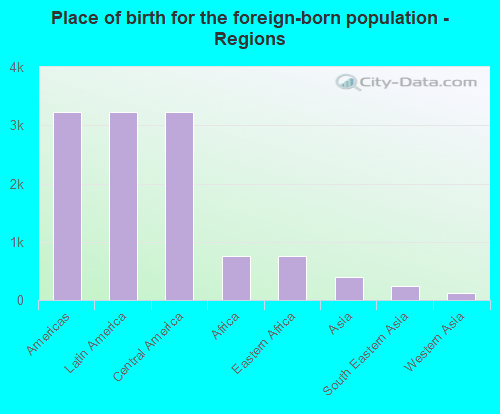
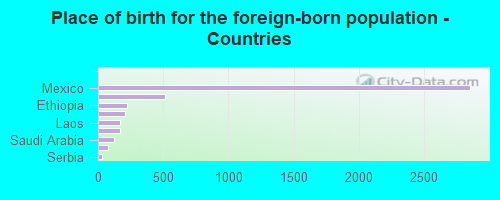
According to 2022 data, the most numerous races in South Sioux City, NE are White alone (4,449 residents), Hispanic (7,050 residents), and Black alone (1,442 residents). 47.9% of South Sioux City residents speak English at home. 31.7% of South Sioux City, NE residents are foreign-born (22.9% born in Latin America, 5.3% born in Africa), which is 77.9% greater than the foreign-born rate of 7.0% across the entire state of Nebraska.
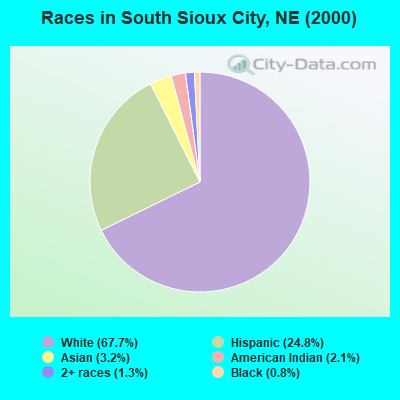
Race distribution in South Sioux City
2000 2022
1,494,494 87.3% White alone 94,425 5.5% Hispanic 67,537 3.9% Black alone 21,677 1.3% Asian alone 17,696 1.0% Two or more races 13,460 0.8% American Indian alone 1,327 0.08% Other race alone 647 0.04% Native Hawaiian and Other
1,492,005 75.8% White alone 241,898 12.3% Hispanic 89,520 4.5% Black alone 76,499 3.9% Two or more races 49,261 2.5% Asian alone 10,249 0.5% American Indian alone 7,425 0.4% Other race alone 1,066 0.05% Native Hawaiian and Other
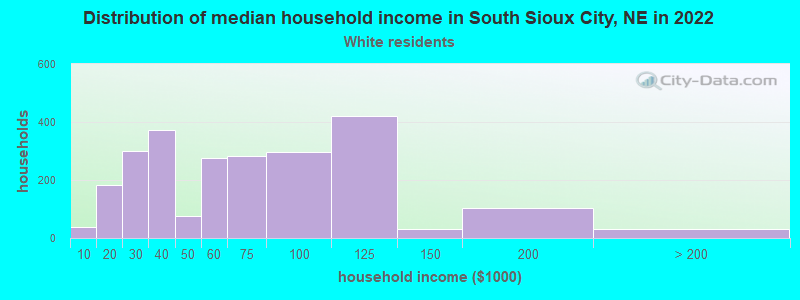
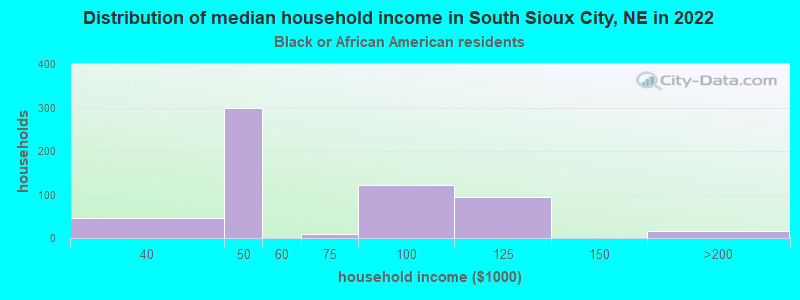
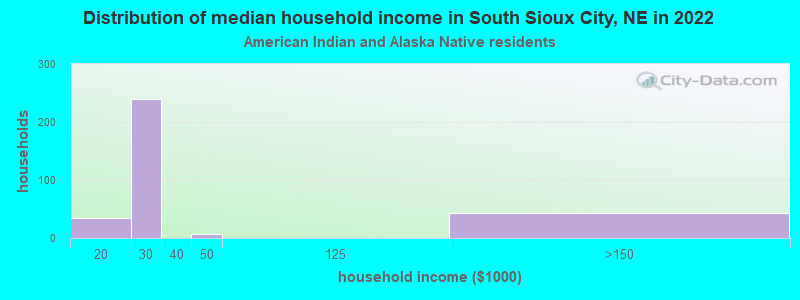
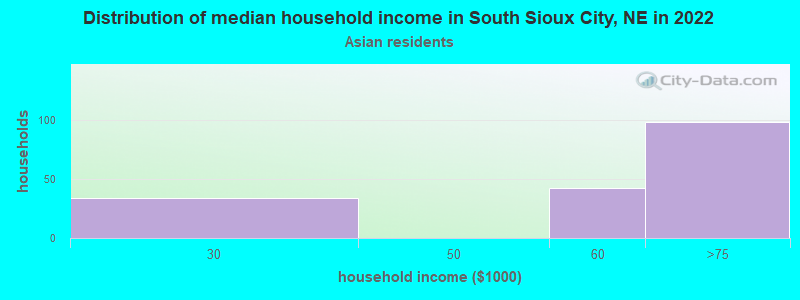
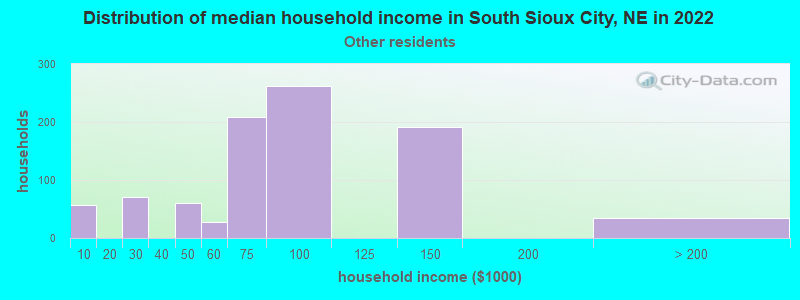
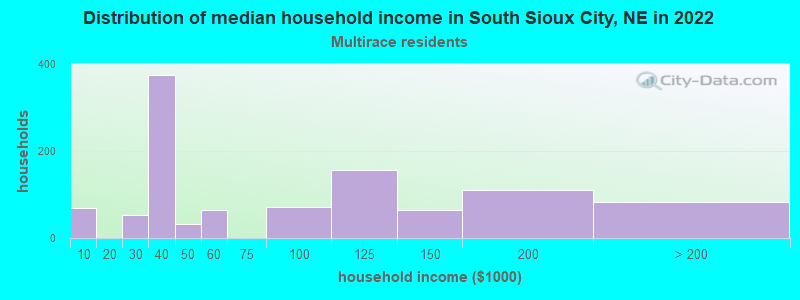
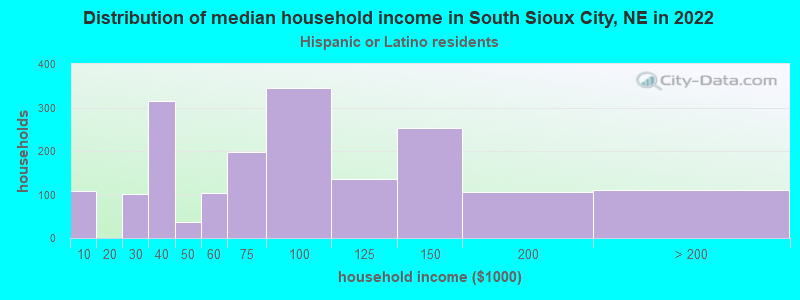
Income and house value in South Sioux City Median household income in 2022 $57,208 White non-Hispanic householders$27,788 American Indian and Alaska Native householders$58,407 Asian householders$82,979 Some other race householders$75,007 Hispanic or Latino race householdersMedian 2022 house value $181,689 White Non-Hispanic householders$165,294 American Indian or Alaska Native householders $196,511 Asian householders$158,781 Some other race householders$168,438 Two or more races householders$161,700 Hispanic or Latino householders
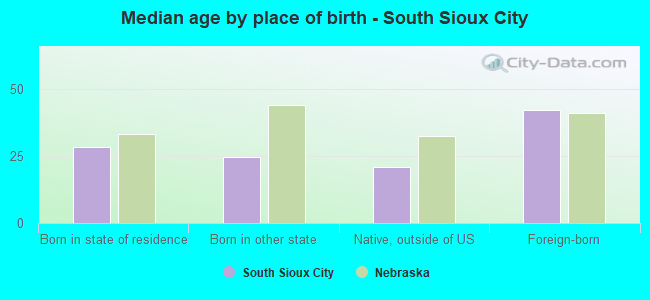
Median age by race in South Sioux City
46.5 Median age for White residents42.4 53.4 28.7 Median age for Black or African American residents29.6 28.0 53.3 Median age for American Indian / Alaska Native residents-693,928,128.2 46.4 42.3 Median age for Asian residents-708,061,001.5 41.7 -699,999,999.3 Median age for Native Hawaiian / Pacific Islander residents-672,108,842.9 -689,223,057.0 25.0 Median age for Other race residents24.5 26.1 24.7 Median age for Two or more races residents29.1 17.8 52.1 Median age for White alone residents46.1 58.2 24.0 Median age for Hispanic or Latino residents23.8 20.8
Owner/renter occupied households by race in South Sioux City
House owners and renters - White residents 1,448 59.9% Owner occupied969 40.1% Renter occupiedHouse owners and renters - Black or African American residents 26 4.8% Owner occupied512 95.2% Renter occupiedHouse owners and renters - American Indian / Alaska Native residents 86 27.7% Owner occupied223 72.3% Renter occupiedHouse owners and renters - Asian residents 198 100.0% Owner occupiedHouse owners and renters - Other race residents 712 74.6% Owner occupied243 25.4% Renter occupiedHouse owners and renters - Two or more races residents 729 69.8% Owner occupied315 30.2% Renter occupiedHouse owners and renters - White alone residents 1,407 63.8% Owner occupied799 36.2% Renter occupiedHouse owners and renters - Hispanic or Latino residents 1,138 63.5% Owner occupied654 36.5% Renter occupied
Language usage in South Sioux City
English speakers - Total 47.9% of residents of South Sioux City speak English at home.
37.8% of residents speak Spanish at home 2,202 45.3% Speak English very well2,663 54.7% Speak English less than very well12.3% of residents speak other language at home 763 48.3% Speak English very well818 51.7% Speak English less than very well
English speakers - Born in the United States 69.3% of residents of South Sioux City speak English at home.
22.6% of residents speak Spanish at home 1,145 79.6% Speak English very well294 20.4% Speak English less than very well5.7% of residents speak other language at home 332 91.2% Speak English very well32 8.8% Speak English less than very well
English speakers - Native, born elsewhere 9.1% of residents of South Sioux City speak English at home.
60.3% of residents speak Spanish at home 186 88.2% Speak English very well25 11.8% Speak English less than very well40.0% of residents speak other language at home 102 72.9% Speak English very well38 27.1% Speak English less than very well
English speakers - Foreign-born 5.4% of residents of South Sioux City speak English at home.
68.2% of residents speak Spanish at home 611 21.8% Speak English very well2,196 78.2% Speak English less than very well26.3% of residents speak other language at home 355 32.7% Speak English very well729 67.3% Speak English less than very well
White (Caucasian) - Speak another language Native:
7.4% (352)Foreign-born:
91.1% (189)
Black or African American - Speak another language Native:
81.3% (395)Foreign-born:
94.2% (759)
American Indian / Alaska Native - Speak another language Native:
45.4% (164)Foreign-born:
100.0% (8)
Asian - Speak another language Native:
55.0% (96)Foreign-born:
100.0% (230)
Other race - Speak only English Native:
30.9% (536)Foreign-born:
4.9% (121)
Other race - Speak another language Native:
64.2% (1,114)Foreign-born:
95.3% (2,346)
Two or more races - Speak only English Native:
52.6% (1,023)Foreign-born:
9.5% (98)
Two or more races - Speak another language Native:
46.4% (902)Foreign-born:
86.6% (895)
Hispanic or Latino - Speak only English Native:
30.5% (1,013)Foreign-born:
6.7% (205)
Hispanic or Latino - Speak another language Native:
61.7% (2,048)Foreign-born:
92.8% (2,826)
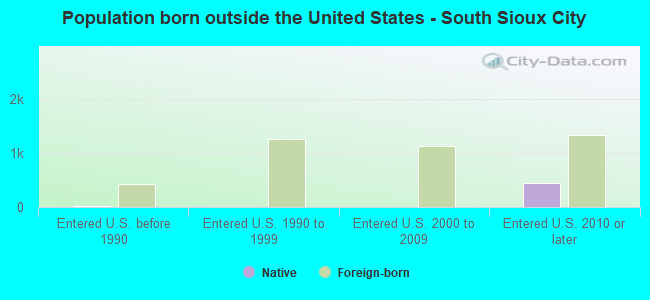
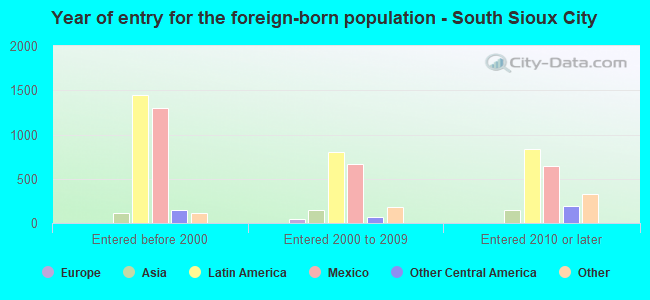
Foreign-born residents in South Sioux City 4,405 residents are foreign born (22.9% Latin America , 5.3% Africa ).
This city:
31.7%Nebraska:
7.5%
Marital status for residents in South Sioux City Marital status - White (Caucasian) population 15 years and over
Males 32.5% Never married44.3% Now married0.0% Separated6.4% Widowed16.8% DivorcedFemales 20.8% Never married45.2% Now married0.0% Separated17.2% Widowed16.8% DivorcedWomen who gave birth in the past 12 months Now married:
30.5% (28)Unmarried:
69.5% (64)
Women who did not give birth in the past 12 months Now married:
46.5% (395)Unmarried:
53.5% (455)
Marital status - Black or African American population 15 years and over
Males 21.4% Never married78.6% Now married0.0% Separated0.0% Widowed0.0% DivorcedFemales 8.5% Never married91.5% Now married0.0% Separated0.0% Widowed0.0% DivorcedWomen who did not give birth in the past 12 months Now married:
91.5% (472)Unmarried:
8.5% (44)
Marital status - American Indian / Alaska Native population 15 years and over
Males 0.0% Never married0.0% Now married0.0% Separated0.0% Widowed100.0% DivorcedFemales 26.0% Never married71.8% Now married0.0% Separated0.0% Widowed2.3% DivorcedWomen who did not give birth in the past 12 months Now married:
0.0% (0)Unmarried:
100.0% (56)
Marital status - Asian population 15 years and over
Males 37.4% Never married62.6% Now married0.0% Separated0.0% Widowed0.0% DivorcedFemales 0.0% Never married65.1% Now married0.0% Separated34.9% Widowed0.0% DivorcedWomen who did not give birth in the past 12 months Now married:
100.0% (118)Unmarried:
0.0% (0)
Marital status - Other race population 15 years and over
Males 33.6% Never married50.5% Now married0.0% Separated0.0% Widowed15.9% DivorcedFemales 40.4% Never married51.3% Now married0.6% Separated0.0% Widowed7.7% DivorcedWomen who gave birth in the past 12 months Now married:
100.0% (82)Unmarried:
0.0% (0)
Women who did not give birth in the past 12 months Now married:
46.8% (501)Unmarried:
53.2% (569)
Marital status - Two or more races population 15 years and over
Males 43.3% Never married32.4% Now married6.4% Separated0.0% Widowed17.9% DivorcedFemales 48.4% Never married40.4% Now married0.0% Separated9.8% Widowed1.5% DivorcedWomen who did not give birth in the past 12 months Now married:
43.6% (391)Unmarried:
56.4% (506)
Marital status - White alone, not Hispanic / Latino population 15 years and over
Males 29.6% Never married45.1% Now married0.0% Separated7.1% Widowed18.2% DivorcedFemales 17.7% Never married45.4% Now married0.0% Separated20.4% Widowed16.6% DivorcedWomen who gave birth in the past 12 months Now married:
30.5% (29)Unmarried:
69.5% (66)
Women who did not give birth in the past 12 months Now married:
46.2% (285)Unmarried:
53.8% (332)
Marital status - Hispanic or Latino population 15 years and over
Males 39.4% Never married43.5% Now married2.2% Separated0.3% Widowed14.7% DivorcedFemales 41.0% Never married48.6% Now married0.3% Separated2.1% Widowed8.0% DivorcedWomen who gave birth in the past 12 months Now married:
100.0% (72)Unmarried:
0.0% (0)
Women who did not give birth in the past 12 months Now married:
47.3% (827)Unmarried:
52.7% (921)
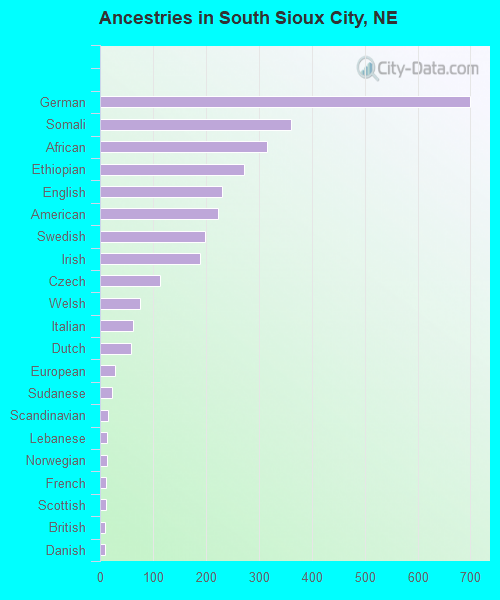
Ancestries in South Sioux City
700 7.4% German360 3.8% Somali316 3.3% African273 2.9% Ethiopian231 2.4% English223 2.4% American199 2.1% Swedish189 2.0% Irish114 1.2% Czech76 0.8% Welsh63 0.7% Italian59 0.6% Dutch28 0.3% European23 0.2% Sudanese15 0.2% Scandinavian13 0.1% Lebanese13 0.1% Norwegian11 0.1% French11 0.1% Scottish10 0.1% British9 0.10% Danish5 0.05% Polish
Geographical mobility in South Sioux City Same house 1 year ago 4,528 86.3% White (Caucasian)1,554 98.5% Black or African American415 96.3% American Indian / Alaska Native383 97.7% Asian4,493 97.1% Other race3,051 94.6% Two or more races3,888 88.0% White alone, not Hispanic / Latino6,681 94.9% Hispanic or LatinoMoved within same county 406 7.7% White / Caucasian1 0.0% Black or African American72 1.6% Other race198 6.1% Two or more races368 8.3% White alone, not Hispanic / Latino224 3.2% Hispanic or LatinoMoved within same state 54 1.0% White / Caucasian31 7.2% American Indian / Alaska Native17 0.5% Two or more races23 0.5% White alone, not Hispanic / Latino29 0.4% Hispanic or LatinoMoved from different state 266 5.1% White / Caucasian90 5.7% Black or African American7 0.2% Other race125 2.8% White alone, not Hispanic / Latino105 1.5% Hispanic or LatinoMoved from abroad 201 4.3% Other race207 2.9% Hispanic or Latino
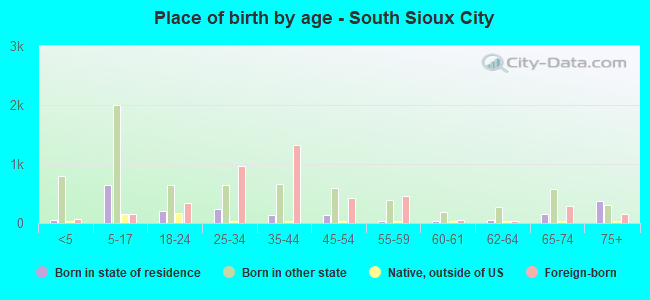
Children Nativity (place of birth) in South Sioux City
Children under 6 years - Living with two parents Both parents native 185 100.0% NativeBoth parents foreign-born 466 95.3% Native23 4.7% Foreign-bornOne native, one foreign-born parent 191 100.0% NativeChildren under 6 years - Living with one parent Native parent 108 100.0% NativeForeign-born parent 11 16.0% Native57 84.0% Foreign-bornChildren 6 to 17 years - Living with two parents Both parents native 160 99.6% Native1 0.4% Foreign-bornBoth parents foreign-born 1,571 95.2% Native79 4.8% Foreign-bornOne native, one foreign-born parent 339 100.0% NativeChildren 6 to 17 years - Living with one parent Native parent 423 88.6% Native55 11.4% Foreign-bornForeign-born parent 105 84.1% Native20 15.9% Foreign-born