Races in South Marshall, Oklahoma (OK) Detailed Stats
Ancestries, Foreign-born residents, place of birth
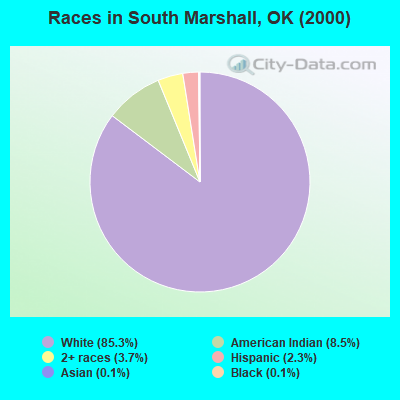
Race distribution in South Marshall

- 5,05285.3%White alone
- 5018.5%American Indian alone
- 2223.7%Two or more races
- 1342.3%Hispanic
- 60.1%Black alone
- 80.1%Asian alone
2000
2022
-
- 2,556,36874.1%White alone
- 266,1587.7%American Indian alone
- 257,9817.5%Black alone
- 179,3045.2%Hispanic
- 140,2494.1%Two or more races
- 46,1721.3%Asian alone
- 2,3220.07%Other race alone
- 2,1000.06%Native Hawaiian and Other
Pacific Islander alone

-
- 2,517,40362.6%White alone
- 486,69212.1%Hispanic
- 364,4539.1%Two or more races
- 273,6506.8%American Indian alone
- 268,5436.7%Black alone
- 92,6722.3%Asian alone
- 10,7860.3%Other race alone
- 5,6010.1%Native Hawaiian and Other
Pacific Islander alone

Income and house value in South Marshall
- Median household income in 2022
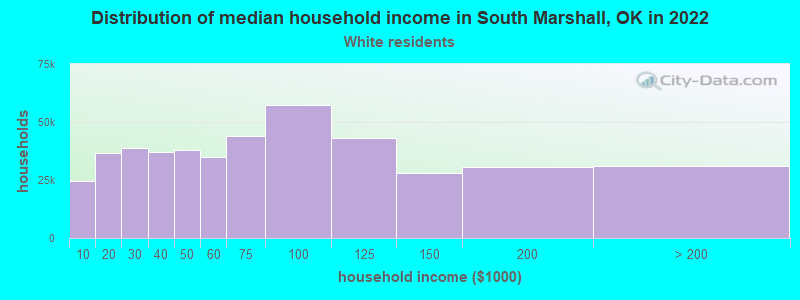
- $52,340White non-Hispanic householders
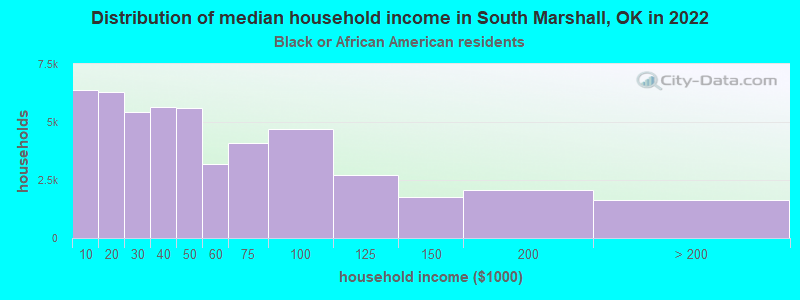
- $48,315Black householders
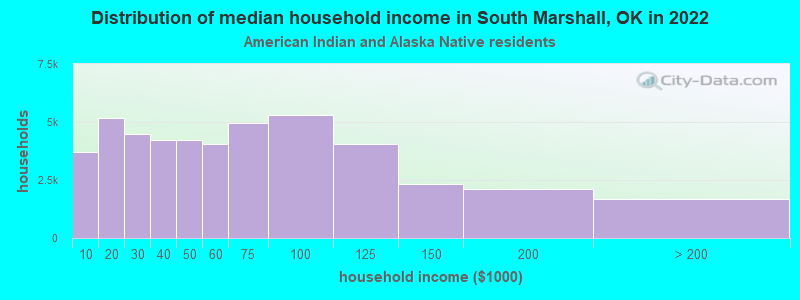
- $49,630American Indian and Alaska Native householders
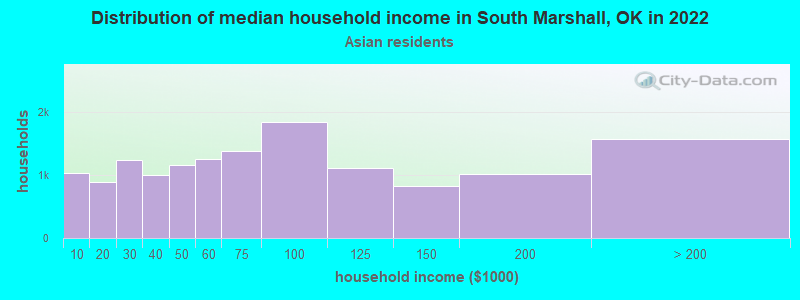
- $45,384Asian householders
- $51,101Some other race householders
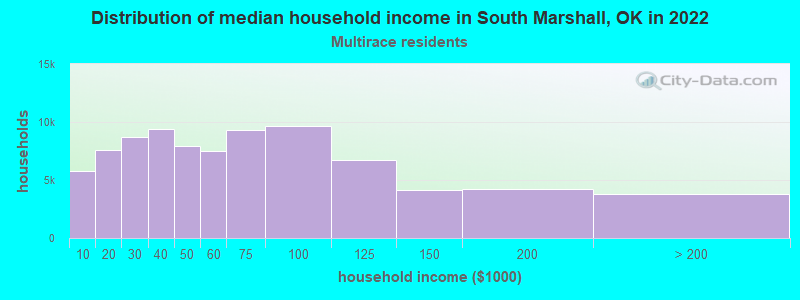
- $51,835Two or more races householders
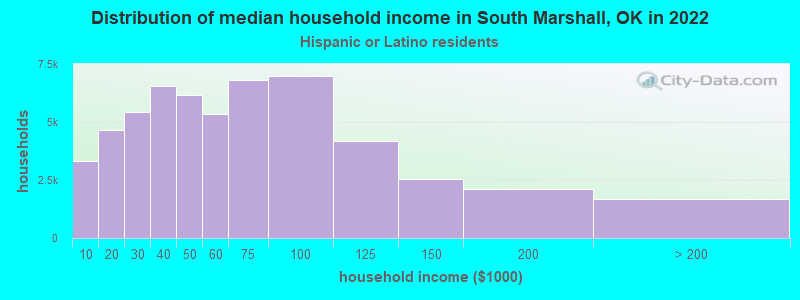
- $52,150Hispanic or Latino race householders
- Median 2022 house value
- $183,046White Non-Hispanic householders
- $158,453American Indian or Alaska Native householders
- $186,781Some other race householders
- $140,086Two or more races householders
- $178,999Hispanic or Latino householders
Household income for White non-Hispanic householders
Household income for Black householders
Household income for American Indian and Alaska Native householders
Household income for Asian householders
Household income for Two or more races householders
Household income for Hispanic or Latino race householders
Zip code: 73439