Races in Smithfield, Utah (UT) Detailed Stats
Data:
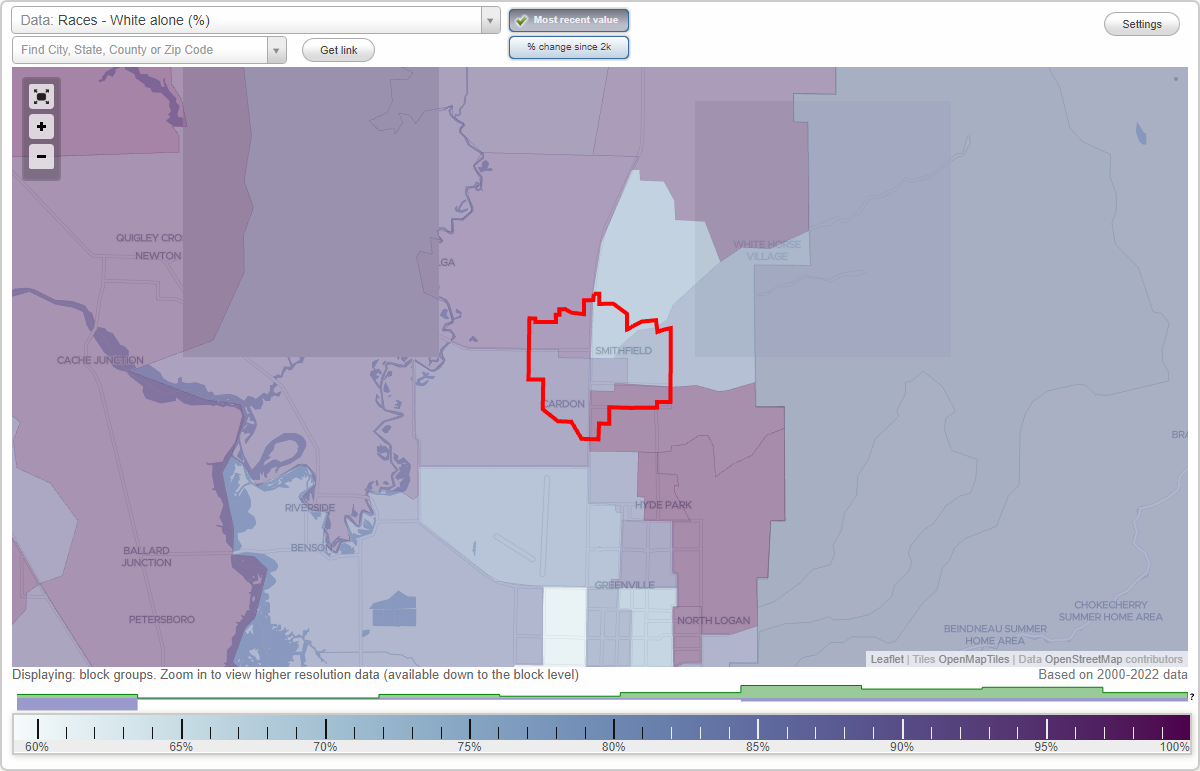
Races - White alone (%)
Races - White alone (% change since 2000)
Races - Black alone (%)
Races - Black alone (% change since 2000)
Races - American Indian alone (%)
Races - American Indian alone (% change since 2000)
Races - Asian alone (%)
Races - Asian alone (% change since 2000)
Races - Hispanic (%)
Races - Hispanic (% change since 2000)
Races - Native Hawaiian and Other Pacific Islander alone (%)
Races - Native Hawaiian and Other Pacific Islander alone (% change since 2000)
Races - Two or more races(%)
Races - Two or more races(% change since 2000)
Races - Other race alone (%)
Races - Other race alone (% change since 2000)
Racial diversity
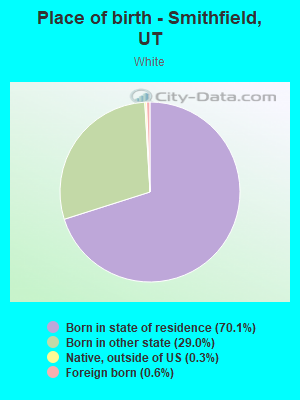
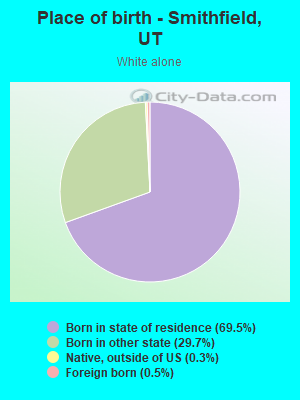
Place of birth - Born in state of residence (%)
Place of birth - Born in state of residence (%) - White
Place of birth - Born in state of residence (%) - Black or African American
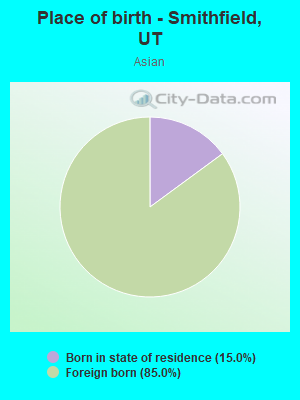
Place of birth - Born in state of residence (%) - Asian
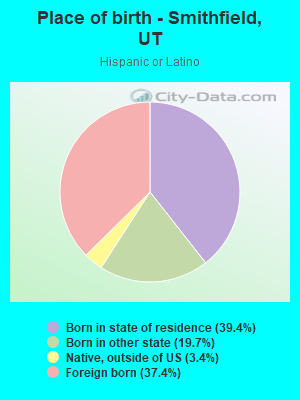
Place of birth - Born in state of residence (%) - Hispanic or Latino
Place of birth - Born in state of residence (%) - American Indian and Alaska Native
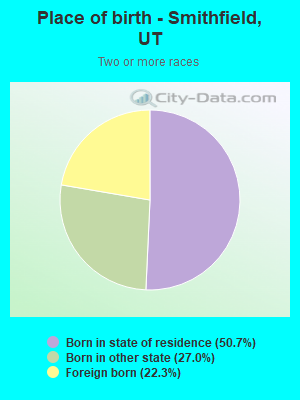
Place of birth - Born in state of residence (%) - Multirace
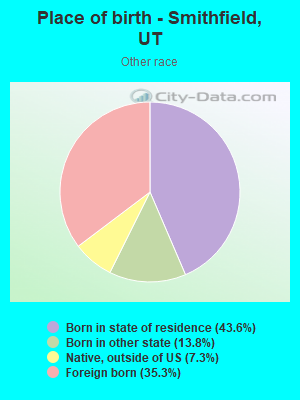
Place of birth - Born in state of residence (%) - Other Race
Place of birth - Born in other state (%)
Place of birth - Born in other state (%) - White
Place of birth - Born in other state (%) - Black or African American
Place of birth - Born in other state (%) - Asian
Place of birth - Born in other state (%) - Hispanic or Latino
Place of birth - Born in other state (%) - American Indian and Alaska Native
Place of birth - Born in other state (%) - Multirace
Place of birth - Born in other state (%) - Other Race
Place of birth - Native, outside of US (%)
Place of birth - Native, outside of US (%) - White
Place of birth - Native, outside of US (%) - Black or African American
Place of birth - Native, outside of US (%) - Asian
Place of birth - Native, outside of US (%) - Hispanic or Latino
Place of birth - Native, outside of US (%) - American Indian and Alaska Native
Place of birth - Native, outside of US (%) - Multirace
Place of birth - Native, outside of US (%) - Other Race
Place of birth - Foreign born (%)
Place of birth - Foreign born (%) - White
Place of birth - Foreign born (%) - Black or African American
Place of birth - Foreign born (%) - Asian
Place of birth - Foreign born (%) - Hispanic or Latino
Place of birth - Foreign born (%) - American Indian and Alaska Native
Place of birth - Foreign born (%) - Multirace
Place of birth - Foreign born (%) - Other Race
Residents speaking English at home (%)
Residents speaking English at home - Born in the United States (%)
Residents speaking English at home - Native, born elsewhere (%)
Residents speaking English at home - Foreign born (%)
Residents speaking Spanish at home (%)
Residents speaking Spanish at home - Born in the United States (%)
Residents speaking Spanish at home - Native, born elsewhere (%)
Residents speaking Spanish at home - Foreign born (%)
Residents speaking other language at home (%)
Residents speaking other language at home - Born in the United States (%)
Residents speaking other language at home - Native, born elsewhere (%)
Residents speaking other language at home - Foreign born (%)
Marital status - Never married (%)
Marital status - Now married (%)
Marital status - Separated (%)
Marital status - Widowed (%)
Marital status - Divorced (%)
Ancestries Reported - Arab (%)
Ancestries Reported - Czech (%)
Ancestries Reported - Danish (%)
Ancestries Reported - Dutch (%)
Ancestries Reported - English (%)
Ancestries Reported - French (%)
Ancestries Reported - French Canadian (%)
Ancestries Reported - German (%)
Ancestries Reported - Greek (%)
Ancestries Reported - Hungarian (%)
Ancestries Reported - Irish (%)
Ancestries Reported - Italian (%)
Ancestries Reported - Lithuanian (%)
Ancestries Reported - Norwegian (%)
Ancestries Reported - Polish (%)
Ancestries Reported - Portuguese (%)
Ancestries Reported - Russian (%)
Ancestries Reported - Scotch-Irish (%)
Ancestries Reported - Scottish (%)
Ancestries Reported - Slovak (%)
Ancestries Reported - Subsaharan African (%)
Ancestries Reported - Swedish (%)
Ancestries Reported - Swiss (%)
Ancestries Reported - Ukrainian (%)
Ancestries Reported - United States (%)
Ancestries Reported - Welsh (%)
Ancestries Reported - West Indian (%)
Ancestries Reported - Other (%)
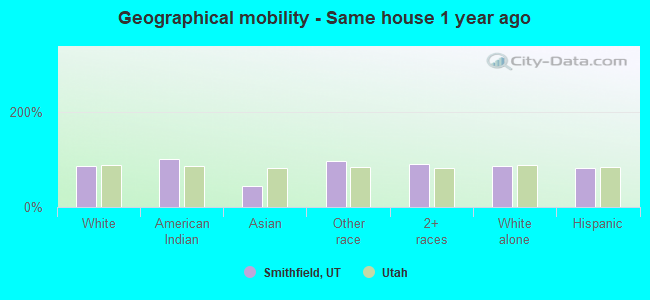
Geographical mobility - Same house 1 year ago (%)
Geographical mobility - Same house 1 year ago (%) - White
Geographical mobility - Same house 1 year ago (%) - Black or African American
Geographical mobility - Same house 1 year ago (%) - Asian
Geographical mobility - Same house 1 year ago (%) - Hispanic or Latino
Geographical mobility - Same house 1 year ago (%) - American Indian and Alaska Native
Geographical mobility - Same house 1 year ago (%) - Multirace
Geographical mobility - Same house 1 year ago (%) - Other Race
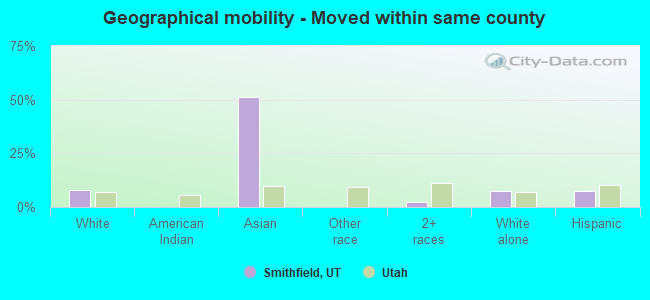
Geographical mobility - Moved within same county (%)
Geographical mobility - Moved within same county (%) - White
Geographical mobility - Moved within same county (%) - Black or African American
Geographical mobility - Moved within same county (%) - Asian
Geographical mobility - Moved within same county (%) - Hispanic or Latino
Geographical mobility - Moved within same county (%) - American Indian and Alaska Native
Geographical mobility - Moved within same county (%) - Multirace
Geographical mobility - Moved within same county (%) - Other Race
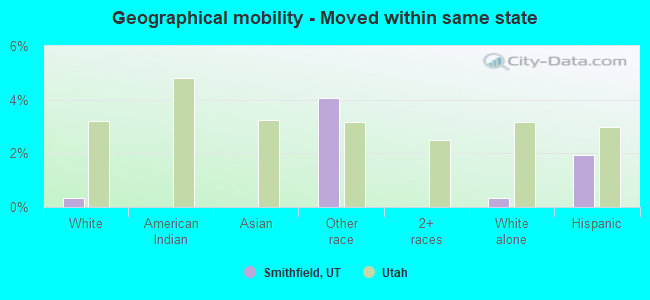
Geographical mobility - Moved from different county within same state (%)
Geographical mobility - Moved from different county within same state (%) - White
Geographical mobility - Moved from different county within same state (%) - Black or African American
Geographical mobility - Moved from different county within same state (%) - Asian
Geographical mobility - Moved from different county within same state (%) - Hispanic or Latino
Geographical mobility - Moved from different county within same state (%) - American Indian and Alaska Native
Geographical mobility - Moved from different county within same state (%) - Multirace
Geographical mobility - Moved from different county within same state (%) - Other Race
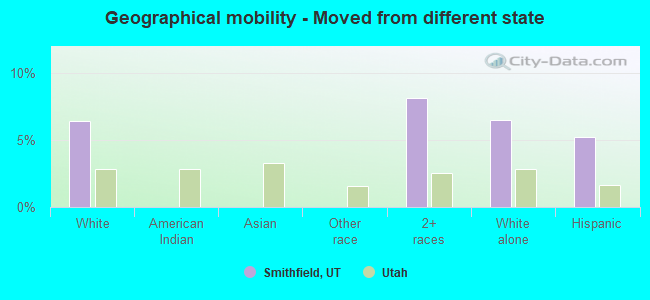
Geographical mobility - Moved from different state (%)
Geographical mobility - Moved from different state (%) - White
Geographical mobility - Moved from different state (%) - Black or African American
Geographical mobility - Moved from different state (%) - Asian
Geographical mobility - Moved from different state (%) - Hispanic or Latino
Geographical mobility - Moved from different state (%) - American Indian and Alaska Native
Geographical mobility - Moved from different state (%) - Multirace
Geographical mobility - Moved from different state (%) - Other Race
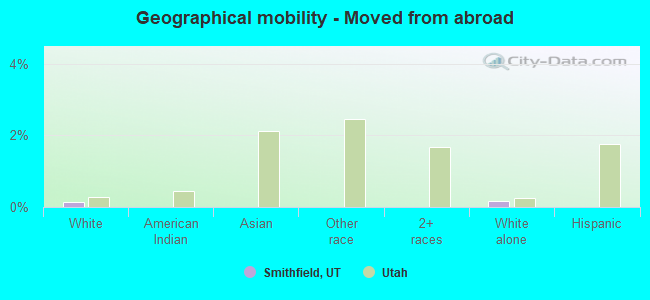
Geographical mobility - Moved from abroad (%)
Geographical mobility - Moved from abroad (%) - White
Geographical mobility - Moved from abroad (%) - Black or African American
Geographical mobility - Moved from abroad (%) - Asian
Geographical mobility - Moved from abroad (%) - Hispanic or Latino
Geographical mobility - Moved from abroad (%) - American Indian and Alaska Native
Geographical mobility - Moved from abroad (%) - Multirace
Geographical mobility - Moved from abroad (%) - Other Race
Place of birth for the foreign-born population - Ireland (%)
Place of birth for the foreign-born population - Denmark (%)
Place of birth for the foreign-born population - Norway (%)
Place of birth for the foreign-born population - Sweden (%)
Place of birth for the foreign-born population - United Kingdom (%)
Place of birth for the foreign-born population - England (%)
Place of birth for the foreign-born population - Scotland (%)
Place of birth for the foreign-born population - Other Northern Europe (%)
Place of birth for the foreign-born population - Austria (%)
Place of birth for the foreign-born population - Belgium (%)
Place of birth for the foreign-born population - France (%)
Place of birth for the foreign-born population - Germany (%)
Place of birth for the foreign-born population - Netherlands (%)
Place of birth for the foreign-born population - Switzerland (%)
Place of birth for the foreign-born population - Other Western Europe (%)
Place of birth for the foreign-born population - Greece (%)
Place of birth for the foreign-born population - Italy (%)
Place of birth for the foreign-born population - Portugal (%)
Place of birth for the foreign-born population - Spain (%)
Place of birth for the foreign-born population - Other Southern Europe (%)
Place of birth for the foreign-born population - Albania (%)
Place of birth for the foreign-born population - Belarus (%)
Place of birth for the foreign-born population - Bosnia and Herzegovina (%)
Place of birth for the foreign-born population - Bulgaria (%)
Place of birth for the foreign-born population - Croatia (%)
Place of birth for the foreign-born population - Czechoslovakia (%)
Place of birth for the foreign-born population - Hungary (%)
Place of birth for the foreign-born population - Latvia (%)
Place of birth for the foreign-born population - Lithuania (%)
Place of birth for the foreign-born population - North Macedonia (Macedonia) (%)
Place of birth for the foreign-born population - Moldova (%)
Place of birth for the foreign-born population - Poland (%)
Place of birth for the foreign-born population - Romania (%)
Place of birth for the foreign-born population - Russia (%)
Place of birth for the foreign-born population - Serbia (%)
Place of birth for the foreign-born population - Ukraine (%)
Place of birth for the foreign-born population - Other Eastern Europe (%)
Place of birth for the foreign-born population - China (%)
Place of birth for the foreign-born population - Hong Kong (%)
Place of birth for the foreign-born population - Taiwan (%)
Place of birth for the foreign-born population - Japan (%)
Place of birth for the foreign-born population - Korea (%)
Place of birth for the foreign-born population - Other Eastern Asia (%)
Place of birth for the foreign-born population - Afghanistan (%)
Place of birth for the foreign-born population - Bangladesh (%)
Place of birth for the foreign-born population - India (%)
Place of birth for the foreign-born population - Iran (%)
Place of birth for the foreign-born population - Kazakhstan (%)
Place of birth for the foreign-born population - Nepal (%)
Place of birth for the foreign-born population - Pakistan (%)
Place of birth for the foreign-born population - Sri Lanka (%)
Place of birth for the foreign-born population - Uzbekistan (%)
Place of birth for the foreign-born population - Other South Central Asia (%)
Place of birth for the foreign-born population - Burma (%)
Place of birth for the foreign-born population - Cambodia (%)
Place of birth for the foreign-born population - Indonesia (%)
Place of birth for the foreign-born population - Laos (%)
Place of birth for the foreign-born population - Malaysia (%)
Place of birth for the foreign-born population - Philippines (%)
Place of birth for the foreign-born population - Singapore (%)
Place of birth for the foreign-born population - Thailand (%)
Place of birth for the foreign-born population - Vietnam (%)
Place of birth for the foreign-born population - Other South Eastern Asia (%)
Place of birth for the foreign-born population - Armenia (%)
Place of birth for the foreign-born population - Iraq (%)
Place of birth for the foreign-born population - Israel (%)
Place of birth for the foreign-born population - Jordan (%)
Place of birth for the foreign-born population - Kuwait (%)
Place of birth for the foreign-born population - Lebanon (%)
Place of birth for the foreign-born population - Saudi Arabia (%)
Place of birth for the foreign-born population - Syria (%)
Place of birth for the foreign-born population - Turkey (%)
Place of birth for the foreign-born population - Yemen (%)
Place of birth for the foreign-born population - Other Western Asia (%)
Place of birth for the foreign-born population - Eritrea (%)
Place of birth for the foreign-born population - Ethiopia (%)
Place of birth for the foreign-born population - Kenya (%)
Place of birth for the foreign-born population - Somalia (%)
Place of birth for the foreign-born population - Uganda (%)
Place of birth for the foreign-born population - Zimbabwe (%)
Place of birth for the foreign-born population - Other Eastern Africa (%)
Place of birth for the foreign-born population - Cameroon (%)
Place of birth for the foreign-born population - Congo (%)
Place of birth for the foreign-born population - Democratic Republic of Congo (Zaire) (%)
Place of birth for the foreign-born population - Other Middle Africa (%)
Place of birth for the foreign-born population - Egypt (%)
Place of birth for the foreign-born population - Morocco (%)
Place of birth for the foreign-born population - Sudan (%)
Place of birth for the foreign-born population - Other Northern Africa (%)
Place of birth for the foreign-born population - South Africa (%)
Place of birth for the foreign-born population - Other Southern Africa (%)
Place of birth for the foreign-born population - Cabo Verde (%)
Place of birth for the foreign-born population - Ghana (%)
Place of birth for the foreign-born population - Liberia (%)
Place of birth for the foreign-born population - Nigeria (%)
Place of birth for the foreign-born population - Senegal (%)
Place of birth for the foreign-born population - Sierra Leone (%)
Place of birth for the foreign-born population - Other Western Africa (%)
Place of birth for the foreign-born population - Australia (%)
Place of birth for the foreign-born population - New Zealand (%)
Place of birth for the foreign-born population - Fiji (%)
Place of birth for the foreign-born population - Micronesia (%)
Place of birth for the foreign-born population - Bahamas (%)
Place of birth for the foreign-born population - Barbados (%)
Place of birth for the foreign-born population - Cuba (%)
Place of birth for the foreign-born population - Dominica (%)
Place of birth for the foreign-born population - Dominican Republic (%)
Place of birth for the foreign-born population - Grenada (%)
Place of birth for the foreign-born population - Haiti (%)
Place of birth for the foreign-born population - Jamaica (%)
Place of birth for the foreign-born population - St. Vincent and the Grenadines (%)
Place of birth for the foreign-born population - Trinidad and Tobago (%)
Place of birth for the foreign-born population - West Indies (%)
Place of birth for the foreign-born population - Other Caribbean (%)
Place of birth for the foreign-born population - Belize (%)
Place of birth for the foreign-born population - Costa Rica (%)
Place of birth for the foreign-born population - El Salvador (%)
Place of birth for the foreign-born population - Guatemala (%)
Place of birth for the foreign-born population - Honduras (%)
Place of birth for the foreign-born population - Mexico (%)
Place of birth for the foreign-born population - Nicaragua (%)
Place of birth for the foreign-born population - Panama (%)
Place of birth for the foreign-born population - Other Central America (%)
Place of birth for the foreign-born population - Argentina (%)
Place of birth for the foreign-born population - Bolivia (%)
Place of birth for the foreign-born population - Brazil (%)
Place of birth for the foreign-born population - Chile (%)
Place of birth for the foreign-born population - Colombia (%)
Place of birth for the foreign-born population - Ecuador (%)
Place of birth for the foreign-born population - Guyana (%)
Place of birth for the foreign-born population - Peru (%)
Place of birth for the foreign-born population - Uruguay (%)
Place of birth for the foreign-born population - Venezuela (%)
Place of birth for the foreign-born population - Other South America (%)
Place of birth for the foreign-born population - Canada (%)
Place of birth for the foreign-born population - Other Northern America (%)
Place of birth for the foreign-born population - Other (%)
Latest news about races in Smithfield, UT collected exclusively by city-data.com from local newspapers, TV, and radio stations
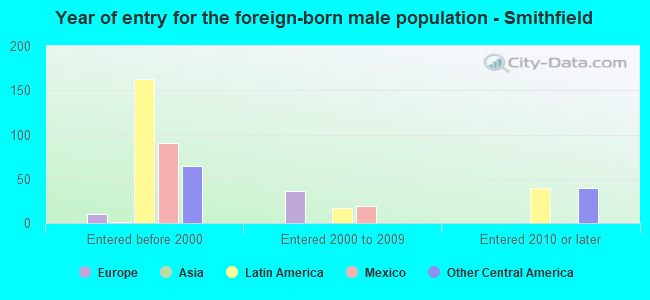
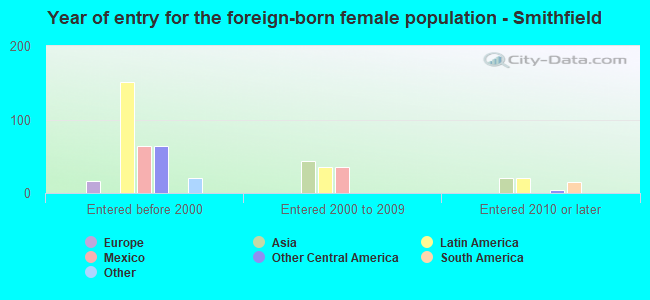
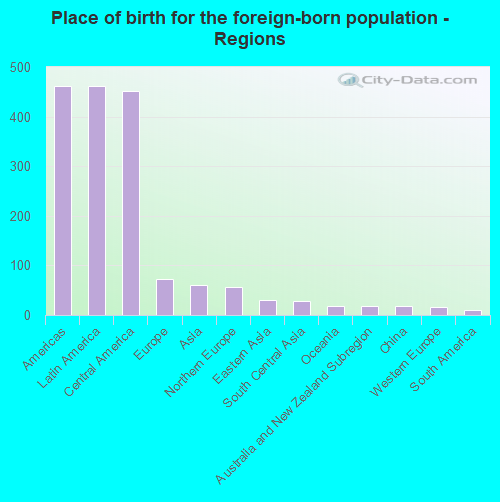
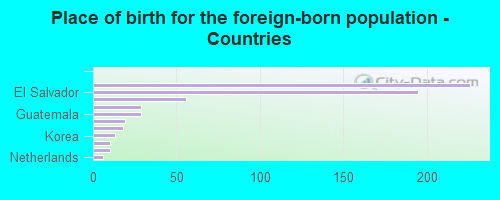
According to 2022 data, the most numerous races in Smithfield, UT are White alone (12,356 residents), Hispanic (1,212 residents), and Two or more races (475 residents). 91.0% of Smithfield residents speak English at home. 4.3% of Smithfield, UT residents are foreign-born (3.2% born in Latin America, 0.5% born in Europe), which is 85.0% less than the foreign-born rate of 8.0% across the entire state of Utah.
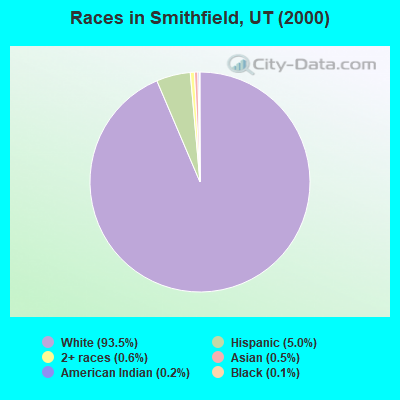
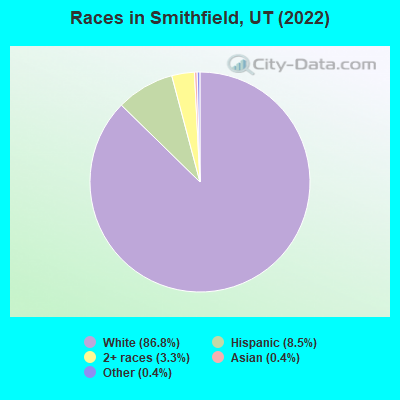
Race distribution in Smithfield
2000 2022
1,904,265 85.3% White alone 201,559 9.0% Hispanic 36,483 1.6% Asian alone 31,308 1.4% Two or more races 26,663 1.2% American Indian alone 14,806 0.7% Native Hawaiian and Other 16,137 0.7% Black alone 1,948 0.09% Other race alone
2,557,466 75.6% White alone 512,086 15.1% Hispanic 119,308 3.5% Two or more races 82,388 2.4% Asian alone 36,978 1.1% Native Hawaiian and Other 34,873 1.0% Black alone 22,803 0.7% American Indian alone 14,898 0.4% Other race alone
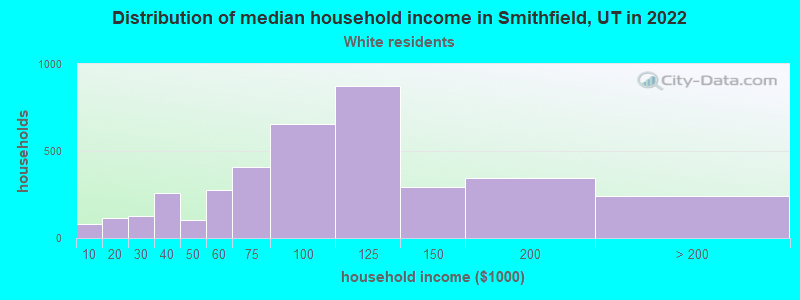
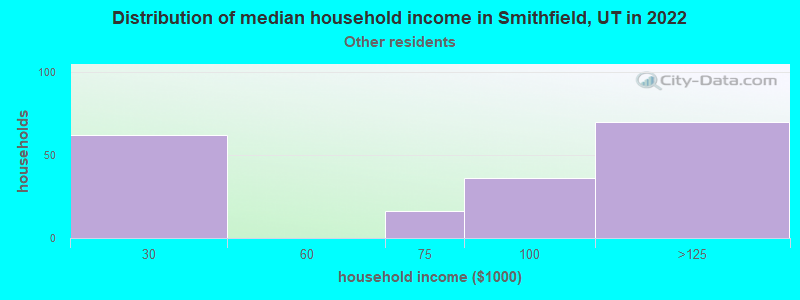
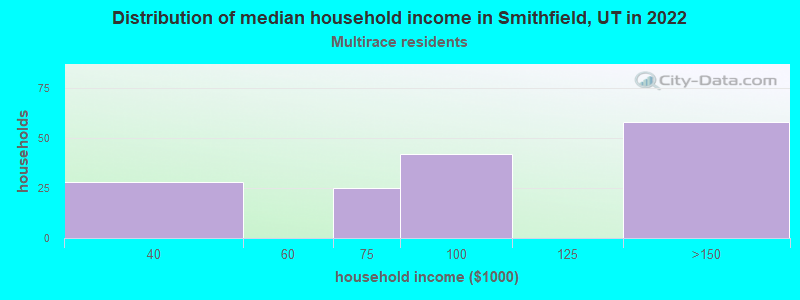
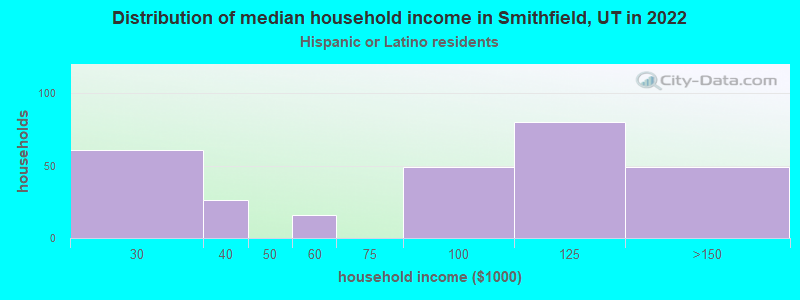
Income and house value in Smithfield Median household income in 2022 $94,779 White non-Hispanic householders$99,529 Some other race householders$73,600 Two or more races householders$81,735 Hispanic or Latino race householdersMedian 2022 house value $478,037 White Non-Hispanic householders $815,454 Asian householders$356,263 Some other race householders$402,290 Hispanic or Latino householders
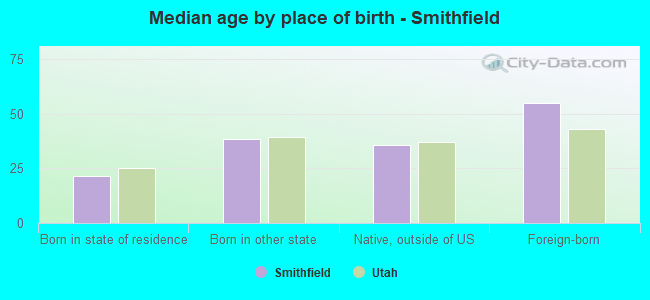
Median age by race in Smithfield
28.4 Median age for White residents28.2 28.7 -503,105,589.6 Median age for Black or African American residents-656,596,172.6 -661,040,787.0 -1,054,970,759.2 Median age for American Indian / Alaska Native residents-720,955,482.4 -1,202,099,736.3 24.8 Median age for Asian residents-894,117,646.2 23.8 -604,898,827.9 Median age for Native Hawaiian / Pacific Islander residents-1,076,305,219.8 -664,285,713.6 32.8 Median age for Other race residents25.3 42.2 26.3 Median age for Two or more races residents26.9 30.3 28.8 Median age for White alone residents28.5 29.0 33.2 Median age for Hispanic or Latino residents26.4 38.0
Owner/renter occupied households by race in Smithfield
House owners and renters - White residents 3,089 81.7% Owner occupied690 18.3% Renter occupiedHouse owners and renters - American Indian / Alaska Native residents 14 100.0% Owner occupiedHouse owners and renters - Other race residents 181 87.7% Owner occupied25 12.3% Renter occupiedHouse owners and renters - Two or more races residents 174 80.2% Owner occupied43 19.8% Renter occupiedHouse owners and renters - White alone residents 3,131 82.1% Owner occupied680 17.9% Renter occupiedHouse owners and renters - Hispanic or Latino residents 183 70.5% Owner occupied76 29.5% Renter occupied
Language usage in Smithfield
English speakers - Total 91.0% of residents of Smithfield speak English at home.
7.5% of residents speak Spanish at home 596 63.0% Speak English very well350 37.0% Speak English less than very well1.5% of residents speak other language at home 183 93.8% Speak English very well12 6.2% Speak English less than very well
English speakers - Born in the United States 95.8% of residents of Smithfield speak English at home.
3.0% of residents speak Spanish at home 98 83.8% Speak English very well19 16.2% Speak English less than very well2.5% of residents speak other language at home 97 100.0% Speak English very well
English speakers - Native, born elsewhere 47.0% of residents of Smithfield speak English at home.
75.8% of residents speak Spanish at home 50 100.0% Speak English very well
English speakers - Foreign-born 10.2% of residents of Smithfield speak English at home.
85.1% of residents speak Spanish at home 245 53.6% Speak English very well212 46.4% Speak English less than very well15.8% of residents speak other language at home 78 91.8% Speak English very well7 8.2% Speak English less than very well
White (Caucasian) - Speak only English Native:
97.6% (10,714)Foreign-born:
67.7% (51)
White (Caucasian) - Speak another language Native:
2.4% (266)Foreign-born:
61.8% (47)
Other race - Speak another language Native:
59.3% (220)Foreign-born:
93.1% (246)
Two or more races - Speak another language Native:
21.5% (138)Foreign-born:
100.0% (219)
White alone - Speak only English Native:
97.6% (10,701)Foreign-born:
93.9% (58)
White alone - Speak another language Native:
2.2% (241)Foreign-born:
11.2% (7)
Hispanic or Latino - Speak another language Native:
56.5% (380)Foreign-born:
100.0% (441)
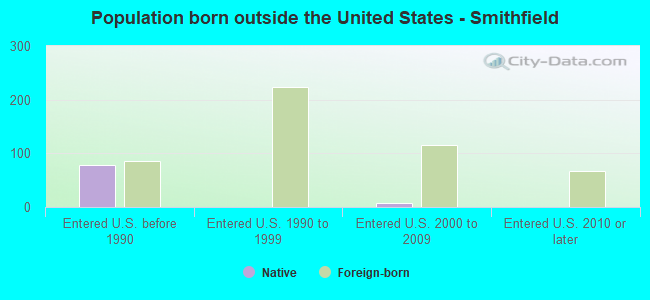
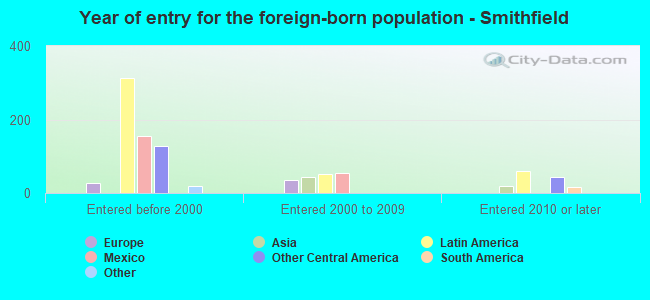
Foreign-born residents in Smithfield 616 residents are foreign born (3.2% Latin America , 0.5% Europe ).
Marital status for residents in Smithfield Marital status - White (Caucasian) population 15 years and over
Males 21.6% Never married72.2% Now married0.8% Separated1.1% Widowed4.4% DivorcedFemales 18.8% Never married66.9% Now married2.0% Separated4.9% Widowed7.4% DivorcedWomen who gave birth in the past 12 months Now married:
93.8% (381)Unmarried:
6.2% (25)
Women who did not give birth in the past 12 months Now married:
63.3% (1,630)Unmarried:
36.7% (944)
Marital status - Asian population 15 years and over
Males 100.0% Never married0.0% Now married0.0% Separated0.0% Widowed0.0% DivorcedFemales 22.8% Never married77.2% Now married0.0% Separated0.0% Widowed0.0% DivorcedWomen who did not give birth in the past 12 months Now married:
67.5% (30)Unmarried:
32.5% (14)
Marital status - Other race population 15 years and over
Males 49.1% Never married42.1% Now married0.0% Separated0.0% Widowed8.8% DivorcedFemales 10.7% Never married61.7% Now married0.0% Separated20.9% Widowed6.8% DivorcedWomen who did not give birth in the past 12 months Now married:
76.1% (80)Unmarried:
23.9% (25)
Marital status - Two or more races population 15 years and over
Males 36.2% Never married52.1% Now married0.0% Separated0.0% Widowed11.7% DivorcedFemales 19.0% Never married66.3% Now married0.0% Separated0.0% Widowed14.7% DivorcedWomen who did not give birth in the past 12 months Now married:
59.6% (108)Unmarried:
40.4% (73)
Marital status - White alone, not Hispanic / Latino population 15 years and over
Males 21.3% Never married72.3% Now married0.8% Separated1.1% Widowed4.5% DivorcedFemales 18.6% Never married67.0% Now married2.1% Separated5.0% Widowed7.3% DivorcedWomen who gave birth in the past 12 months Now married:
93.8% (389)Unmarried:
6.2% (26)
Women who did not give birth in the past 12 months Now married:
63.2% (1,607)Unmarried:
36.8% (935)
Marital status - Hispanic or Latino population 15 years and over
Males 49.1% Never married41.3% Now married0.0% Separated0.0% Widowed9.6% DivorcedFemales 13.4% Never married62.6% Now married0.0% Separated11.6% Widowed12.4% DivorcedWomen who did not give birth in the past 12 months Now married:
66.8% (158)Unmarried:
33.2% (78)
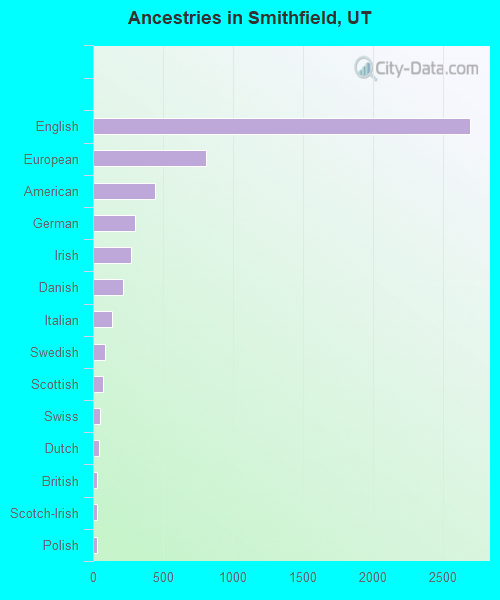
Ancestries in Smithfield
2,697 41.9% English809 12.6% European441 6.9% American297 4.6% German274 4.3% Irish216 3.4% Danish137 2.1% Italian85 1.3% Swedish73 1.1% Scottish47 0.7% Swiss42 0.7% Dutch31 0.5% British31 0.5% Scotch-Irish27 0.4% Polish18 0.3% Norwegian15 0.2% French10 0.2% Australian6 0.09% Basque5 0.08% Welsh
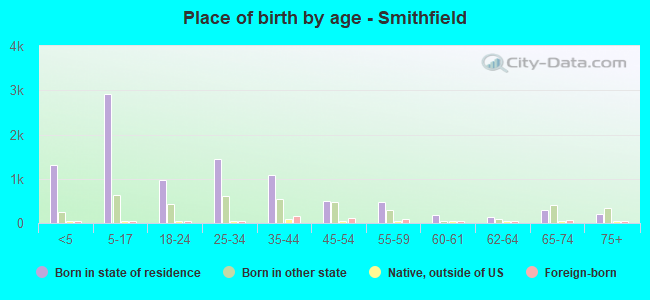
Children Nativity (place of birth) in Smithfield
Children under 6 years - Living with two parents Both parents native 1,505 100.0% NativeBoth parents foreign-born 9 100.0% NativeOne native, one foreign-born parent 33 100.0% NativeChildren under 6 years - Living with one parent Native parent 153 100.0% NativeForeign-born parent 33 100.0% NativeChildren 6 to 17 years - Living with two parents Both parents native 2,706 100.0% NativeBoth parents foreign-born 21 100.0% NativeOne native, one foreign-born parent 145 100.0% NativeChildren 6 to 17 years - Living with one parent Native parent 244 100.0% NativeForeign-born parent 63 50.7% Native61 49.3% Foreign-born
Grandparents responsible for own grandchildren in Smithfield
Grandparents (30 to 59 years) White / Caucasian 18 6.1% Responsible for grandchildren279 93.9% Not responsible for grandchildrenWhite alone, not Hispanic / Latino 20 6.4% Responsible for grandchildren293 93.6% Not responsible for grandchildrenGrandparents (60 years and over) White / Caucasian 20 21.3% Responsible for grandchildren72 78.7% Not responsible for grandchildrenWhite alone, not Hispanic / Latino 20 20.7% Responsible for grandchildren75 79.3% Not responsible for grandchildren