Races in Simi Valley, California (CA) Detailed Stats
Data:
Races - White alone (%)
Races - White alone (% change since 2000)
Races - Black alone (%)
Races - Black alone (% change since 2000)
Races - American Indian alone (%)
Races - American Indian alone (% change since 2000)
Races - Asian alone (%)
Races - Asian alone (% change since 2000)
Races - Hispanic (%)
Races - Hispanic (% change since 2000)
Races - Native Hawaiian and Other Pacific Islander alone (%)
Races - Native Hawaiian and Other Pacific Islander alone (% change since 2000)
Races - Two or more races(%)
Races - Two or more races(% change since 2000)
Races - Other race alone (%)
Races - Other race alone (% change since 2000)
Racial diversity
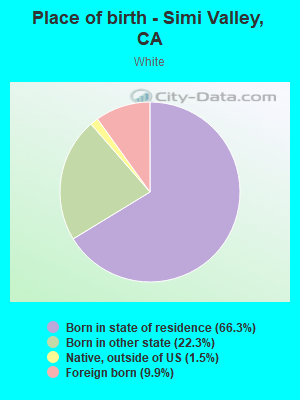
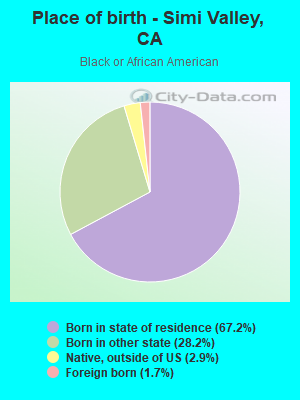
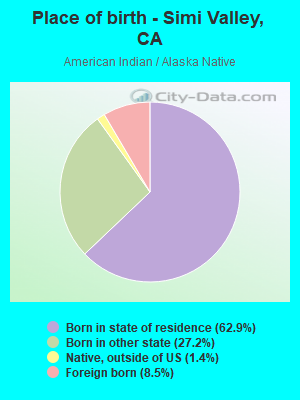
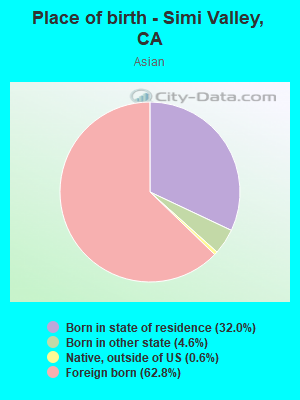
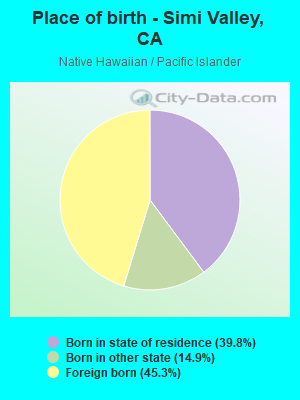
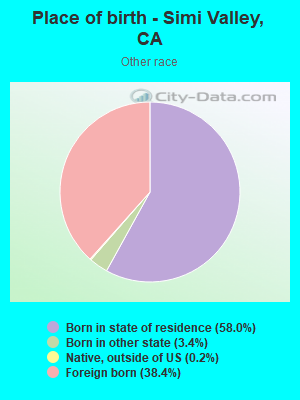
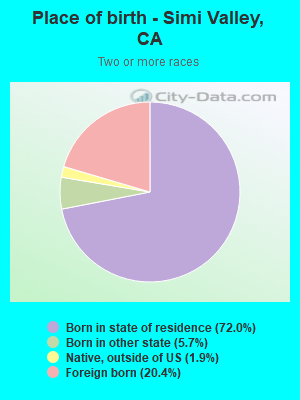
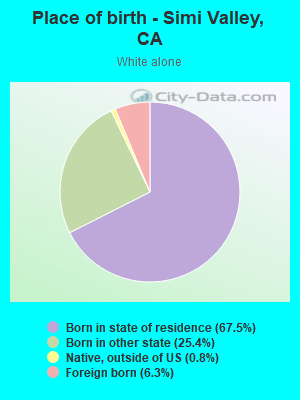
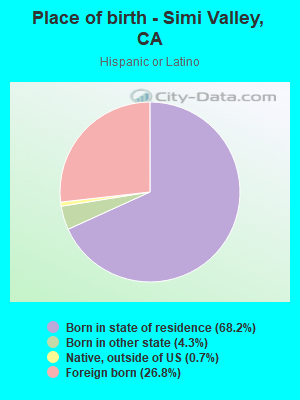
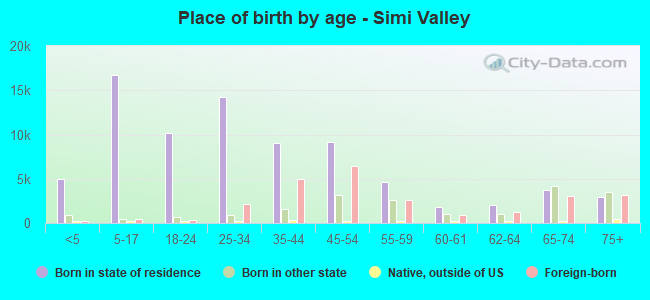
Place of birth - Born in state of residence (%)
Place of birth - Born in state of residence (%) - White
Place of birth - Born in state of residence (%) - Black or African American
Place of birth - Born in state of residence (%) - Asian
Place of birth - Born in state of residence (%) - Hispanic or Latino
Place of birth - Born in state of residence (%) - American Indian and Alaska Native
Place of birth - Born in state of residence (%) - Multirace
Place of birth - Born in state of residence (%) - Other Race
Place of birth - Born in other state (%)
Place of birth - Born in other state (%) - White
Place of birth - Born in other state (%) - Black or African American
Place of birth - Born in other state (%) - Asian
Place of birth - Born in other state (%) - Hispanic or Latino
Place of birth - Born in other state (%) - American Indian and Alaska Native
Place of birth - Born in other state (%) - Multirace
Place of birth - Born in other state (%) - Other Race
Place of birth - Native, outside of US (%)
Place of birth - Native, outside of US (%) - White
Place of birth - Native, outside of US (%) - Black or African American
Place of birth - Native, outside of US (%) - Asian
Place of birth - Native, outside of US (%) - Hispanic or Latino
Place of birth - Native, outside of US (%) - American Indian and Alaska Native
Place of birth - Native, outside of US (%) - Multirace
Place of birth - Native, outside of US (%) - Other Race
Place of birth - Foreign born (%)
Place of birth - Foreign born (%) - White
Place of birth - Foreign born (%) - Black or African American
Place of birth - Foreign born (%) - Asian
Place of birth - Foreign born (%) - Hispanic or Latino
Place of birth - Foreign born (%) - American Indian and Alaska Native
Place of birth - Foreign born (%) - Multirace
Place of birth - Foreign born (%) - Other Race
Residents speaking English at home (%)
Residents speaking English at home - Born in the United States (%)
Residents speaking English at home - Native, born elsewhere (%)
Residents speaking English at home - Foreign born (%)
Residents speaking Spanish at home (%)
Residents speaking Spanish at home - Born in the United States (%)
Residents speaking Spanish at home - Native, born elsewhere (%)
Residents speaking Spanish at home - Foreign born (%)
Residents speaking other language at home (%)
Residents speaking other language at home - Born in the United States (%)
Residents speaking other language at home - Native, born elsewhere (%)
Residents speaking other language at home - Foreign born (%)
Marital status - Never married (%)
Marital status - Now married (%)
Marital status - Separated (%)
Marital status - Widowed (%)
Marital status - Divorced (%)
Ancestries Reported - Arab (%)
Ancestries Reported - Czech (%)
Ancestries Reported - Danish (%)
Ancestries Reported - Dutch (%)
Ancestries Reported - English (%)
Ancestries Reported - French (%)
Ancestries Reported - French Canadian (%)
Ancestries Reported - German (%)
Ancestries Reported - Greek (%)
Ancestries Reported - Hungarian (%)
Ancestries Reported - Irish (%)
Ancestries Reported - Italian (%)
Ancestries Reported - Lithuanian (%)
Ancestries Reported - Norwegian (%)
Ancestries Reported - Polish (%)
Ancestries Reported - Portuguese (%)
Ancestries Reported - Russian (%)
Ancestries Reported - Scotch-Irish (%)
Ancestries Reported - Scottish (%)
Ancestries Reported - Slovak (%)
Ancestries Reported - Subsaharan African (%)
Ancestries Reported - Swedish (%)
Ancestries Reported - Swiss (%)
Ancestries Reported - Ukrainian (%)
Ancestries Reported - United States (%)
Ancestries Reported - Welsh (%)
Ancestries Reported - West Indian (%)
Ancestries Reported - Other (%)
Geographical mobility - Same house 1 year ago (%)
Geographical mobility - Same house 1 year ago (%) - White
Geographical mobility - Same house 1 year ago (%) - Black or African American
Geographical mobility - Same house 1 year ago (%) - Asian
Geographical mobility - Same house 1 year ago (%) - Hispanic or Latino
Geographical mobility - Same house 1 year ago (%) - American Indian and Alaska Native
Geographical mobility - Same house 1 year ago (%) - Multirace
Geographical mobility - Same house 1 year ago (%) - Other Race
Geographical mobility - Moved within same county (%)
Geographical mobility - Moved within same county (%) - White
Geographical mobility - Moved within same county (%) - Black or African American
Geographical mobility - Moved within same county (%) - Asian
Geographical mobility - Moved within same county (%) - Hispanic or Latino
Geographical mobility - Moved within same county (%) - American Indian and Alaska Native
Geographical mobility - Moved within same county (%) - Multirace
Geographical mobility - Moved within same county (%) - Other Race
Geographical mobility - Moved from different county within same state (%)
Geographical mobility - Moved from different county within same state (%) - White
Geographical mobility - Moved from different county within same state (%) - Black or African American
Geographical mobility - Moved from different county within same state (%) - Asian
Geographical mobility - Moved from different county within same state (%) - Hispanic or Latino
Geographical mobility - Moved from different county within same state (%) - American Indian and Alaska Native
Geographical mobility - Moved from different county within same state (%) - Multirace
Geographical mobility - Moved from different county within same state (%) - Other Race
Geographical mobility - Moved from different state (%)
Geographical mobility - Moved from different state (%) - White
Geographical mobility - Moved from different state (%) - Black or African American
Geographical mobility - Moved from different state (%) - Asian
Geographical mobility - Moved from different state (%) - Hispanic or Latino
Geographical mobility - Moved from different state (%) - American Indian and Alaska Native
Geographical mobility - Moved from different state (%) - Multirace
Geographical mobility - Moved from different state (%) - Other Race
Geographical mobility - Moved from abroad (%)
Geographical mobility - Moved from abroad (%) - White
Geographical mobility - Moved from abroad (%) - Black or African American
Geographical mobility - Moved from abroad (%) - Asian
Geographical mobility - Moved from abroad (%) - Hispanic or Latino
Geographical mobility - Moved from abroad (%) - American Indian and Alaska Native
Geographical mobility - Moved from abroad (%) - Multirace
Geographical mobility - Moved from abroad (%) - Other Race
Place of birth for the foreign-born population - Ireland (%)
Place of birth for the foreign-born population - Denmark (%)
Place of birth for the foreign-born population - Norway (%)
Place of birth for the foreign-born population - Sweden (%)
Place of birth for the foreign-born population - United Kingdom (%)
Place of birth for the foreign-born population - England (%)
Place of birth for the foreign-born population - Scotland (%)
Place of birth for the foreign-born population - Other Northern Europe (%)
Place of birth for the foreign-born population - Austria (%)
Place of birth for the foreign-born population - Belgium (%)
Place of birth for the foreign-born population - France (%)
Place of birth for the foreign-born population - Germany (%)
Place of birth for the foreign-born population - Netherlands (%)
Place of birth for the foreign-born population - Switzerland (%)
Place of birth for the foreign-born population - Other Western Europe (%)
Place of birth for the foreign-born population - Greece (%)
Place of birth for the foreign-born population - Italy (%)
Place of birth for the foreign-born population - Portugal (%)
Place of birth for the foreign-born population - Spain (%)
Place of birth for the foreign-born population - Other Southern Europe (%)
Place of birth for the foreign-born population - Albania (%)
Place of birth for the foreign-born population - Belarus (%)
Place of birth for the foreign-born population - Bosnia and Herzegovina (%)
Place of birth for the foreign-born population - Bulgaria (%)
Place of birth for the foreign-born population - Croatia (%)
Place of birth for the foreign-born population - Czechoslovakia (%)
Place of birth for the foreign-born population - Hungary (%)
Place of birth for the foreign-born population - Latvia (%)
Place of birth for the foreign-born population - Lithuania (%)
Place of birth for the foreign-born population - North Macedonia (Macedonia) (%)
Place of birth for the foreign-born population - Moldova (%)
Place of birth for the foreign-born population - Poland (%)
Place of birth for the foreign-born population - Romania (%)
Place of birth for the foreign-born population - Russia (%)
Place of birth for the foreign-born population - Serbia (%)
Place of birth for the foreign-born population - Ukraine (%)
Place of birth for the foreign-born population - Other Eastern Europe (%)
Place of birth for the foreign-born population - China (%)
Place of birth for the foreign-born population - Hong Kong (%)
Place of birth for the foreign-born population - Taiwan (%)
Place of birth for the foreign-born population - Japan (%)
Place of birth for the foreign-born population - Korea (%)
Place of birth for the foreign-born population - Other Eastern Asia (%)
Place of birth for the foreign-born population - Afghanistan (%)
Place of birth for the foreign-born population - Bangladesh (%)
Place of birth for the foreign-born population - India (%)
Place of birth for the foreign-born population - Iran (%)
Place of birth for the foreign-born population - Kazakhstan (%)
Place of birth for the foreign-born population - Nepal (%)
Place of birth for the foreign-born population - Pakistan (%)
Place of birth for the foreign-born population - Sri Lanka (%)
Place of birth for the foreign-born population - Uzbekistan (%)
Place of birth for the foreign-born population - Other South Central Asia (%)
Place of birth for the foreign-born population - Burma (%)
Place of birth for the foreign-born population - Cambodia (%)
Place of birth for the foreign-born population - Indonesia (%)
Place of birth for the foreign-born population - Laos (%)
Place of birth for the foreign-born population - Malaysia (%)
Place of birth for the foreign-born population - Philippines (%)
Place of birth for the foreign-born population - Singapore (%)
Place of birth for the foreign-born population - Thailand (%)
Place of birth for the foreign-born population - Vietnam (%)
Place of birth for the foreign-born population - Other South Eastern Asia (%)
Place of birth for the foreign-born population - Armenia (%)
Place of birth for the foreign-born population - Iraq (%)
Place of birth for the foreign-born population - Israel (%)
Place of birth for the foreign-born population - Jordan (%)
Place of birth for the foreign-born population - Kuwait (%)
Place of birth for the foreign-born population - Lebanon (%)
Place of birth for the foreign-born population - Saudi Arabia (%)
Place of birth for the foreign-born population - Syria (%)
Place of birth for the foreign-born population - Turkey (%)
Place of birth for the foreign-born population - Yemen (%)
Place of birth for the foreign-born population - Other Western Asia (%)
Place of birth for the foreign-born population - Eritrea (%)
Place of birth for the foreign-born population - Ethiopia (%)
Place of birth for the foreign-born population - Kenya (%)
Place of birth for the foreign-born population - Somalia (%)
Place of birth for the foreign-born population - Uganda (%)
Place of birth for the foreign-born population - Zimbabwe (%)
Place of birth for the foreign-born population - Other Eastern Africa (%)
Place of birth for the foreign-born population - Cameroon (%)
Place of birth for the foreign-born population - Congo (%)
Place of birth for the foreign-born population - Democratic Republic of Congo (Zaire) (%)
Place of birth for the foreign-born population - Other Middle Africa (%)
Place of birth for the foreign-born population - Egypt (%)
Place of birth for the foreign-born population - Morocco (%)
Place of birth for the foreign-born population - Sudan (%)
Place of birth for the foreign-born population - Other Northern Africa (%)
Place of birth for the foreign-born population - South Africa (%)
Place of birth for the foreign-born population - Other Southern Africa (%)
Place of birth for the foreign-born population - Cabo Verde (%)
Place of birth for the foreign-born population - Ghana (%)
Place of birth for the foreign-born population - Liberia (%)
Place of birth for the foreign-born population - Nigeria (%)
Place of birth for the foreign-born population - Senegal (%)
Place of birth for the foreign-born population - Sierra Leone (%)
Place of birth for the foreign-born population - Other Western Africa (%)
Place of birth for the foreign-born population - Australia (%)
Place of birth for the foreign-born population - New Zealand (%)
Place of birth for the foreign-born population - Fiji (%)
Place of birth for the foreign-born population - Micronesia (%)
Place of birth for the foreign-born population - Bahamas (%)
Place of birth for the foreign-born population - Barbados (%)
Place of birth for the foreign-born population - Cuba (%)
Place of birth for the foreign-born population - Dominica (%)
Place of birth for the foreign-born population - Dominican Republic (%)
Place of birth for the foreign-born population - Grenada (%)
Place of birth for the foreign-born population - Haiti (%)
Place of birth for the foreign-born population - Jamaica (%)
Place of birth for the foreign-born population - St. Vincent and the Grenadines (%)
Place of birth for the foreign-born population - Trinidad and Tobago (%)
Place of birth for the foreign-born population - West Indies (%)
Place of birth for the foreign-born population - Other Caribbean (%)
Place of birth for the foreign-born population - Belize (%)
Place of birth for the foreign-born population - Costa Rica (%)
Place of birth for the foreign-born population - El Salvador (%)
Place of birth for the foreign-born population - Guatemala (%)
Place of birth for the foreign-born population - Honduras (%)
Place of birth for the foreign-born population - Mexico (%)
Place of birth for the foreign-born population - Nicaragua (%)
Place of birth for the foreign-born population - Panama (%)
Place of birth for the foreign-born population - Other Central America (%)
Place of birth for the foreign-born population - Argentina (%)
Place of birth for the foreign-born population - Bolivia (%)
Place of birth for the foreign-born population - Brazil (%)
Place of birth for the foreign-born population - Chile (%)
Place of birth for the foreign-born population - Colombia (%)
Place of birth for the foreign-born population - Ecuador (%)
Place of birth for the foreign-born population - Guyana (%)
Place of birth for the foreign-born population - Peru (%)
Place of birth for the foreign-born population - Uruguay (%)
Place of birth for the foreign-born population - Venezuela (%)
Place of birth for the foreign-born population - Other South America (%)
Place of birth for the foreign-born population - Canada (%)
Place of birth for the foreign-born population - Other Northern America (%)
Place of birth for the foreign-born population - Other (%)
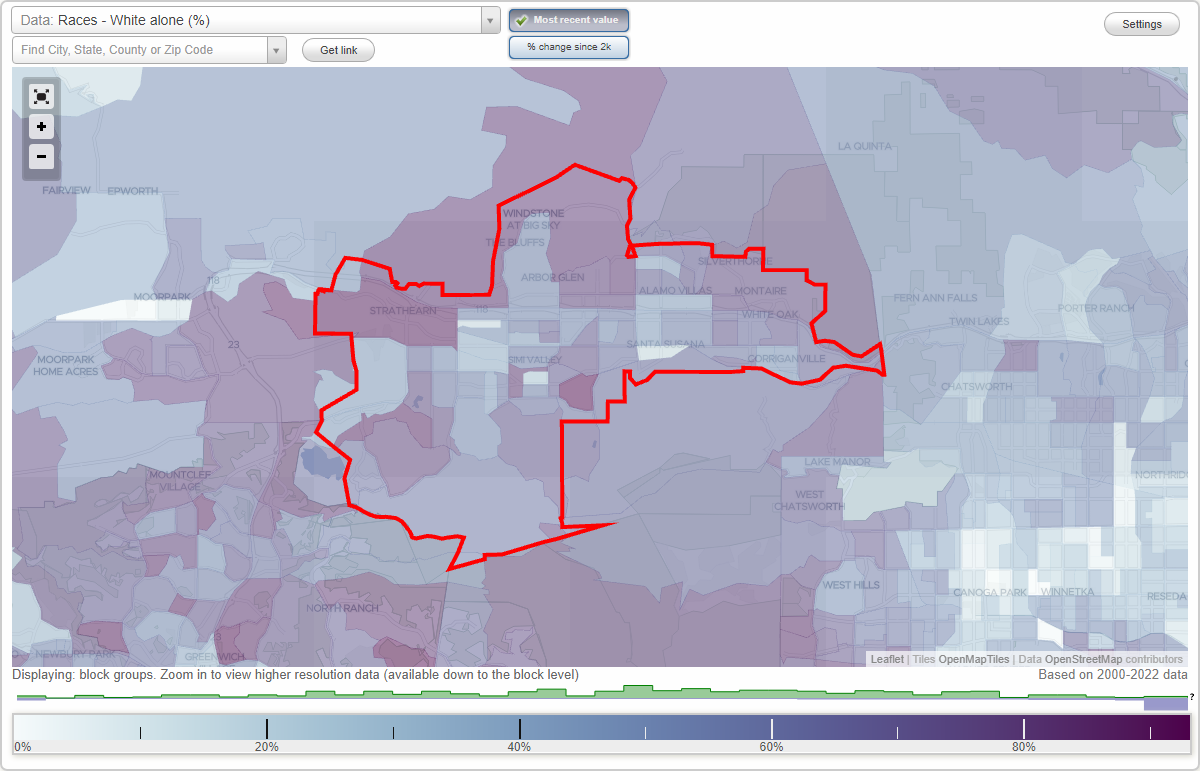
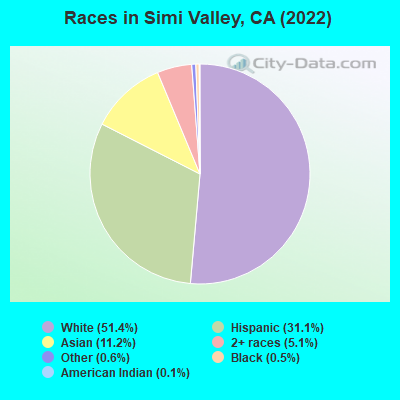
According to 2022 data, the most numerous races in Simi Valley, CA are Hispanic (31,207 residents), White alone (69,792 residents), and Asian alone (16,378 residents). 73.5% of Simi Valley residents speak English at home. 18.3% of Simi Valley, CA residents are foreign-born (7.9% born in Asia, 7.5% born in Latin America, 2.0% born in Europe), which is 42.0% less than the foreign-born rate of 26.0% across the entire state of California.
Race distribution in Simi Valley
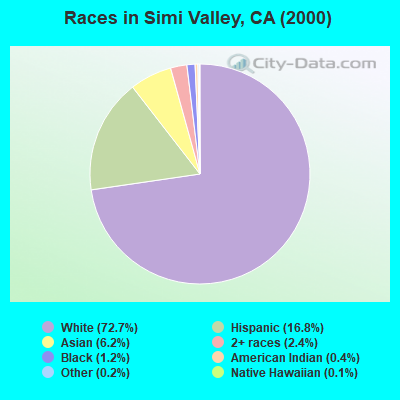
2000 2022
80,908 72.7% White alone 18,729 16.8% Hispanic 6,932 6.2% Asian alone 2,643 2.4% Two or more races 1,348 1.2% Black alone 457 0.4% American Indian alone 191 0.2% Other race alone 143 0.1% Native Hawaiian and Other
69,792 55.5% White alone 31,207 24.8% Hispanic 16,378 13.0% Asian alone 4,564 3.6% Two or more races 1,237 1.0% Black alone 624 0.5% Native Hawaiian and Other 125 0.10% Other race alone 51 0.04% American Indian alone
2000 2022
15,816,790 46.7% White alone 10,966,556 32.4% Hispanic 3,648,860 10.8% Asian alone 2,181,926 6.4% Black alone 903,115 2.7% Two or more races 178,984 0.5% American Indian alone 103,736 0.3% Native Hawaiian and Other 71,681 0.2% Other race alone
15,732,184 40.3% Hispanic 13,160,426 33.7% White alone 5,957,867 15.3% Asian alone 2,025,218 5.2% Black alone 1,663,222 4.3% Two or more races 251,618 0.6% Other race alone 135,777 0.3% Native Hawaiian and Other 103,030 0.3% American Indian alone
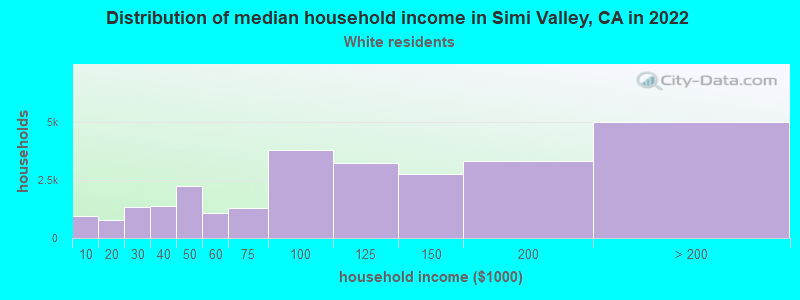
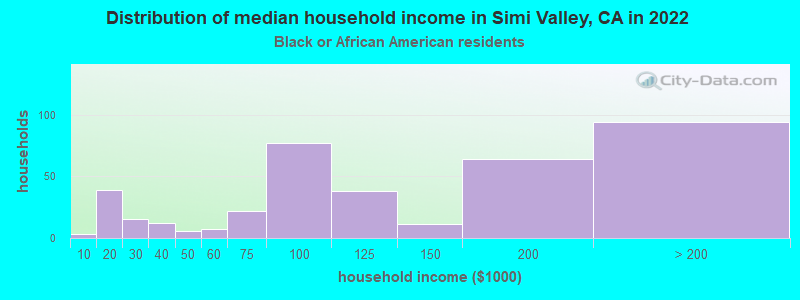
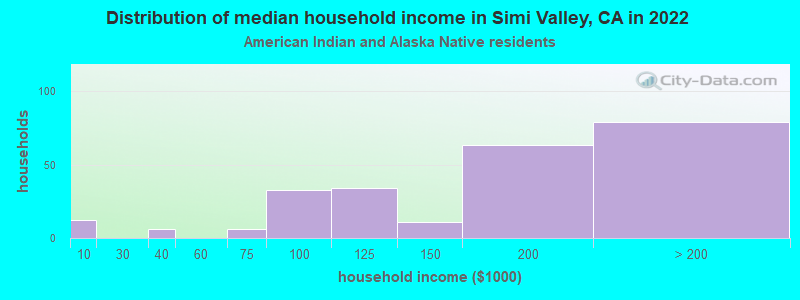
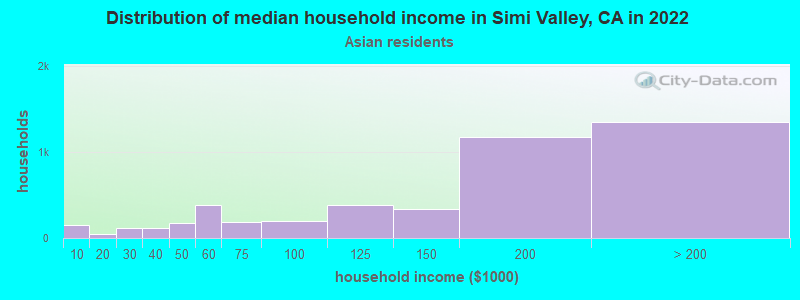
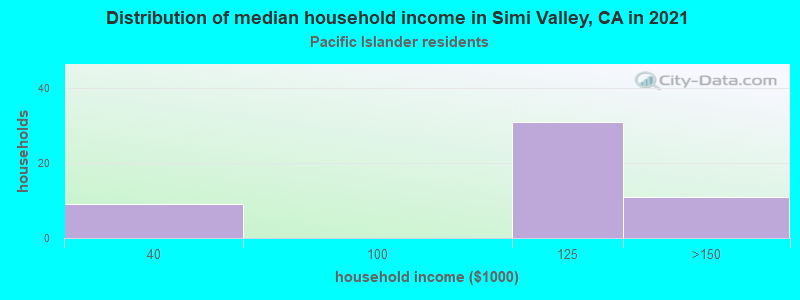
Income and house value in Simi Valley Median household income in 2022 $120,377 White non-Hispanic householders$94,364 Black householders$195,231 American Indian and Alaska Native householders$166,360 Asian householders$115,061 Native Hawaiian and other Pacific Islander householders$132,249 Some other race householders$162,567 Two or more races householders$121,060 Hispanic or Latino race householdersMedian 2022 house value $870,309 White Non-Hispanic householders$867,430 Black or African American householders$782,486 American Indian or Alaska Native householders $905,942 Asian householdersover $1,000,000 Native Hawaiian and other Pacific Islander householders$774,208 Some other race householders$884,347 Two or more races householders$792,205 Hispanic or Latino householders
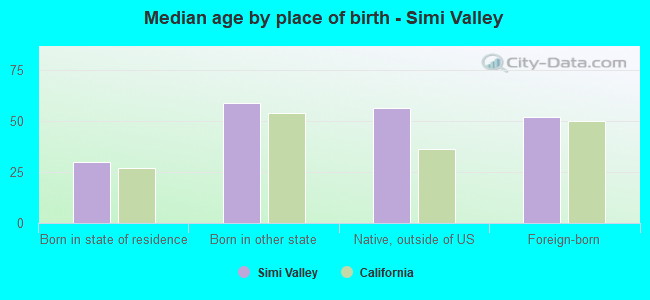
Median age by race in Simi Valley
45.3 Median age for White residents44.6 46.6 58.8 Median age for Black or African American residents46.3 66.6 51.7 Median age for American Indian / Alaska Native residents54.6 50.2 44.9 Median age for Asian residents43.2 45.1 40.0 Median age for Native Hawaiian / Pacific Islander residents33.4 Median age for Other race residents38.6 30.1 27.0 Median age for Two or more races residents26.4 30.1 47.3 Median age for White alone residents46.0 48.2 32.3 Median age for Hispanic or Latino residents34.1 31.1
Owner/renter occupied households by race in Simi Valley
House owners and renters - White residents 21,825 73.3% Owner occupied7,963 26.7% Renter occupiedHouse owners and renters - Black or African American residents 251 31.1% Owner occupied557 68.9% Renter occupiedHouse owners and renters - American Indian / Alaska Native residents 211 93.6% Owner occupied14 6.4% Renter occupiedHouse owners and renters - Asian residents 4,299 88.1% Owner occupied581 11.9% Renter occupiedHouse owners and renters - Native Hawaiian / Pacific Islander residents 37 100.0% Owner occupiedHouse owners and renters - Other race residents 1,031 58.3% Owner occupied739 41.7% Renter occupiedHouse owners and renters - Two or more races residents 1,771 54.8% Owner occupied1,459 45.2% Renter occupiedHouse owners and renters - White alone residents 20,399 73.0% Owner occupied7,558 27.0% Renter occupiedHouse owners and renters - Hispanic or Latino residents 4,769 65.2% Owner occupied2,542 34.8% Renter occupied
Language usage in Simi Valley
English speakers - Total 73.5% of residents of Simi Valley speak English at home.
15.5% of residents speak Spanish at home 12,446 67.1% Speak English very well6,094 32.9% Speak English less than very well11.4% of residents speak other language at home 9,794 71.9% Speak English very well3,834 28.1% Speak English less than very well
English speakers - Born in the United States 93.5% of residents of Simi Valley speak English at home.
4.0% of residents speak Spanish at home 676 79.2% Speak English very well177 20.8% Speak English less than very well2.3% of residents speak other language at home 467 98.1% Speak English very well9 1.9% Speak English less than very well
English speakers - Native, born elsewhere 77.4% of residents of Simi Valley speak English at home.
16.2% of residents speak Spanish at home 167 91.8% Speak English very well15 8.2% Speak English less than very well6.9% of residents speak other language at home 68 88.3% Speak English very well9 11.7% Speak English less than very well
English speakers - Foreign-born 17.5% of residents of Simi Valley speak English at home.
37.4% of residents speak Spanish at home 3,793 45.1% Speak English very well4,609 54.9% Speak English less than very well46.6% of residents speak other language at home 6,924 66.1% Speak English very well3,555 33.9% Speak English less than very well
White (Caucasian) - Speak only English Native:
95.5% (62,693)Foreign-born:
36.4% (2,732)
White (Caucasian) - Speak another language Native:
7.7% (5,040)Foreign-born:
69.1% (5,188)
Black or African American - Speak only English Native:
93.1% (1,341)Foreign-born:
10.8% (6)
Black or African American - Speak another language Native:
7.2% (104)Foreign-born:
92.1% (52)
American Indian / Alaska Native - Speak another language Native:
56.5% (252)Foreign-born:
98.3% (44)
Asian - Speak only English Native:
65.2% (4,775)Foreign-born:
21.5% (1,953)
Asian - Speak another language Native:
35.3% (2,583)Foreign-born:
79.5% (7,216)
Native Hawaiian / Pacific Islander - Speak only English Native:
100.0% (105)Foreign-born:
12.6% (14)
Native Hawaiian / Pacific Islander - Speak another language Native:
6.3% (7)Foreign-born:
86.7% (98)
Other race - Speak only English Native:
31.6% (1,543)Foreign-born:
7.0% (287)
Other race - Speak another language Native:
68.4% (3,345)Foreign-born:
93.4% (3,809)
Two or more races - Speak only English Native:
65.8% (7,600)Foreign-born:
21.5% (768)
Two or more races - Speak another language Native:
30.9% (3,565)Foreign-born:
73.5% (2,622)
White alone - Speak only English Native:
96.7% (59,071)Foreign-born:
41.6% (2,535)
White alone - Speak another language Native:
3.2% (1,984)Foreign-born:
58.2% (3,544)
Hispanic or Latino - Speak only English Native:
52.0% (10,128)Foreign-born:
9.1% (823)
Hispanic or Latino - Speak another language Native:
48.8% (9,513)Foreign-born:
91.8% (8,290)
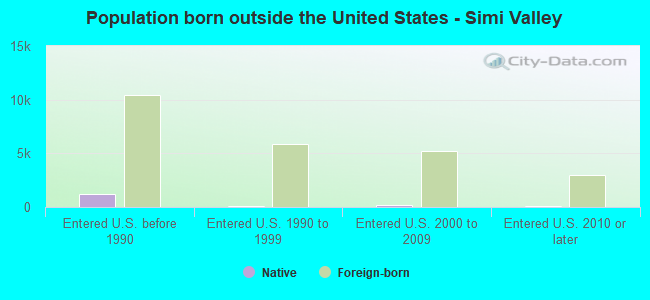
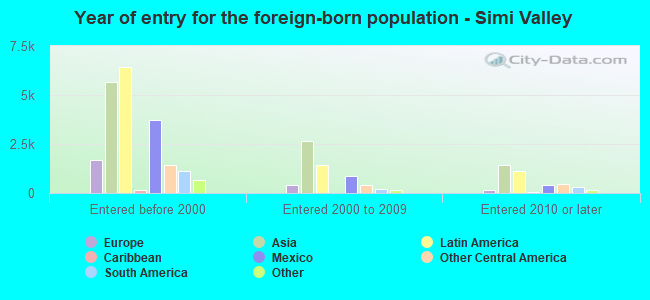
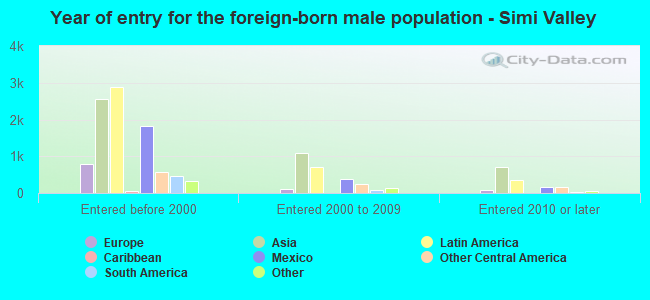
Foreign-born residents in Simi Valley 23,044 residents are foreign born (7.9% Asia , 7.5% Latin America , 2.0% Europe ).
This city:
18.3%California:
100.0%
Marital status for residents in Simi Valley Marital status - White (Caucasian) population 15 years and over
Males 36.9% Never married50.4% Now married0.3% Separated2.8% Widowed9.6% DivorcedFemales 30.8% Never married44.7% Now married1.1% Separated9.5% Widowed13.8% DivorcedWomen who gave birth in the past 12 months Now married:
94.9% (523)Unmarried:
5.1% (28)
Women who did not give birth in the past 12 months Now married:
36.8% (5,943)Unmarried:
63.2% (10,215)
Marital status - Black or African American population 15 years and over
Males 52.7% Never married33.9% Now married3.1% Separated0.8% Widowed9.4% DivorcedFemales 30.2% Never married33.2% Now married0.0% Separated9.5% Widowed27.1% DivorcedWomen who gave birth in the past 12 months Now married:
100.0% (8)Unmarried:
0.0% (0)
Women who did not give birth in the past 12 months Now married:
31.3% (73)Unmarried:
68.7% (161)
Marital status - American Indian / Alaska Native population 15 years and over
Males 8.8% Never married85.6% Now married0.0% Separated0.0% Widowed5.6% DivorcedFemales 9.9% Never married46.1% Now married11.5% Separated14.1% Widowed18.3% DivorcedWomen who gave birth in the past 12 months Now married:
100.0% (25)Unmarried:
0.0% (0)
Women who did not give birth in the past 12 months Now married:
48.9% (26)Unmarried:
51.1% (27)
Marital status - Asian population 15 years and over
Males 32.7% Never married64.4% Now married0.0% Separated2.9% Widowed0.0% DivorcedFemales 24.5% Never married58.1% Now married1.3% Separated12.0% Widowed4.2% DivorcedWomen who gave birth in the past 12 months Now married:
100.0% (108)Unmarried:
0.0% (0)
Women who did not give birth in the past 12 months Now married:
57.3% (2,306)Unmarried:
42.7% (1,717)
Marital status - Native Hawaiian / Pacific Islander population 15 years and over
Males 0.0% Never married86.8% Now married0.0% Separated0.0% Widowed13.2% DivorcedFemales 24.5% Never married56.9% Now married0.0% Separated18.6% Widowed0.0% DivorcedWomen who did not give birth in the past 12 months Now married:
71.9% (39)Unmarried:
28.1% (15)
Marital status - Other race population 15 years and over
Males 41.2% Never married50.6% Now married1.9% Separated0.9% Widowed5.4% DivorcedFemales 39.0% Never married48.1% Now married0.1% Separated3.9% Widowed8.9% DivorcedWomen who gave birth in the past 12 months Now married:
31.9% (32)Unmarried:
68.1% (68)
Women who did not give birth in the past 12 months Now married:
42.8% (695)Unmarried:
57.2% (930)
Marital status - Two or more races population 15 years and over
Males 50.0% Never married37.6% Now married3.3% Separated0.8% Widowed8.4% DivorcedFemales 47.5% Never married37.6% Now married0.6% Separated5.1% Widowed9.2% DivorcedWomen who gave birth in the past 12 months Now married:
59.3% (48)Unmarried:
40.7% (33)
Women who did not give birth in the past 12 months Now married:
31.3% (1,437)Unmarried:
68.7% (3,148)
Marital status - White alone, not Hispanic / Latino population 15 years and over
Males 35.4% Never married51.9% Now married0.3% Separated2.6% Widowed9.8% DivorcedFemales 28.5% Never married46.5% Now married0.9% Separated10.2% Widowed13.8% DivorcedWomen who gave birth in the past 12 months Now married:
100.0% (438)Unmarried:
0.0% (0)
Women who did not give birth in the past 12 months Now married:
37.1% (5,355)Unmarried:
62.9% (9,099)
Marital status - Hispanic or Latino population 15 years and over
Males 50.1% Never married41.5% Now married0.6% Separated2.6% Widowed5.3% DivorcedFemales 45.2% Never married37.8% Now married1.4% Separated4.8% Widowed10.9% DivorcedWomen who gave birth in the past 12 months Now married:
87.0% (244)Unmarried:
13.0% (36)
Women who did not give birth in the past 12 months Now married:
34.8% (2,985)Unmarried:
65.2% (5,581)
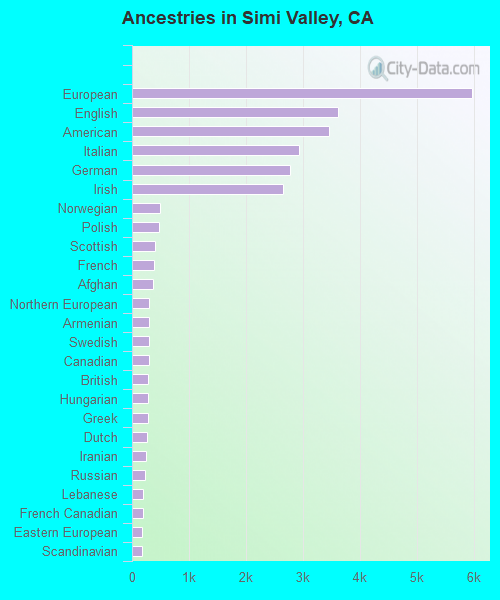
Ancestries in Simi Valley
6,011 9.6% European5,198 8.3% American2,893 4.6% German2,449 3.9% Italian2,265 3.6% Irish2,249 3.6% English754 1.2% Polish563 0.9% Scottish554 0.9% Eastern European422 0.7% Sudanese405 0.6% Norwegian385 0.6% Armenian372 0.6% British351 0.6% Russian348 0.6% Dutch341 0.5% Canadian310 0.5% Iranian276 0.4% Danish268 0.4% Egyptian254 0.4% Afghan253 0.4% French243 0.4% Hungarian231 0.4% Scandinavian212 0.3% Greek194 0.3% Northern European190 0.3% Swedish177 0.3% Scotch-Irish164 0.3% French Canadian152 0.2% Ukrainian132 0.2% Lebanese113 0.2% Turkish88 0.1% Welsh87 0.1% African57 0.09% Serbian56 0.09% Albanian55 0.09% Romanian53 0.08% Palestinian50 0.08% Lithuanian47 0.07% Portuguese47 0.07% Czech38 0.06% Brazilian37 0.06% Arab37 0.06% Moroccan34 0.05% South African32 0.05% Austrian31 0.05% Slovak31 0.05% Swiss31 0.05% Jamaican27 0.04% Croatian26 0.04% Belgian26 0.04% Basque25 0.04% Slavic24 0.04% Assyrian21 0.03% Haitian20 0.03% Australian16 0.03% Syrian15 0.02% Iraqi13 0.02% Celtic13 0.02% Nigerian13 0.02% Icelander13 0.02% Czechoslovakian12 0.02% Slovene11 0.02% Finnish10 0.02% Guyanese9 0.01% Estonian9 0.01% Yugoslavian8 0.01% Bulgarian8 0.01% Israeli6 0.01% New Zealander
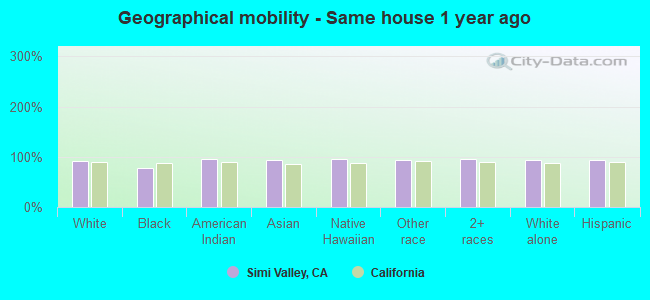
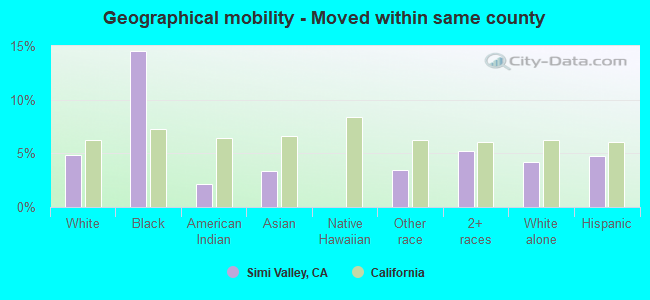
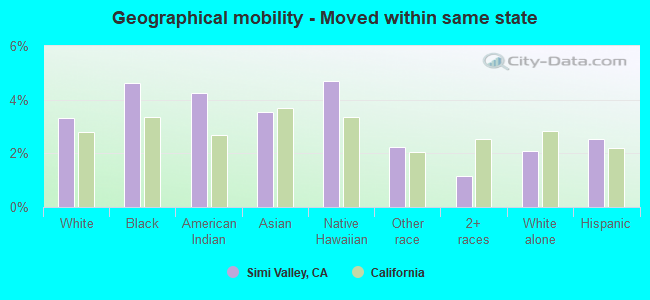
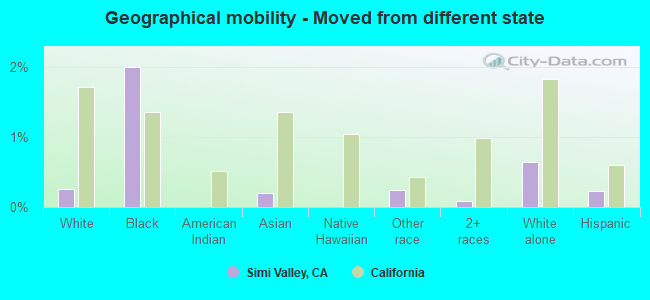
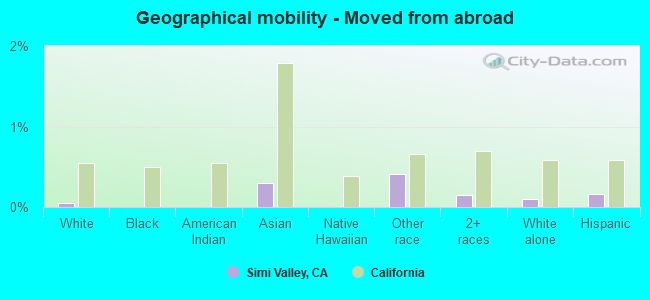
Geographical mobility in Simi Valley Same house 1 year ago 69,083 91.9% White (Caucasian)1,225 76.9% Black or African American629 95.9% American Indian / Alaska Native13,240 94.1% Asian200 95.6% Native Hawaiian / Pacific Islander5,589 93.9% Other race16,254 95.8% Two or more races65,672 93.6% White alone, not Hispanic / Latino30,684 92.7% Hispanic or LatinoMoved within same county 3,663 4.9% White / Caucasian232 14.6% Black or African American14 2.2% American Indian / Alaska Native474 3.4% Asian207 3.5% Other race893 5.3% Two or more races2,948 4.2% White alone, not Hispanic / Latino1,563 4.7% Hispanic or LatinoMoved within same state 2,490 3.3% White / Caucasian73 4.6% Black or African American28 4.3% American Indian / Alaska Native498 3.5% Asian10 4.7% Native Hawaiian / Pacific Islander133 2.2% Other race199 1.2% Two or more races1,462 2.1% White alone, not Hispanic / Latino839 2.5% Hispanic or LatinoMoved from different state 189 0.3% White / Caucasian32 2.0% Black or African American28 0.2% Asian14 0.2% Other race15 0.1% Two or more races446 0.6% White alone, not Hispanic / Latino77 0.2% Hispanic or LatinoMoved from abroad 33 0.0% White41 0.3% Asian25 0.4% Other race25 0.1% Two or more races71 0.1% White alone, not Hispanic / Latino54 0.2% Hispanic or Latino
Children Nativity (place of birth) in Simi Valley
Children under 6 years - Living with two parents Both parents native 2,319 100.0% NativeBoth parents foreign-born 1,419 100.0% NativeOne native, one foreign-born parent 809 100.0% NativeChildren under 6 years - Living with one parent Native parent 1,666 99.8% Native3 0.2% Foreign-bornForeign-born parent 231 50.3% Native228 49.7% Foreign-bornChildren 6 to 17 years - Living with two parents Both parents native 7,382 99.0% Native77 1.0% Foreign-bornBoth parents foreign-born 2,800 97.9% Native60 2.1% Foreign-bornOne native, one foreign-born parent 1,938 100.0% NativeChildren 6 to 17 years - Living with one parent Native parent 2,811 100.0% NativeForeign-born parent 1,059 56.2% Native826 43.8% Foreign-born
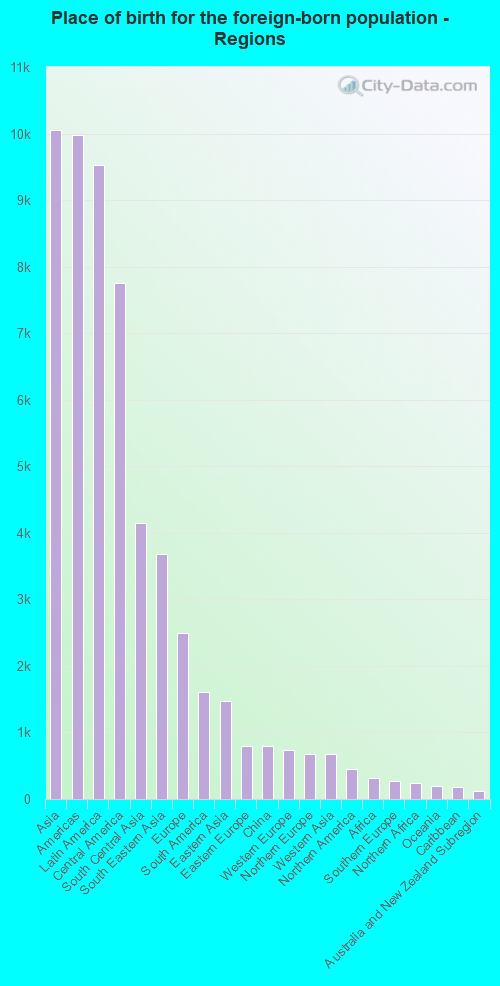
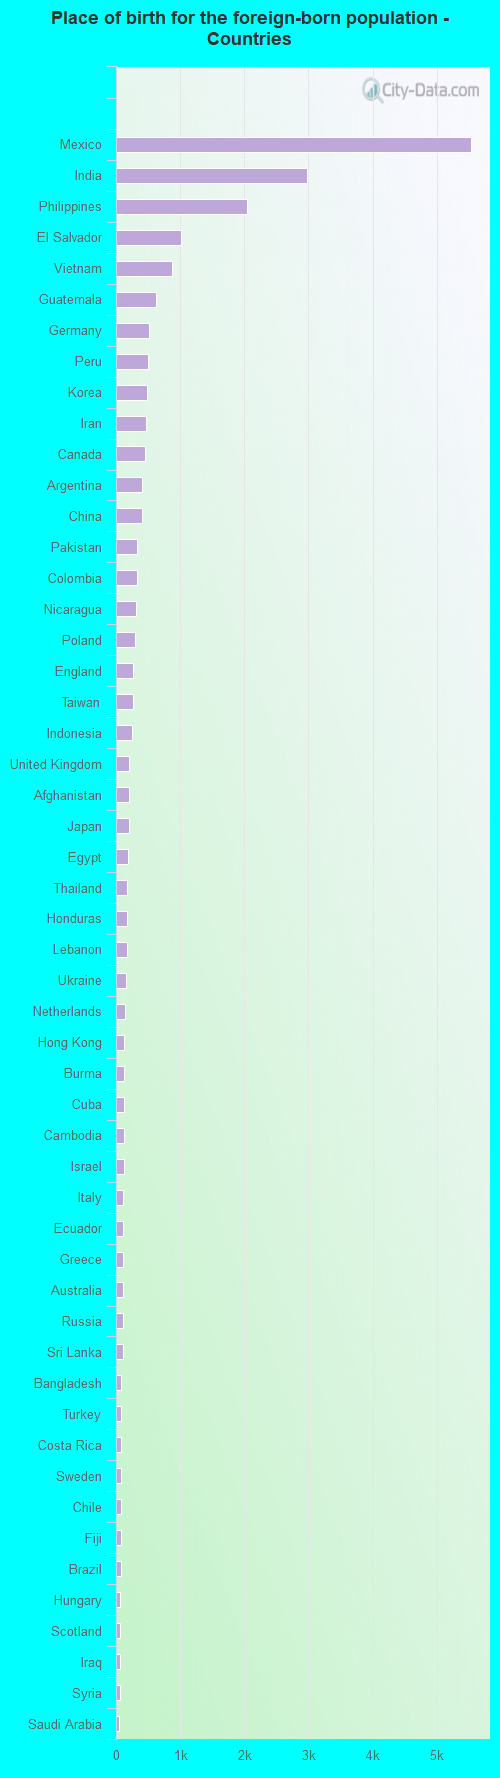
Place of birth for residents in Simi Valley 10,048 Asia9,979 Americas9,534 Latin America7,748 Central America4,152 South Central Asia3,684 South Eastern Asia2,497 Europe1,601 South America1,476 Eastern Asia802 Eastern Europe794 China732 Western Europe679 Northern Europe676 Western Asia445 Northern America316 Africa266 Southern Europe238 Northern Africa202 Oceania184 Caribbean113 Australia and New Zealand Subregion32 Southern Africa23 Western Africa22 Eastern Africa5,537 Mexico2,974 India2,039 Philippines1,015 El Salvador867 Vietnam631 Guatemala511 Germany495 Peru484 Korea463 Iran445 Canada404 Argentina402 China329 Pakistan329 Colombia306 Nicaragua297 Poland265 England260 Taiwan247 Indonesia205 United Kingdom201 Afghanistan198 Japan184 Egypt177 Thailand173 Honduras169 Lebanon156 Ukraine134 Netherlands131 Hong Kong126 Burma124 Cuba124 Cambodia123 Israel115 Italy113 Ecuador111 Greece107 Australia105 Russia102 Sri Lanka81 Bangladesh77 Turkey77 Costa Rica76 Sweden74 Chile71 Fiji71 Brazil69 Hungary61 Scotland56 Iraq55 Syria52 Saudi Arabia50 Malaysia46 Armenia45 Kuwait42 France41 Romania37 Spain36 Venezuela35 Denmark34 Albania32 South Africa29 Belgium28 West Indies28 Sudan26 Laos26 Ireland25 Singapore23 Ghana23 Guyana22 Bulgaria22 Jamaica21 Uruguay18 Lithuania17 Morocco14 Austria10 Serbia9 Haiti9 Belarus8 Norway8 Uganda6 New Zealand6 Panama2 Portugal
Grandparents responsible for own grandchildren in Simi Valley
Grandparents (30 to 59 years) White / Caucasian 45 13.5% Responsible for grandchildren291 86.5% Not responsible for grandchildrenAmerican Indian / Alaska Native 42 100.0% Not responsible for grandchildrenAsian 23 100.0% Not responsible for grandchildrenOther race 58 40.5% Responsible for grandchildren86 59.5% Not responsible for grandchildrenTwo or more races 11 1.9% Responsible for grandchildren539 98.1% Not responsible for grandchildrenWhite alone, not Hispanic / Latino 77 27.2% Responsible for grandchildren208 72.8% Not responsible for grandchildrenHispanic or Latino 110 15.5% Responsible for grandchildren603 84.5% Not responsible for grandchildrenGrandparents (60 years and over) White / Caucasian 152 13.2% Responsible for grandchildren999 86.8% Not responsible for grandchildrenAsian 12 3.6% Responsible for grandchildren318 96.4% Not responsible for grandchildrenOther race 153 100.0% Not responsible for grandchildrenTwo or more races 78 100.0% Responsible for grandchildrenWhite alone, not Hispanic / Latino 159 13.2% Responsible for grandchildren1,041 86.8% Not responsible for grandchildrenHispanic or Latino 14 2.3% Responsible for grandchildren599 97.7% Not responsible for grandchildren