Races in Sheridan, Wisconsin (WI) Detailed Stats
Ancestries, Foreign-born residents, place of birth

Recent posts about races in Sheridan, Wisconsin on our local forum with over 2,400,000 registered users:
 | Relocating to Milwaukee from South Florida (26 replies) |
| Should we move to Cudahy? (5 replies) |
| Moving to Kenosha Area (31 replies) |
| Kenosha (5 replies) |
| moving to WI? (8 replies) |
0.6% of Sheridan, WI residents are foreign-born , which is 705.0% less than the foreign-born rate of 5.0% across the entire state of Wisconsin.
Race distribution in Sheridan

- 47297.7%White alone
- 51.0%Two or more races
- 30.6%Hispanic
- 20.4%American Indian alone
- 10.2%Black alone

2000
2022
-
- 4,681,63087.3%White alone
- 300,2455.6%Black alone
- 192,9213.6%Hispanic
- 87,9951.6%Asian alone
- 51,9211.0%Two or more races
- 43,9800.8%American Indian alone
- 3,6370.07%Other race alone
- 1,3460.03%Native Hawaiian and Other
Pacific Islander alone

-
- 4,654,03179.0%White alone
- 447,0227.6%Hispanic
- 345,6785.9%Black alone
- 217,5323.7%Two or more races
- 172,2422.9%Asian alone
- 33,7620.6%American Indian alone
- 19,6800.3%Other race alone
- 2,5920.04%Native Hawaiian and Other
Pacific Islander alone

Income and house value in Sheridan
- Median household income in 2022
- $76,470White non-Hispanic householders
- $57,041Two or more races householders
- Median 2022 house value
- $214,216White Non-Hispanic householders
- $239,418Two or more races householders
Household income for White non-Hispanic householders

Household income for Two or more races householders

Foreign-born residents in Sheridan
3 residents are foreign born
| This city: | 0.6% |
| Wisconsin: | 3.6% |
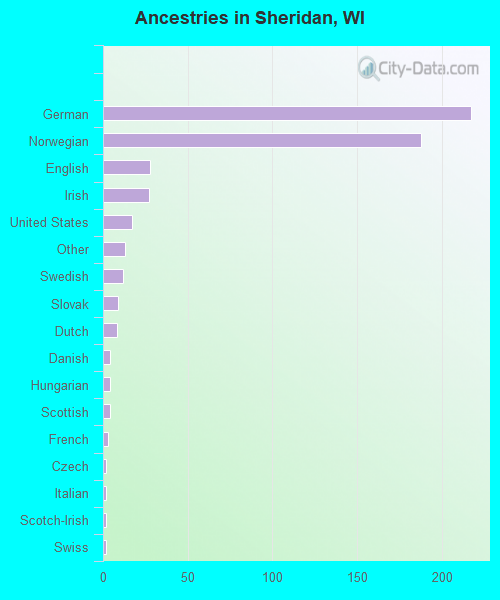
Ancestries in Sheridan

- 21740.0%German
- 18834.7%Norwegian
- 285.2%English
- 275.0%Irish
- 173.1%United States
- 132.4%Other
- 122.2%Swedish
- 91.7%Slovak
- 81.5%Dutch
- 40.7%Danish
- 40.7%Hungarian
- 40.7%Scottish
- 30.6%French
- 20.4%Czech
- 20.4%Italian
- 20.4%Scotch-Irish
- 20.4%Swiss
Zip codes: 54772.