Races in Shelbyville, Tennessee (TN) Detailed Stats
Data:
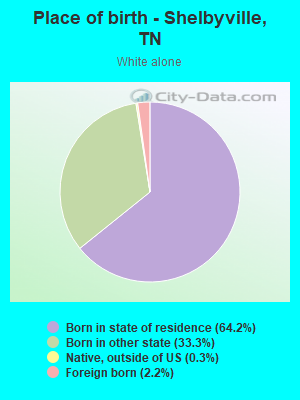
Races - White alone (%)
Races - White alone (% change since 2000)
Races - Black alone (%)
Races - Black alone (% change since 2000)
Races - American Indian alone (%)
Races - American Indian alone (% change since 2000)
Races - Asian alone (%)
Races - Asian alone (% change since 2000)
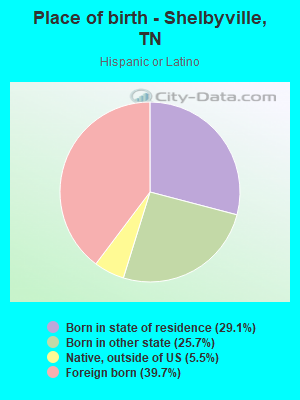
Races - Hispanic (%)
Races - Hispanic (% change since 2000)
Races - Native Hawaiian and Other Pacific Islander alone (%)
Races - Native Hawaiian and Other Pacific Islander alone (% change since 2000)
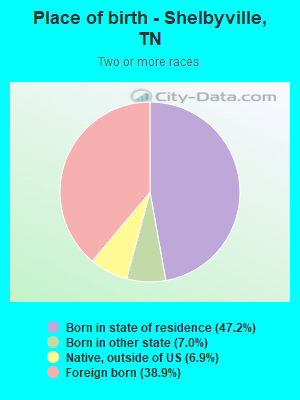
Races - Two or more races(%)
Races - Two or more races(% change since 2000)
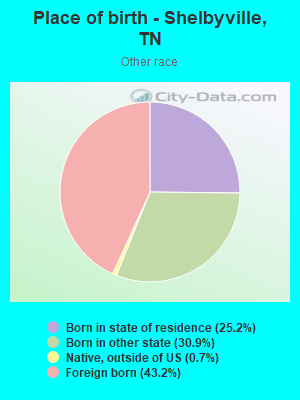
Races - Other race alone (%)
Races - Other race alone (% change since 2000)
Racial diversity
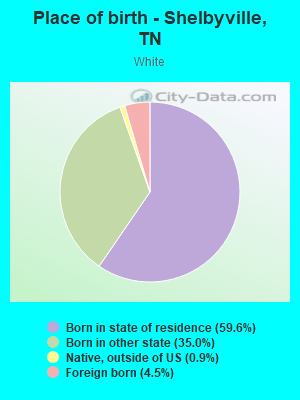
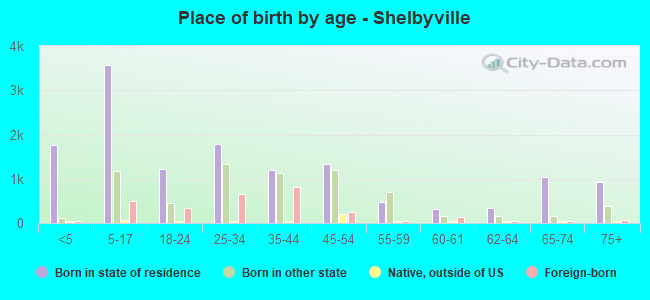
Place of birth - Born in state of residence (%)
Place of birth - Born in state of residence (%) - White
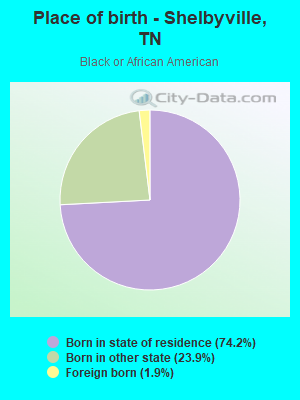
Place of birth - Born in state of residence (%) - Black or African American
Place of birth - Born in state of residence (%) - Asian
Place of birth - Born in state of residence (%) - Hispanic or Latino
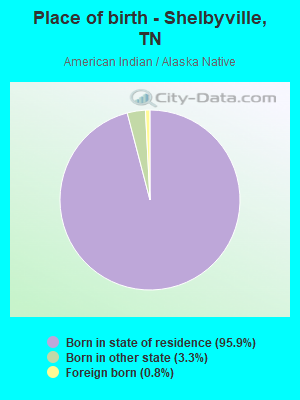
Place of birth - Born in state of residence (%) - American Indian and Alaska Native
Place of birth - Born in state of residence (%) - Multirace
Place of birth - Born in state of residence (%) - Other Race
Place of birth - Born in other state (%)
Place of birth - Born in other state (%) - White
Place of birth - Born in other state (%) - Black or African American
Place of birth - Born in other state (%) - Asian
Place of birth - Born in other state (%) - Hispanic or Latino
Place of birth - Born in other state (%) - American Indian and Alaska Native
Place of birth - Born in other state (%) - Multirace
Place of birth - Born in other state (%) - Other Race
Place of birth - Native, outside of US (%)
Place of birth - Native, outside of US (%) - White
Place of birth - Native, outside of US (%) - Black or African American
Place of birth - Native, outside of US (%) - Asian
Place of birth - Native, outside of US (%) - Hispanic or Latino
Place of birth - Native, outside of US (%) - American Indian and Alaska Native
Place of birth - Native, outside of US (%) - Multirace
Place of birth - Native, outside of US (%) - Other Race
Place of birth - Foreign born (%)
Place of birth - Foreign born (%) - White
Place of birth - Foreign born (%) - Black or African American
Place of birth - Foreign born (%) - Asian
Place of birth - Foreign born (%) - Hispanic or Latino
Place of birth - Foreign born (%) - American Indian and Alaska Native
Place of birth - Foreign born (%) - Multirace
Place of birth - Foreign born (%) - Other Race
Residents speaking English at home (%)
Residents speaking English at home - Born in the United States (%)
Residents speaking English at home - Native, born elsewhere (%)
Residents speaking English at home - Foreign born (%)
Residents speaking Spanish at home (%)
Residents speaking Spanish at home - Born in the United States (%)
Residents speaking Spanish at home - Native, born elsewhere (%)
Residents speaking Spanish at home - Foreign born (%)
Residents speaking other language at home (%)
Residents speaking other language at home - Born in the United States (%)
Residents speaking other language at home - Native, born elsewhere (%)
Residents speaking other language at home - Foreign born (%)
Marital status - Never married (%)
Marital status - Now married (%)
Marital status - Separated (%)
Marital status - Widowed (%)
Marital status - Divorced (%)
Ancestries Reported - Arab (%)
Ancestries Reported - Czech (%)
Ancestries Reported - Danish (%)
Ancestries Reported - Dutch (%)
Ancestries Reported - English (%)
Ancestries Reported - French (%)
Ancestries Reported - French Canadian (%)
Ancestries Reported - German (%)
Ancestries Reported - Greek (%)
Ancestries Reported - Hungarian (%)
Ancestries Reported - Irish (%)
Ancestries Reported - Italian (%)
Ancestries Reported - Lithuanian (%)
Ancestries Reported - Norwegian (%)
Ancestries Reported - Polish (%)
Ancestries Reported - Portuguese (%)
Ancestries Reported - Russian (%)
Ancestries Reported - Scotch-Irish (%)
Ancestries Reported - Scottish (%)
Ancestries Reported - Slovak (%)
Ancestries Reported - Subsaharan African (%)
Ancestries Reported - Swedish (%)
Ancestries Reported - Swiss (%)
Ancestries Reported - Ukrainian (%)
Ancestries Reported - United States (%)
Ancestries Reported - Welsh (%)
Ancestries Reported - West Indian (%)
Ancestries Reported - Other (%)
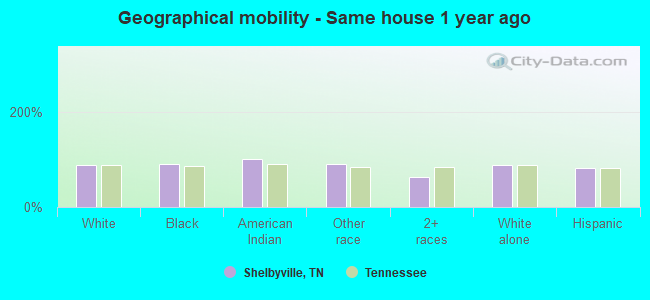
Geographical mobility - Same house 1 year ago (%)
Geographical mobility - Same house 1 year ago (%) - White
Geographical mobility - Same house 1 year ago (%) - Black or African American
Geographical mobility - Same house 1 year ago (%) - Asian
Geographical mobility - Same house 1 year ago (%) - Hispanic or Latino
Geographical mobility - Same house 1 year ago (%) - American Indian and Alaska Native
Geographical mobility - Same house 1 year ago (%) - Multirace
Geographical mobility - Same house 1 year ago (%) - Other Race
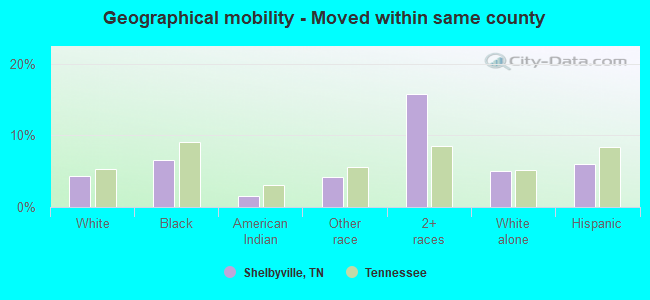
Geographical mobility - Moved within same county (%)
Geographical mobility - Moved within same county (%) - White
Geographical mobility - Moved within same county (%) - Black or African American
Geographical mobility - Moved within same county (%) - Asian
Geographical mobility - Moved within same county (%) - Hispanic or Latino
Geographical mobility - Moved within same county (%) - American Indian and Alaska Native
Geographical mobility - Moved within same county (%) - Multirace
Geographical mobility - Moved within same county (%) - Other Race
Geographical mobility - Moved from different county within same state (%)
Geographical mobility - Moved from different county within same state (%) - White
Geographical mobility - Moved from different county within same state (%) - Black or African American
Geographical mobility - Moved from different county within same state (%) - Asian
Geographical mobility - Moved from different county within same state (%) - Hispanic or Latino
Geographical mobility - Moved from different county within same state (%) - American Indian and Alaska Native
Geographical mobility - Moved from different county within same state (%) - Multirace
Geographical mobility - Moved from different county within same state (%) - Other Race
Geographical mobility - Moved from different state (%)
Geographical mobility - Moved from different state (%) - White
Geographical mobility - Moved from different state (%) - Black or African American
Geographical mobility - Moved from different state (%) - Asian
Geographical mobility - Moved from different state (%) - Hispanic or Latino
Geographical mobility - Moved from different state (%) - American Indian and Alaska Native
Geographical mobility - Moved from different state (%) - Multirace
Geographical mobility - Moved from different state (%) - Other Race
Geographical mobility - Moved from abroad (%)
Geographical mobility - Moved from abroad (%) - White
Geographical mobility - Moved from abroad (%) - Black or African American
Geographical mobility - Moved from abroad (%) - Asian
Geographical mobility - Moved from abroad (%) - Hispanic or Latino
Geographical mobility - Moved from abroad (%) - American Indian and Alaska Native
Geographical mobility - Moved from abroad (%) - Multirace
Geographical mobility - Moved from abroad (%) - Other Race
Place of birth for the foreign-born population - Ireland (%)
Place of birth for the foreign-born population - Denmark (%)
Place of birth for the foreign-born population - Norway (%)
Place of birth for the foreign-born population - Sweden (%)
Place of birth for the foreign-born population - United Kingdom (%)
Place of birth for the foreign-born population - England (%)
Place of birth for the foreign-born population - Scotland (%)
Place of birth for the foreign-born population - Other Northern Europe (%)
Place of birth for the foreign-born population - Austria (%)
Place of birth for the foreign-born population - Belgium (%)
Place of birth for the foreign-born population - France (%)
Place of birth for the foreign-born population - Germany (%)
Place of birth for the foreign-born population - Netherlands (%)
Place of birth for the foreign-born population - Switzerland (%)
Place of birth for the foreign-born population - Other Western Europe (%)
Place of birth for the foreign-born population - Greece (%)
Place of birth for the foreign-born population - Italy (%)
Place of birth for the foreign-born population - Portugal (%)
Place of birth for the foreign-born population - Spain (%)
Place of birth for the foreign-born population - Other Southern Europe (%)
Place of birth for the foreign-born population - Albania (%)
Place of birth for the foreign-born population - Belarus (%)
Place of birth for the foreign-born population - Bosnia and Herzegovina (%)
Place of birth for the foreign-born population - Bulgaria (%)
Place of birth for the foreign-born population - Croatia (%)
Place of birth for the foreign-born population - Czechoslovakia (%)
Place of birth for the foreign-born population - Hungary (%)
Place of birth for the foreign-born population - Latvia (%)
Place of birth for the foreign-born population - Lithuania (%)
Place of birth for the foreign-born population - North Macedonia (Macedonia) (%)
Place of birth for the foreign-born population - Moldova (%)
Place of birth for the foreign-born population - Poland (%)
Place of birth for the foreign-born population - Romania (%)
Place of birth for the foreign-born population - Russia (%)
Place of birth for the foreign-born population - Serbia (%)
Place of birth for the foreign-born population - Ukraine (%)
Place of birth for the foreign-born population - Other Eastern Europe (%)
Place of birth for the foreign-born population - China (%)
Place of birth for the foreign-born population - Hong Kong (%)
Place of birth for the foreign-born population - Taiwan (%)
Place of birth for the foreign-born population - Japan (%)
Place of birth for the foreign-born population - Korea (%)
Place of birth for the foreign-born population - Other Eastern Asia (%)
Place of birth for the foreign-born population - Afghanistan (%)
Place of birth for the foreign-born population - Bangladesh (%)
Place of birth for the foreign-born population - India (%)
Place of birth for the foreign-born population - Iran (%)
Place of birth for the foreign-born population - Kazakhstan (%)
Place of birth for the foreign-born population - Nepal (%)
Place of birth for the foreign-born population - Pakistan (%)
Place of birth for the foreign-born population - Sri Lanka (%)
Place of birth for the foreign-born population - Uzbekistan (%)
Place of birth for the foreign-born population - Other South Central Asia (%)
Place of birth for the foreign-born population - Burma (%)
Place of birth for the foreign-born population - Cambodia (%)
Place of birth for the foreign-born population - Indonesia (%)
Place of birth for the foreign-born population - Laos (%)
Place of birth for the foreign-born population - Malaysia (%)
Place of birth for the foreign-born population - Philippines (%)
Place of birth for the foreign-born population - Singapore (%)
Place of birth for the foreign-born population - Thailand (%)
Place of birth for the foreign-born population - Vietnam (%)
Place of birth for the foreign-born population - Other South Eastern Asia (%)
Place of birth for the foreign-born population - Armenia (%)
Place of birth for the foreign-born population - Iraq (%)
Place of birth for the foreign-born population - Israel (%)
Place of birth for the foreign-born population - Jordan (%)
Place of birth for the foreign-born population - Kuwait (%)
Place of birth for the foreign-born population - Lebanon (%)
Place of birth for the foreign-born population - Saudi Arabia (%)
Place of birth for the foreign-born population - Syria (%)
Place of birth for the foreign-born population - Turkey (%)
Place of birth for the foreign-born population - Yemen (%)
Place of birth for the foreign-born population - Other Western Asia (%)
Place of birth for the foreign-born population - Eritrea (%)
Place of birth for the foreign-born population - Ethiopia (%)
Place of birth for the foreign-born population - Kenya (%)
Place of birth for the foreign-born population - Somalia (%)
Place of birth for the foreign-born population - Uganda (%)
Place of birth for the foreign-born population - Zimbabwe (%)
Place of birth for the foreign-born population - Other Eastern Africa (%)
Place of birth for the foreign-born population - Cameroon (%)
Place of birth for the foreign-born population - Congo (%)
Place of birth for the foreign-born population - Democratic Republic of Congo (Zaire) (%)
Place of birth for the foreign-born population - Other Middle Africa (%)
Place of birth for the foreign-born population - Egypt (%)
Place of birth for the foreign-born population - Morocco (%)
Place of birth for the foreign-born population - Sudan (%)
Place of birth for the foreign-born population - Other Northern Africa (%)
Place of birth for the foreign-born population - South Africa (%)
Place of birth for the foreign-born population - Other Southern Africa (%)
Place of birth for the foreign-born population - Cabo Verde (%)
Place of birth for the foreign-born population - Ghana (%)
Place of birth for the foreign-born population - Liberia (%)
Place of birth for the foreign-born population - Nigeria (%)
Place of birth for the foreign-born population - Senegal (%)
Place of birth for the foreign-born population - Sierra Leone (%)
Place of birth for the foreign-born population - Other Western Africa (%)
Place of birth for the foreign-born population - Australia (%)
Place of birth for the foreign-born population - New Zealand (%)
Place of birth for the foreign-born population - Fiji (%)
Place of birth for the foreign-born population - Micronesia (%)
Place of birth for the foreign-born population - Bahamas (%)
Place of birth for the foreign-born population - Barbados (%)
Place of birth for the foreign-born population - Cuba (%)
Place of birth for the foreign-born population - Dominica (%)
Place of birth for the foreign-born population - Dominican Republic (%)
Place of birth for the foreign-born population - Grenada (%)
Place of birth for the foreign-born population - Haiti (%)
Place of birth for the foreign-born population - Jamaica (%)
Place of birth for the foreign-born population - St. Vincent and the Grenadines (%)
Place of birth for the foreign-born population - Trinidad and Tobago (%)
Place of birth for the foreign-born population - West Indies (%)
Place of birth for the foreign-born population - Other Caribbean (%)
Place of birth for the foreign-born population - Belize (%)
Place of birth for the foreign-born population - Costa Rica (%)
Place of birth for the foreign-born population - El Salvador (%)
Place of birth for the foreign-born population - Guatemala (%)
Place of birth for the foreign-born population - Honduras (%)
Place of birth for the foreign-born population - Mexico (%)
Place of birth for the foreign-born population - Nicaragua (%)
Place of birth for the foreign-born population - Panama (%)
Place of birth for the foreign-born population - Other Central America (%)
Place of birth for the foreign-born population - Argentina (%)
Place of birth for the foreign-born population - Bolivia (%)
Place of birth for the foreign-born population - Brazil (%)
Place of birth for the foreign-born population - Chile (%)
Place of birth for the foreign-born population - Colombia (%)
Place of birth for the foreign-born population - Ecuador (%)
Place of birth for the foreign-born population - Guyana (%)
Place of birth for the foreign-born population - Peru (%)
Place of birth for the foreign-born population - Uruguay (%)
Place of birth for the foreign-born population - Venezuela (%)
Place of birth for the foreign-born population - Other South America (%)
Place of birth for the foreign-born population - Canada (%)
Place of birth for the foreign-born population - Other Northern America (%)
Place of birth for the foreign-born population - Other (%)
Latest news about races in Shelbyville, TN collected exclusively by city-data.com from local newspapers, TV, and radio stations
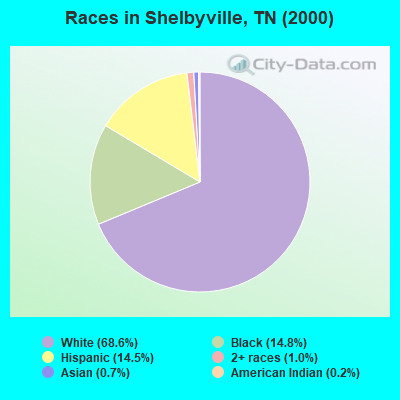
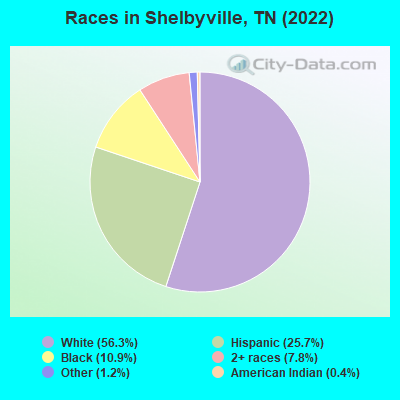
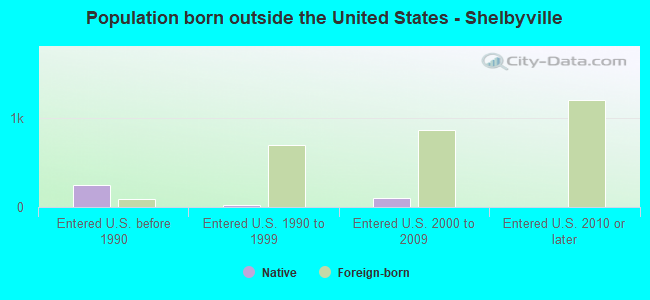
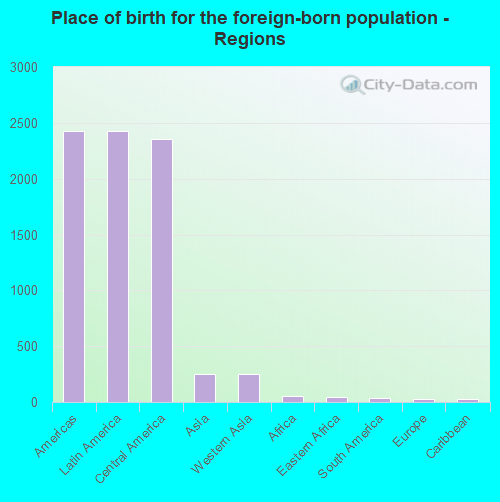
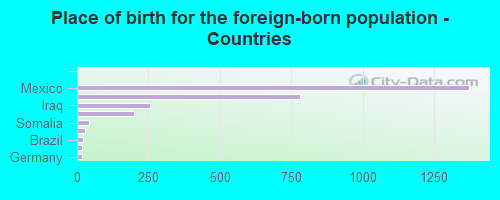
According to 2022 data, the most numerous races in Shelbyville, TN are White alone (13,583 residents), Black alone (2,624 residents), and Hispanic (6,196 residents). 77.9% of Shelbyville residents speak English at home. 11.5% of Shelbyville, TN residents are foreign-born (9.8% born in Latin America), which is 56.3% greater than the foreign-born rate of 5.0% across the entire state of Tennessee.
Race distribution in Shelbyville
2000 2022
4,505,930 79.2% White alone 928,204 16.3% Black alone 123,838 2.2% Hispanic 54,824 1.0% Two or more races 56,077 1.0% Asian alone 13,820 0.2% American Indian alone 4,780 0.08% Other race alone 1,810 0.03% Native Hawaiian and Other
5,070,026 71.9% White alone 1,089,738 15.5% Black alone 442,629 6.3% Hispanic 279,381 4.0% Two or more races 131,817 1.9% Asian alone 26,972 0.4% Other race alone 6,387 0.09% American Indian alone 4,389 0.06% Native Hawaiian and Other
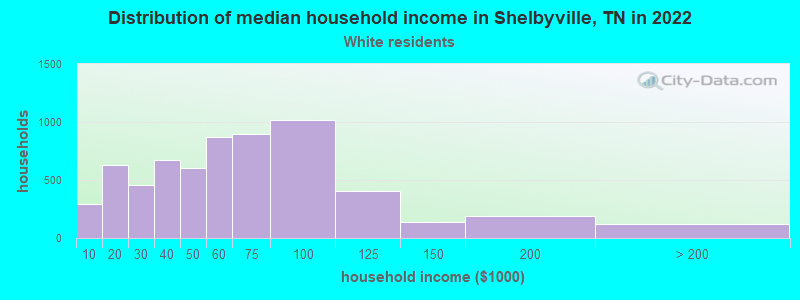
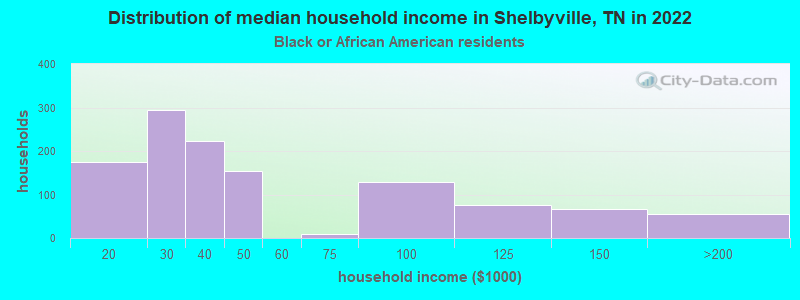
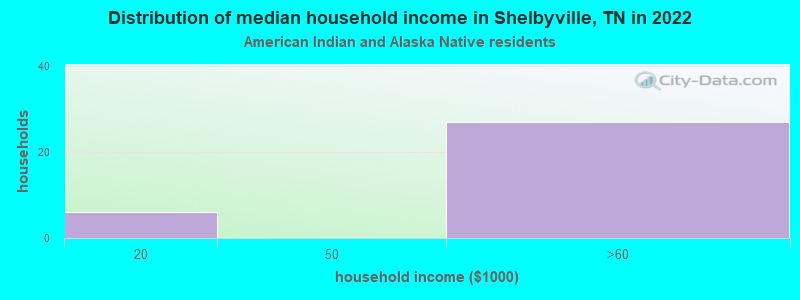
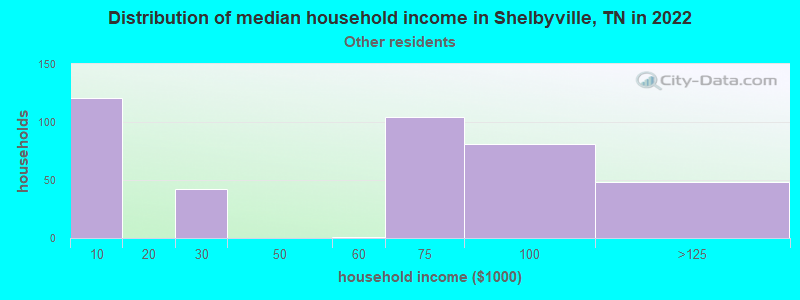
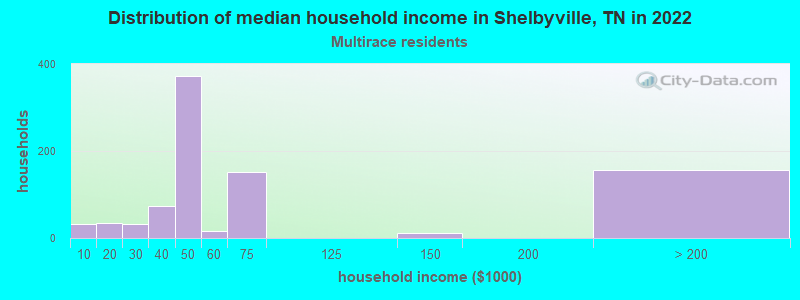
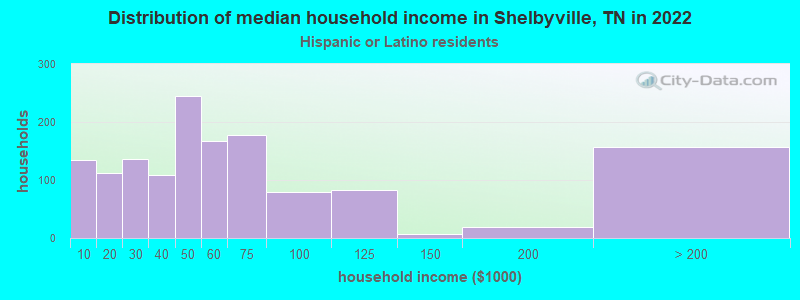
Income and house value in Shelbyville Median household income in 2022 $56,006 White non-Hispanic householders$38,720 Black householders$60,458 Some other race householders$45,627 Two or more races householders$51,630 Hispanic or Latino race householdersMedian 2022 house value $216,689 White Non-Hispanic householders$198,020 Black or African American householders $260,150 Asian householders$229,544 Some other race householders$251,274 Two or more races householders$193,735 Hispanic or Latino householders
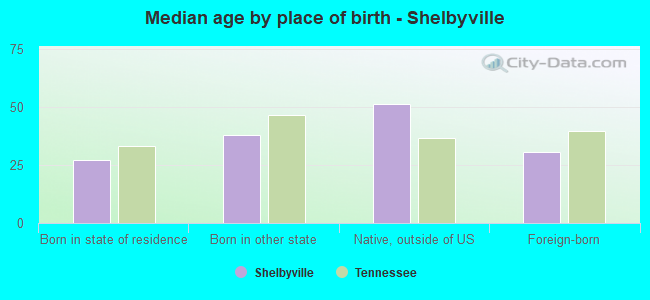
Median age by race in Shelbyville
34.2 Median age for White residents33.5 34.9 45.4 Median age for Black or African American residents36.6 53.2 3.8 Median age for American Indian / Alaska Native residents3.4 21.3 -685,288,639.9 Median age for Asian residents-662,846,226.7 -686,648,500.7 -885,813,147.9 Median age for Native Hawaiian / Pacific Islander residents-951,707,890.7 -735,930,735.2 18.1 Median age for Other race residents33.4 17.7 27.4 Median age for Two or more races residents31.6 18.5 38.0 Median age for White alone residents37.5 38.9 21.5 Median age for Hispanic or Latino residents24.3 20.9
Owner/renter occupied households by race in Shelbyville
House owners and renters - White residents 3,537 55.8% Owner occupied2,803 44.2% Renter occupiedHouse owners and renters - Black or African American residents 552 44.8% Owner occupied680 55.2% Renter occupiedHouse owners and renters - American Indian / Alaska Native residents 12 57.1% Owner occupied9 42.9% Renter occupiedHouse owners and renters - Other race residents 143 36.8% Owner occupied246 63.2% Renter occupiedHouse owners and renters - Two or more races residents 49 5.3% Owner occupied878 94.7% Renter occupiedHouse owners and renters - White alone residents 3,413 59.5% Owner occupied2,326 40.5% Renter occupiedHouse owners and renters - Hispanic or Latino residents 277 19.1% Owner occupied1,174 80.9% Renter occupied
Language usage in Shelbyville
English speakers - Total 77.9% of residents of Shelbyville speak English at home.
20.3% of residents speak Spanish at home 2,456 54.5% Speak English very well2,048 45.5% Speak English less than very well2.2% of residents speak other language at home 464 95.1% Speak English very well24 4.9% Speak English less than very well
English speakers - Born in the United States 79.6% of residents of Shelbyville speak English at home.
18.1% of residents speak Spanish at home 893 71.8% Speak English very well351 28.2% Speak English less than very well2.7% of residents speak other language at home 183 100.0% Speak English very well
English speakers - Native, born elsewhere 75.7% of residents of Shelbyville speak English at home.
25.4% of residents speak Spanish at home 15 15.5% Speak English very well82 84.5% Speak English less than very well
English speakers - Foreign-born 10.6% of residents of Shelbyville speak English at home.
84.5% of residents speak Spanish at home 918 39.4% Speak English very well1,413 60.6% Speak English less than very well5.1% of residents speak other language at home 119 83.8% Speak English very well23 16.2% Speak English less than very well
White (Caucasian) - Speak only English Native:
88.0% (12,524)Foreign-born:
30.2% (219)
White (Caucasian) - Speak another language Native:
10.2% (1,452)Foreign-born:
68.4% (497)
American Indian / Alaska Native - Speak another language Native:
4.4% (6)Foreign-born:
100.0% (4)
Other race - Speak another language Native:
55.4% (453)Foreign-born:
100.0% (749)
Two or more races - Speak only English Native:
80.9% (1,889)Foreign-born:
5.1% (88)
Two or more races - Speak another language Native:
19.8% (463)Foreign-born:
94.8% (1,620)
White alone - Speak only English Native:
98.3% (12,350)Foreign-born:
68.3% (203)
White alone - Speak another language Native:
1.7% (211)Foreign-born:
30.1% (89)
Hispanic or Latino - Speak only English Native:
28.8% (855)Foreign-born:
3.2% (80)
Hispanic or Latino - Speak another language Native:
69.0% (2,045)Foreign-born:
97.2% (2,386)
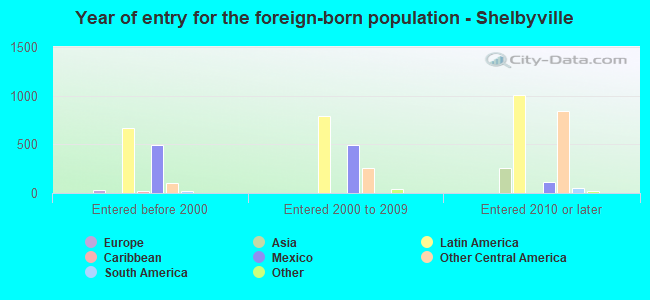
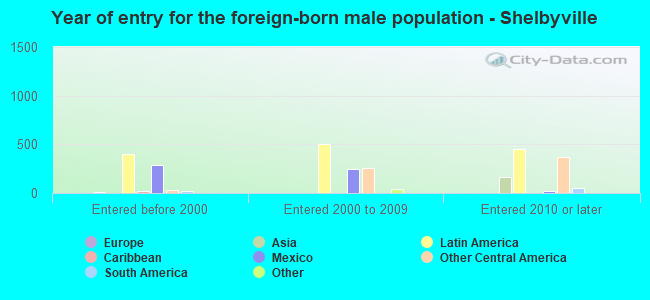
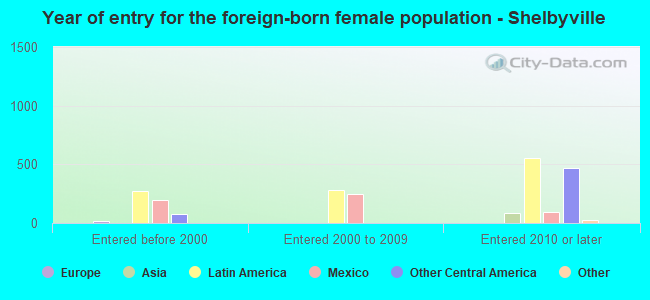
Foreign-born residents in Shelbyville 2,761 residents are foreign born (9.8% Latin America ).
This city:
11.5%Tennessee:
5.4%
Marital status for residents in Shelbyville Marital status - White (Caucasian) population 15 years and over
Males 34.3% Never married43.2% Now married2.2% Separated6.9% Widowed13.4% DivorcedFemales 26.3% Never married40.8% Now married3.2% Separated13.3% Widowed16.4% DivorcedWomen who gave birth in the past 12 months Now married:
56.4% (227)Unmarried:
43.6% (175)
Women who did not give birth in the past 12 months Now married:
44.5% (1,575)Unmarried:
55.5% (1,966)
Marital status - Black or African American population 15 years and over
Males 66.4% Never married17.0% Now married1.6% Separated0.0% Widowed15.0% DivorcedFemales 46.0% Never married15.5% Now married2.6% Separated8.1% Widowed27.7% DivorcedWomen who gave birth in the past 12 months Now married:
70.0% (20)Unmarried:
30.0% (9)
Women who did not give birth in the past 12 months Now married:
30.6% (152)Unmarried:
69.4% (344)
Marital status - American Indian / Alaska Native population 15 years and over
Males 13.3% Never married86.7% Now married0.0% Separated0.0% Widowed0.0% DivorcedFemales 66.7% Never married18.3% Now married0.0% Separated15.0% Widowed0.0% DivorcedWomen who did not give birth in the past 12 months Now married:
21.6% (13)Unmarried:
78.4% (47)
Marital status - Other race population 15 years and over
Males 40.0% Never married54.6% Now married5.4% Separated0.0% Widowed0.0% DivorcedFemales 52.0% Never married48.0% Now married0.0% Separated0.0% Widowed0.0% DivorcedWomen who gave birth in the past 12 months Now married:
100.0% (11)Unmarried:
0.0% (0)
Women who did not give birth in the past 12 months Now married:
45.4% (257)Unmarried:
54.6% (309)
Marital status - Two or more races population 15 years and over
Males 70.1% Never married7.3% Now married3.6% Separated0.0% Widowed19.0% DivorcedFemales 60.4% Never married16.4% Now married0.0% Separated3.6% Widowed19.6% DivorcedWomen who did not give birth in the past 12 months Now married:
14.6% (106)Unmarried:
85.4% (616)
Marital status - White alone, not Hispanic / Latino population 15 years and over
Males 31.8% Never married42.6% Now married2.5% Separated8.0% Widowed15.1% DivorcedFemales 26.3% Never married40.1% Now married3.6% Separated13.8% Widowed16.2% DivorcedWomen who gave birth in the past 12 months Now married:
42.2% (130)Unmarried:
57.8% (178)
Women who did not give birth in the past 12 months Now married:
45.1% (1,371)Unmarried:
54.9% (1,671)
Marital status - Hispanic or Latino population 15 years and over
Males 56.6% Never married33.1% Now married3.5% Separated0.0% Widowed6.8% DivorcedFemales 38.1% Never married43.0% Now married0.0% Separated4.5% Widowed14.4% DivorcedWomen who gave birth in the past 12 months Now married:
100.0% (122)Unmarried:
0.0% (0)
Women who did not give birth in the past 12 months Now married:
38.8% (574)Unmarried:
61.2% (905)
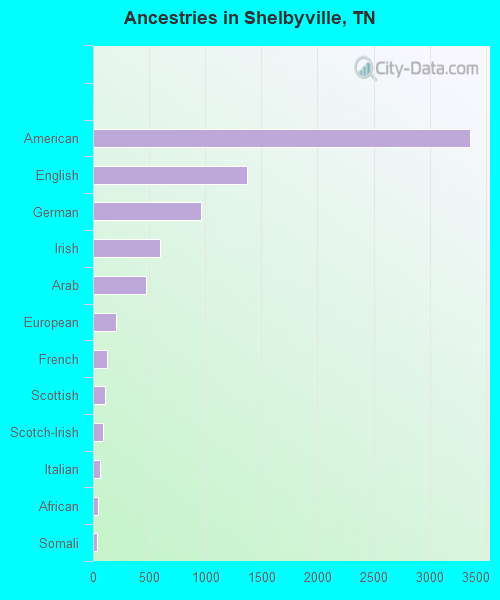
Ancestries in Shelbyville
3,360 24.9% American1,368 10.1% English963 7.1% German600 4.4% Irish475 3.5% Arab208 1.5% European126 0.9% French107 0.8% Scottish86 0.6% Scotch-Irish66 0.5% Italian44 0.3% African39 0.3% Somali16 0.1% Swedish15 0.1% Romanian13 0.10% British11 0.08% Nigerian8 0.06% Dutch
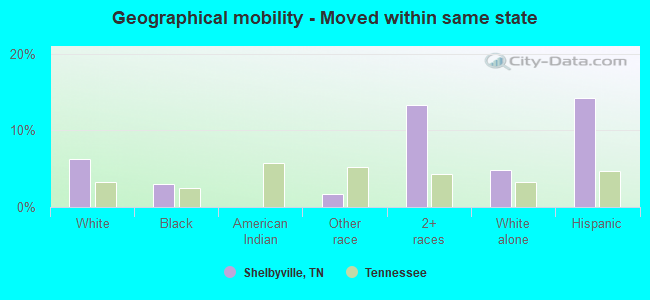
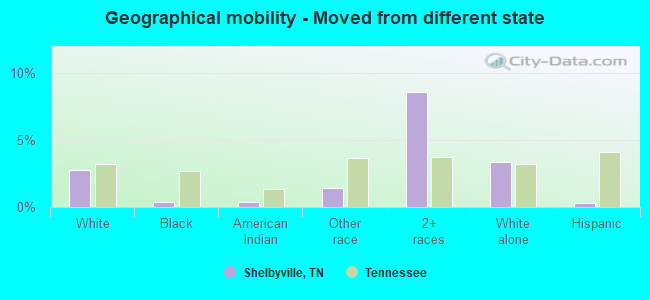
Geographical mobility in Shelbyville Same house 1 year ago 13,749 86.6% White (Caucasian)2,340 89.9% Black or African American565 100.0% American Indian / Alaska Native1,534 91.0% Other race2,589 62.7% Two or more races11,663 86.8% White alone, not Hispanic / Latino4,943 81.3% Hispanic or LatinoMoved within same county 695 4.4% White / Caucasian172 6.6% Black or African American8 1.6% American Indian / Alaska Native71 4.2% Other race650 15.7% Two or more races675 5.0% White alone, not Hispanic / Latino366 6.0% Hispanic or LatinoMoved within same state 984 6.2% White / Caucasian77 3.0% Black or African American28 1.7% Other race550 13.3% Two or more races645 4.8% White alone, not Hispanic / Latino864 14.2% Hispanic or LatinoMoved from different state 440 2.8% White / Caucasian10 0.4% Black or African American2 0.4% American Indian / Alaska Native24 1.4% Other race354 8.6% Two or more races448 3.3% White alone, not Hispanic / Latino19 0.3% Hispanic or Latino
Children Nativity (place of birth) in Shelbyville
Children under 6 years - Living with two parents Both parents native 575 100.0% NativeBoth parents foreign-born 514 100.0% NativeOne native, one foreign-born parent 102 100.0% NativeChildren under 6 years - Living with one parent Native parent 1,025 100.0% NativeForeign-born parent 48 100.0% NativeChildren 6 to 17 years - Living with two parents Both parents native 1,166 100.0% NativeBoth parents foreign-born 136 46.3% Native158 53.7% Foreign-bornOne native, one foreign-born parent 267 100.0% NativeChildren 6 to 17 years - Living with one parent Native parent 1,926 97.9% Native42 2.1% Foreign-bornForeign-born parent 542 67.1% Native265 32.9% Foreign-born
Grandparents responsible for own grandchildren in Shelbyville
Grandparents (30 to 59 years) White / Caucasian 80 40.7% Responsible for grandchildren116 59.3% Not responsible for grandchildrenBlack or African American 48 100.0% Responsible for grandchildrenTwo or more races 6 100.0% Not responsible for grandchildrenWhite alone, not Hispanic / Latino 80 40.2% Responsible for grandchildren119 59.8% Not responsible for grandchildrenGrandparents (60 years and over) White / Caucasian 202 83.1% Responsible for grandchildren41 16.9% Not responsible for grandchildrenWhite alone, not Hispanic / Latino 204 88.5% Responsible for grandchildren27 11.5% Not responsible for grandchildren