Races in Setauket-East Setauket, New York (NY) Detailed Stats
Data:
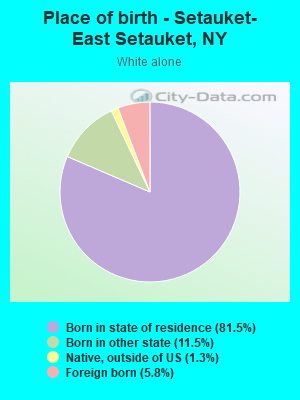
Races - White alone (%)
Races - White alone (% change since 2000)
Races - Black alone (%)
Races - Black alone (% change since 2000)
Races - American Indian alone (%)
Races - American Indian alone (% change since 2000)
Races - Asian alone (%)
Races - Asian alone (% change since 2000)
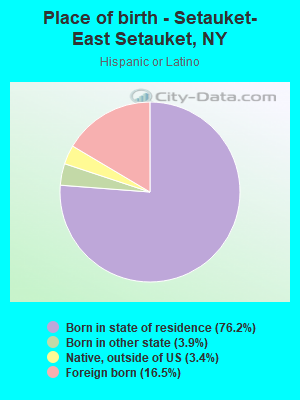
Races - Hispanic (%)
Races - Hispanic (% change since 2000)
Races - Native Hawaiian and Other Pacific Islander alone (%)
Races - Native Hawaiian and Other Pacific Islander alone (% change since 2000)
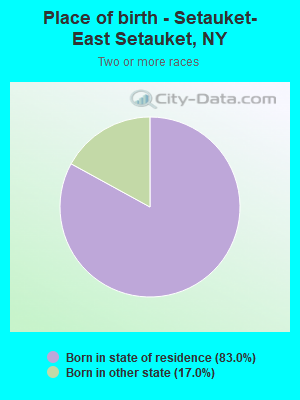
Races - Two or more races(%)
Races - Two or more races(% change since 2000)
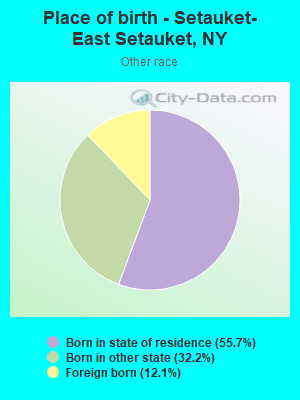
Races - Other race alone (%)
Races - Other race alone (% change since 2000)
Racial diversity
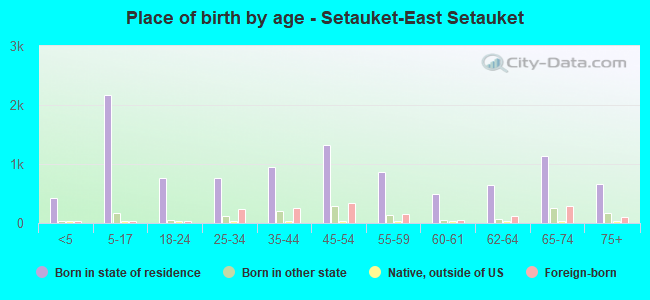
Place of birth - Born in state of residence (%)
Place of birth - Born in state of residence (%) - White
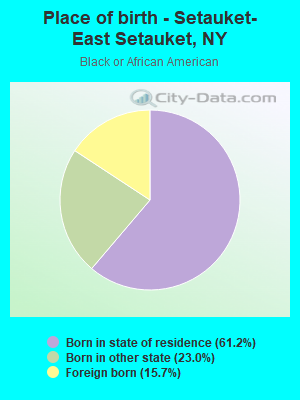
Place of birth - Born in state of residence (%) - Black or African American
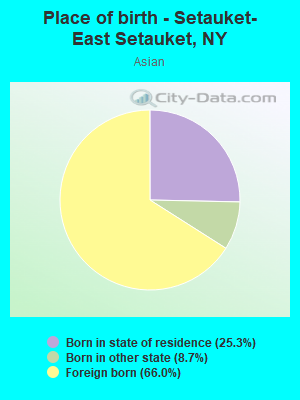
Place of birth - Born in state of residence (%) - Asian
Place of birth - Born in state of residence (%) - Hispanic or Latino
Place of birth - Born in state of residence (%) - American Indian and Alaska Native
Place of birth - Born in state of residence (%) - Multirace
Place of birth - Born in state of residence (%) - Other Race
Place of birth - Born in other state (%)
Place of birth - Born in other state (%) - White
Place of birth - Born in other state (%) - Black or African American
Place of birth - Born in other state (%) - Asian
Place of birth - Born in other state (%) - Hispanic or Latino
Place of birth - Born in other state (%) - American Indian and Alaska Native
Place of birth - Born in other state (%) - Multirace
Place of birth - Born in other state (%) - Other Race
Place of birth - Native, outside of US (%)
Place of birth - Native, outside of US (%) - White
Place of birth - Native, outside of US (%) - Black or African American
Place of birth - Native, outside of US (%) - Asian
Place of birth - Native, outside of US (%) - Hispanic or Latino
Place of birth - Native, outside of US (%) - American Indian and Alaska Native
Place of birth - Native, outside of US (%) - Multirace
Place of birth - Native, outside of US (%) - Other Race
Place of birth - Foreign born (%)
Place of birth - Foreign born (%) - White
Place of birth - Foreign born (%) - Black or African American
Place of birth - Foreign born (%) - Asian
Place of birth - Foreign born (%) - Hispanic or Latino
Place of birth - Foreign born (%) - American Indian and Alaska Native
Place of birth - Foreign born (%) - Multirace
Place of birth - Foreign born (%) - Other Race
Residents speaking English at home (%)
Residents speaking English at home - Born in the United States (%)
Residents speaking English at home - Native, born elsewhere (%)
Residents speaking English at home - Foreign born (%)
Residents speaking Spanish at home (%)
Residents speaking Spanish at home - Born in the United States (%)
Residents speaking Spanish at home - Native, born elsewhere (%)
Residents speaking Spanish at home - Foreign born (%)
Residents speaking other language at home (%)
Residents speaking other language at home - Born in the United States (%)
Residents speaking other language at home - Native, born elsewhere (%)
Residents speaking other language at home - Foreign born (%)
Marital status - Never married (%)
Marital status - Now married (%)
Marital status - Separated (%)
Marital status - Widowed (%)
Marital status - Divorced (%)
Ancestries Reported - Arab (%)
Ancestries Reported - Czech (%)
Ancestries Reported - Danish (%)
Ancestries Reported - Dutch (%)
Ancestries Reported - English (%)
Ancestries Reported - French (%)
Ancestries Reported - French Canadian (%)
Ancestries Reported - German (%)
Ancestries Reported - Greek (%)
Ancestries Reported - Hungarian (%)
Ancestries Reported - Irish (%)
Ancestries Reported - Italian (%)
Ancestries Reported - Lithuanian (%)
Ancestries Reported - Norwegian (%)
Ancestries Reported - Polish (%)
Ancestries Reported - Portuguese (%)
Ancestries Reported - Russian (%)
Ancestries Reported - Scotch-Irish (%)
Ancestries Reported - Scottish (%)
Ancestries Reported - Slovak (%)
Ancestries Reported - Subsaharan African (%)
Ancestries Reported - Swedish (%)
Ancestries Reported - Swiss (%)
Ancestries Reported - Ukrainian (%)
Ancestries Reported - United States (%)
Ancestries Reported - Welsh (%)
Ancestries Reported - West Indian (%)
Ancestries Reported - Other (%)
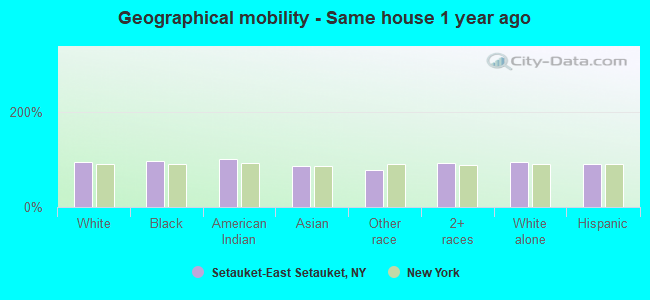
Geographical mobility - Same house 1 year ago (%)
Geographical mobility - Same house 1 year ago (%) - White
Geographical mobility - Same house 1 year ago (%) - Black or African American
Geographical mobility - Same house 1 year ago (%) - Asian
Geographical mobility - Same house 1 year ago (%) - Hispanic or Latino
Geographical mobility - Same house 1 year ago (%) - American Indian and Alaska Native
Geographical mobility - Same house 1 year ago (%) - Multirace
Geographical mobility - Same house 1 year ago (%) - Other Race
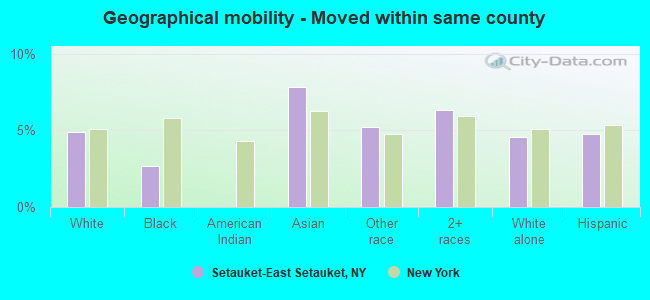
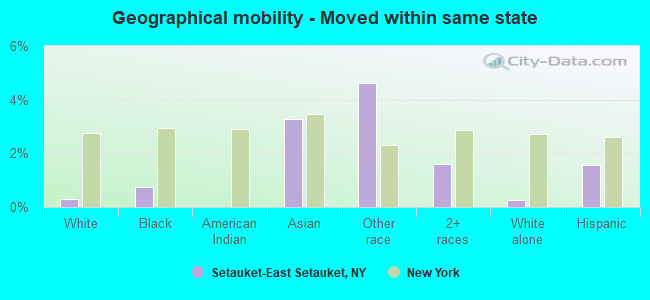
Geographical mobility - Moved within same county (%)
Geographical mobility - Moved within same county (%) - White
Geographical mobility - Moved within same county (%) - Black or African American
Geographical mobility - Moved within same county (%) - Asian
Geographical mobility - Moved within same county (%) - Hispanic or Latino
Geographical mobility - Moved within same county (%) - American Indian and Alaska Native
Geographical mobility - Moved within same county (%) - Multirace
Geographical mobility - Moved within same county (%) - Other Race
Geographical mobility - Moved from different county within same state (%)
Geographical mobility - Moved from different county within same state (%) - White
Geographical mobility - Moved from different county within same state (%) - Black or African American
Geographical mobility - Moved from different county within same state (%) - Asian
Geographical mobility - Moved from different county within same state (%) - Hispanic or Latino
Geographical mobility - Moved from different county within same state (%) - American Indian and Alaska Native
Geographical mobility - Moved from different county within same state (%) - Multirace
Geographical mobility - Moved from different county within same state (%) - Other Race
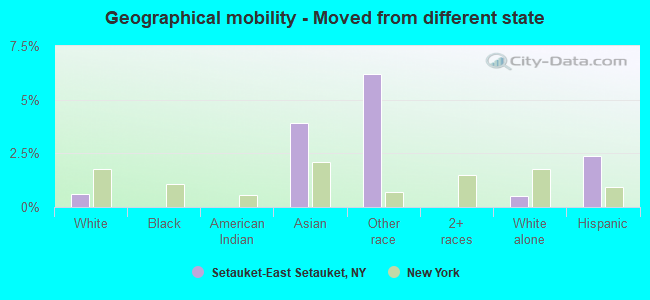
Geographical mobility - Moved from different state (%)
Geographical mobility - Moved from different state (%) - White
Geographical mobility - Moved from different state (%) - Black or African American
Geographical mobility - Moved from different state (%) - Asian
Geographical mobility - Moved from different state (%) - Hispanic or Latino
Geographical mobility - Moved from different state (%) - American Indian and Alaska Native
Geographical mobility - Moved from different state (%) - Multirace
Geographical mobility - Moved from different state (%) - Other Race
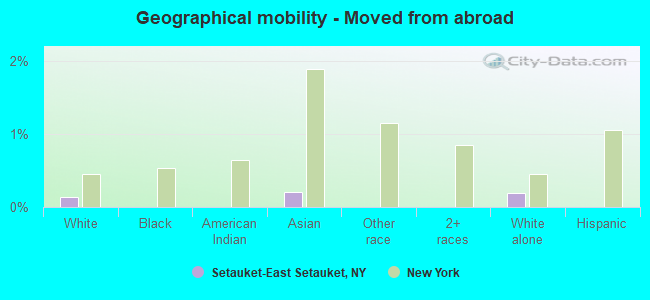
Geographical mobility - Moved from abroad (%)
Geographical mobility - Moved from abroad (%) - White
Geographical mobility - Moved from abroad (%) - Black or African American
Geographical mobility - Moved from abroad (%) - Asian
Geographical mobility - Moved from abroad (%) - Hispanic or Latino
Geographical mobility - Moved from abroad (%) - American Indian and Alaska Native
Geographical mobility - Moved from abroad (%) - Multirace
Geographical mobility - Moved from abroad (%) - Other Race
Place of birth for the foreign-born population - Ireland (%)
Place of birth for the foreign-born population - Denmark (%)
Place of birth for the foreign-born population - Norway (%)
Place of birth for the foreign-born population - Sweden (%)
Place of birth for the foreign-born population - United Kingdom (%)
Place of birth for the foreign-born population - England (%)
Place of birth for the foreign-born population - Scotland (%)
Place of birth for the foreign-born population - Other Northern Europe (%)
Place of birth for the foreign-born population - Austria (%)
Place of birth for the foreign-born population - Belgium (%)
Place of birth for the foreign-born population - France (%)
Place of birth for the foreign-born population - Germany (%)
Place of birth for the foreign-born population - Netherlands (%)
Place of birth for the foreign-born population - Switzerland (%)
Place of birth for the foreign-born population - Other Western Europe (%)
Place of birth for the foreign-born population - Greece (%)
Place of birth for the foreign-born population - Italy (%)
Place of birth for the foreign-born population - Portugal (%)
Place of birth for the foreign-born population - Spain (%)
Place of birth for the foreign-born population - Other Southern Europe (%)
Place of birth for the foreign-born population - Albania (%)
Place of birth for the foreign-born population - Belarus (%)
Place of birth for the foreign-born population - Bosnia and Herzegovina (%)
Place of birth for the foreign-born population - Bulgaria (%)
Place of birth for the foreign-born population - Croatia (%)
Place of birth for the foreign-born population - Czechoslovakia (%)
Place of birth for the foreign-born population - Hungary (%)
Place of birth for the foreign-born population - Latvia (%)
Place of birth for the foreign-born population - Lithuania (%)
Place of birth for the foreign-born population - North Macedonia (Macedonia) (%)
Place of birth for the foreign-born population - Moldova (%)
Place of birth for the foreign-born population - Poland (%)
Place of birth for the foreign-born population - Romania (%)
Place of birth for the foreign-born population - Russia (%)
Place of birth for the foreign-born population - Serbia (%)
Place of birth for the foreign-born population - Ukraine (%)
Place of birth for the foreign-born population - Other Eastern Europe (%)
Place of birth for the foreign-born population - China (%)
Place of birth for the foreign-born population - Hong Kong (%)
Place of birth for the foreign-born population - Taiwan (%)
Place of birth for the foreign-born population - Japan (%)
Place of birth for the foreign-born population - Korea (%)
Place of birth for the foreign-born population - Other Eastern Asia (%)
Place of birth for the foreign-born population - Afghanistan (%)
Place of birth for the foreign-born population - Bangladesh (%)
Place of birth for the foreign-born population - India (%)
Place of birth for the foreign-born population - Iran (%)
Place of birth for the foreign-born population - Kazakhstan (%)
Place of birth for the foreign-born population - Nepal (%)
Place of birth for the foreign-born population - Pakistan (%)
Place of birth for the foreign-born population - Sri Lanka (%)
Place of birth for the foreign-born population - Uzbekistan (%)
Place of birth for the foreign-born population - Other South Central Asia (%)
Place of birth for the foreign-born population - Burma (%)
Place of birth for the foreign-born population - Cambodia (%)
Place of birth for the foreign-born population - Indonesia (%)
Place of birth for the foreign-born population - Laos (%)
Place of birth for the foreign-born population - Malaysia (%)
Place of birth for the foreign-born population - Philippines (%)
Place of birth for the foreign-born population - Singapore (%)
Place of birth for the foreign-born population - Thailand (%)
Place of birth for the foreign-born population - Vietnam (%)
Place of birth for the foreign-born population - Other South Eastern Asia (%)
Place of birth for the foreign-born population - Armenia (%)
Place of birth for the foreign-born population - Iraq (%)
Place of birth for the foreign-born population - Israel (%)
Place of birth for the foreign-born population - Jordan (%)
Place of birth for the foreign-born population - Kuwait (%)
Place of birth for the foreign-born population - Lebanon (%)
Place of birth for the foreign-born population - Saudi Arabia (%)
Place of birth for the foreign-born population - Syria (%)
Place of birth for the foreign-born population - Turkey (%)
Place of birth for the foreign-born population - Yemen (%)
Place of birth for the foreign-born population - Other Western Asia (%)
Place of birth for the foreign-born population - Eritrea (%)
Place of birth for the foreign-born population - Ethiopia (%)
Place of birth for the foreign-born population - Kenya (%)
Place of birth for the foreign-born population - Somalia (%)
Place of birth for the foreign-born population - Uganda (%)
Place of birth for the foreign-born population - Zimbabwe (%)
Place of birth for the foreign-born population - Other Eastern Africa (%)
Place of birth for the foreign-born population - Cameroon (%)
Place of birth for the foreign-born population - Congo (%)
Place of birth for the foreign-born population - Democratic Republic of Congo (Zaire) (%)
Place of birth for the foreign-born population - Other Middle Africa (%)
Place of birth for the foreign-born population - Egypt (%)
Place of birth for the foreign-born population - Morocco (%)
Place of birth for the foreign-born population - Sudan (%)
Place of birth for the foreign-born population - Other Northern Africa (%)
Place of birth for the foreign-born population - South Africa (%)
Place of birth for the foreign-born population - Other Southern Africa (%)
Place of birth for the foreign-born population - Cabo Verde (%)
Place of birth for the foreign-born population - Ghana (%)
Place of birth for the foreign-born population - Liberia (%)
Place of birth for the foreign-born population - Nigeria (%)
Place of birth for the foreign-born population - Senegal (%)
Place of birth for the foreign-born population - Sierra Leone (%)
Place of birth for the foreign-born population - Other Western Africa (%)
Place of birth for the foreign-born population - Australia (%)
Place of birth for the foreign-born population - New Zealand (%)
Place of birth for the foreign-born population - Fiji (%)
Place of birth for the foreign-born population - Micronesia (%)
Place of birth for the foreign-born population - Bahamas (%)
Place of birth for the foreign-born population - Barbados (%)
Place of birth for the foreign-born population - Cuba (%)
Place of birth for the foreign-born population - Dominica (%)
Place of birth for the foreign-born population - Dominican Republic (%)
Place of birth for the foreign-born population - Grenada (%)
Place of birth for the foreign-born population - Haiti (%)
Place of birth for the foreign-born population - Jamaica (%)
Place of birth for the foreign-born population - St. Vincent and the Grenadines (%)
Place of birth for the foreign-born population - Trinidad and Tobago (%)
Place of birth for the foreign-born population - West Indies (%)
Place of birth for the foreign-born population - Other Caribbean (%)
Place of birth for the foreign-born population - Belize (%)
Place of birth for the foreign-born population - Costa Rica (%)
Place of birth for the foreign-born population - El Salvador (%)
Place of birth for the foreign-born population - Guatemala (%)
Place of birth for the foreign-born population - Honduras (%)
Place of birth for the foreign-born population - Mexico (%)
Place of birth for the foreign-born population - Nicaragua (%)
Place of birth for the foreign-born population - Panama (%)
Place of birth for the foreign-born population - Other Central America (%)
Place of birth for the foreign-born population - Argentina (%)
Place of birth for the foreign-born population - Bolivia (%)
Place of birth for the foreign-born population - Brazil (%)
Place of birth for the foreign-born population - Chile (%)
Place of birth for the foreign-born population - Colombia (%)
Place of birth for the foreign-born population - Ecuador (%)
Place of birth for the foreign-born population - Guyana (%)
Place of birth for the foreign-born population - Peru (%)
Place of birth for the foreign-born population - Uruguay (%)
Place of birth for the foreign-born population - Venezuela (%)
Place of birth for the foreign-born population - Other South America (%)
Place of birth for the foreign-born population - Canada (%)
Place of birth for the foreign-born population - Other Northern America (%)
Place of birth for the foreign-born population - Other (%)
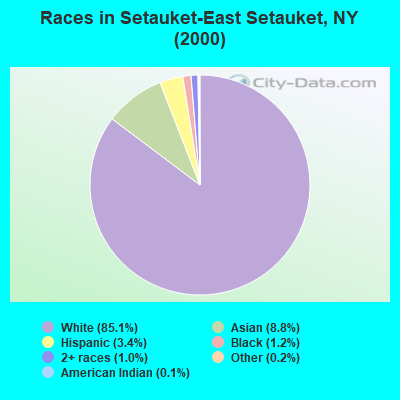
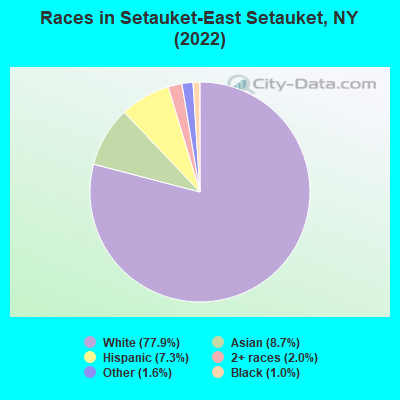
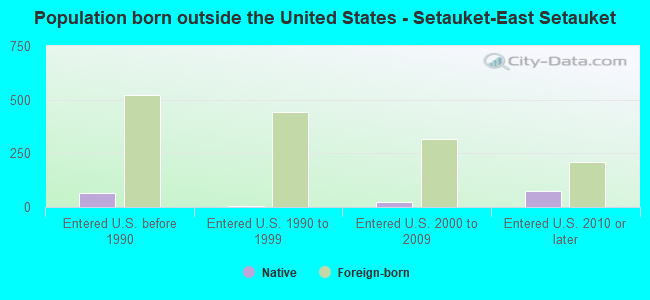
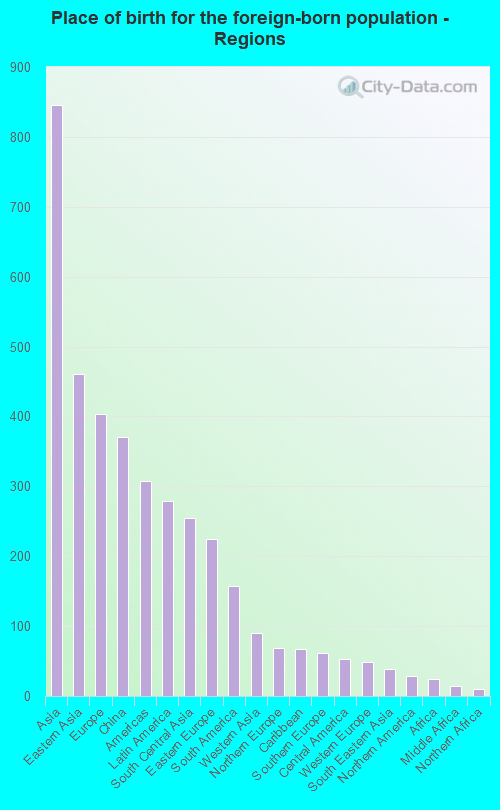
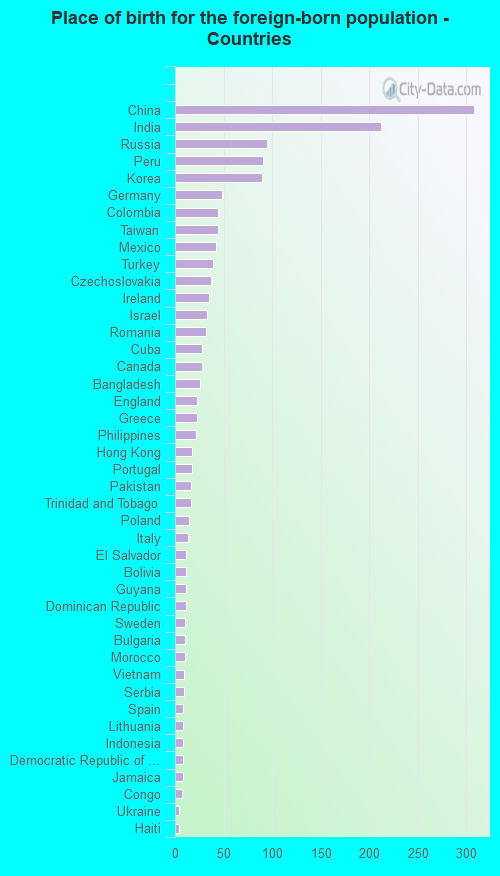
According to 2022 data, the most numerous races in Setauket-East Setauket, NY are White alone (10,487 residents), Hispanic (986 residents), and Black alone (136 residents). 86.5% of Setauket-East Setauket residents speak English at home. 11.8% of Setauket-East Setauket, NY residents are foreign-born (6.2% born in Asia, 2.9% born in Europe, 2.0% born in Latin America), which is 87.0% less than the foreign-born rate of 22.0% across the entire state of New York.
Race distribution in Setauket-East Setauket
2000 2022
11,760,981 62.0% White alone 2,867,583 15.1% Hispanic 2,812,623 14.8% Black alone 1,035,926 5.5% Asian alone 366,116 1.9% Two or more races 75,499 0.4% Other race alone 52,499 0.3% American Indian alone 5,230 0.03% Native Hawaiian and Other
10,408,933 52.9% White alone 3,867,299 19.7% Hispanic 2,633,840 13.4% Black alone 1,776,286 9.0% Asian alone 732,670 3.7% Two or more races 216,110 1.1% Other race alone 35,082 0.2% American Indian alone 6,931 0.04% Native Hawaiian and Other
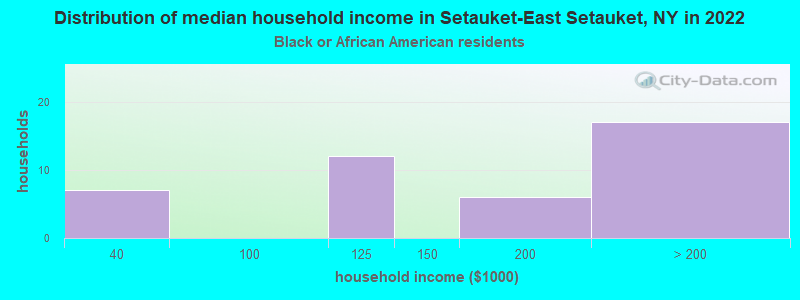
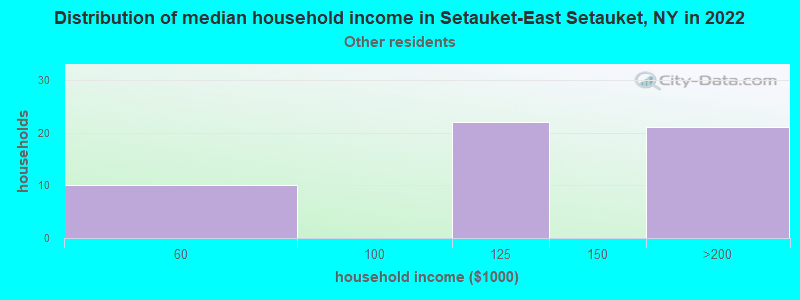
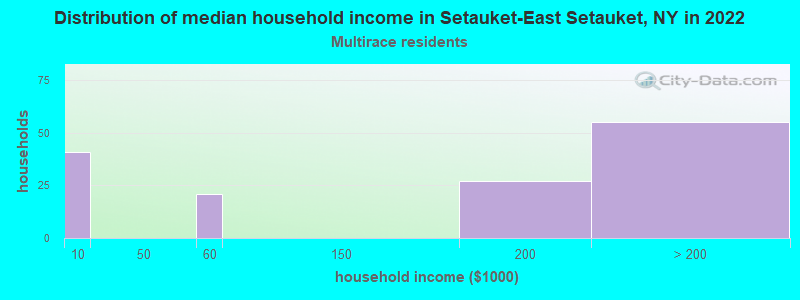
Income and house value in Setauket-East Setauket Median household income in 2022 $188,621 White non-Hispanic householders$171,792 Black householders$57,484 American Indian and Alaska Native householders$166,284 Asian householders$160,298 Some other race householdersover $200,000 Two or more races householdersover $200,000 Hispanic or Latino race householdersMedian 2022 house value $819,590 White Non-Hispanic householders$941,815 Black or African American householders$408,903 American Indian or Alaska Native householders $852,897 Asian householders$441,912 Some other race householders$812,453 Two or more races householders$675,062 Hispanic or Latino householders
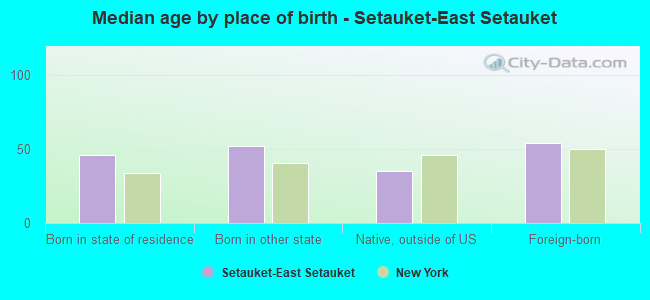
Median age by race in Setauket-East Setauket
48.4 Median age for White residents46.2 50.2 36.6 Median age for Black or African American residents50.0 33.7 45.7 Median age for Asian residents46.3 44.9 36.1 Median age for Other race residents31.9 47.4 22.7 Median age for Two or more races residents23.9 17.9 49.6 Median age for White alone residents46.8 51.1 23.7 Median age for Hispanic or Latino residents28.6 21.4
Owner/renter occupied households by race in Setauket-East Setauket
House owners and renters - White residents 3,948 92.9% Owner occupied300 7.1% Renter occupiedHouse owners and renters - Black or African American residents 32 100.0% Owner occupiedHouse owners and renters - Asian residents 440 86.7% Owner occupied68 13.3% Renter occupiedHouse owners and renters - Other race residents 58 100.0% Owner occupiedHouse owners and renters - Two or more races residents 112 84.5% Owner occupied21 15.5% Renter occupiedHouse owners and renters - White alone residents 3,874 92.6% Owner occupied312 7.4% Renter occupiedHouse owners and renters - Hispanic or Latino residents 160 91.1% Owner occupied16 8.9% Renter occupied
Language usage in Setauket-East Setauket
English speakers - Total 86.5% of residents of Setauket-East Setauket speak English at home.
3.0% of residents speak Spanish at home 352 88.2% Speak English very well47 11.8% Speak English less than very well10.5% of residents speak other language at home 1,121 81.5% Speak English very well255 18.5% Speak English less than very well
English speakers - Born in the United States 93.8% of residents of Setauket-East Setauket speak English at home.
1.3% of residents speak Spanish at home 19 100.0% Speak English very well4.4% of residents speak other language at home 65 100.0% Speak English very well
English speakers - Native, born elsewhere 59.6% of residents of Setauket-East Setauket speak English at home.
21.1% of residents speak Spanish at home 24 68.6% Speak English very well11 31.4% Speak English less than very well24.1% of residents speak other language at home 40 100.0% Speak English very well
English speakers - Foreign-born 32.2% of residents of Setauket-East Setauket speak English at home.
7.1% of residents speak Spanish at home 96 84.2% Speak English very well18 15.8% Speak English less than very well62.1% of residents speak other language at home 777 78.2% Speak English very well217 21.8% Speak English less than very well
White (Caucasian) - Speak only English Native:
97.4% (9,740)Foreign-born:
52.7% (310)
White (Caucasian) - Speak another language Native:
3.7% (369)Foreign-born:
50.2% (296)
Black or African American - Speak only English Native:
95.3% (111)Foreign-born:
78.1% (17)
Black or African American - Speak another language Native:
4.9% (6)Foreign-born:
19.0% (4)
Asian - Speak only English Native:
54.5% (197)Foreign-born:
9.5% (74)
Asian - Speak another language Native:
46.0% (166)Foreign-born:
91.3% (708)
Other race - Speak only English Native:
99.4% (183)Foreign-born:
62.0% (19)
Other race - Speak another language Native:
25.9% (48)Foreign-born:
45.2% (14)
White alone - Speak only English Native:
97.2% (9,375)Foreign-born:
55.5% (296)
White alone - Speak another language Native:
2.8% (271)Foreign-born:
45.4% (243)
Hispanic or Latino - Speak only English Native:
83.4% (681)Foreign-born:
36.3% (57)
Hispanic or Latino - Speak another language Native:
23.3% (190)Foreign-born:
68.3% (108)
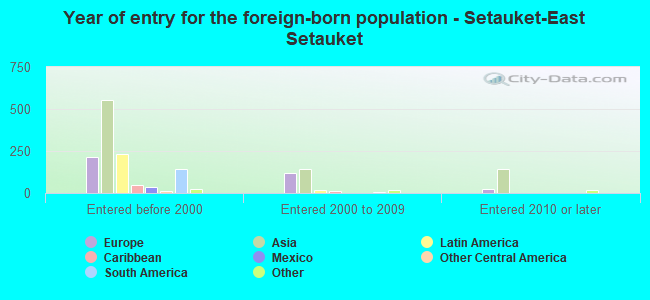
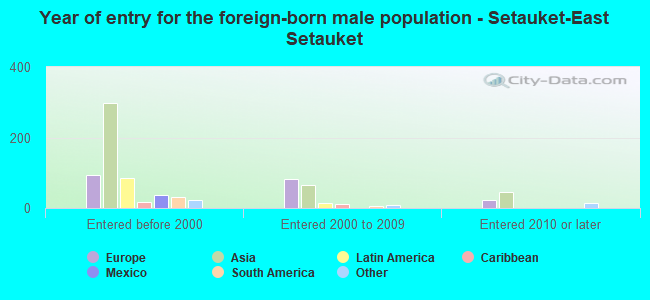
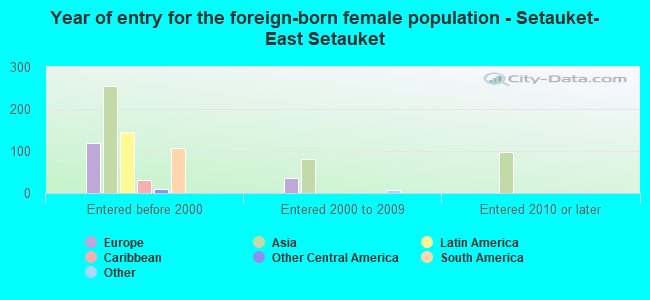
Foreign-born residents in Setauket-East Setauket 1,583 residents are foreign born (6.2% Asia , 2.9% Europe , 2.0% Latin America ).
This city:
11.8%New York:
100.0%
Marital status for residents in Setauket-East Setauket Marital status - White (Caucasian) population 15 years and over
Males 29.0% Never married58.8% Now married1.1% Separated2.4% Widowed8.7% DivorcedFemales 20.6% Never married57.9% Now married1.1% Separated9.2% Widowed11.1% DivorcedWomen who gave birth in the past 12 months Now married:
83.3% (84)Unmarried:
16.7% (17)
Women who did not give birth in the past 12 months Now married:
49.6% (926)Unmarried:
50.4% (940)
Marital status - Black or African American population 15 years and over
Males 23.3% Never married76.7% Now married0.0% Separated0.0% Widowed0.0% DivorcedFemales 21.6% Never married52.7% Now married0.0% Separated10.8% Widowed14.9% DivorcedWomen who did not give birth in the past 12 months Now married:
64.1% (23)Unmarried:
35.9% (13)
Marital status - Asian population 15 years and over
Males 29.3% Never married70.7% Now married0.0% Separated0.0% Widowed0.0% DivorcedFemales 15.0% Never married73.8% Now married3.0% Separated2.1% Widowed6.1% DivorcedWomen who gave birth in the past 12 months Now married:
100.0% (10)Unmarried:
0.0% (0)
Women who did not give birth in the past 12 months Now married:
72.2% (171)Unmarried:
27.8% (66)
Marital status - Other race population 15 years and over
Males 36.4% Never married47.0% Now married0.0% Separated0.0% Widowed16.7% DivorcedFemales 31.5% Never married28.8% Now married0.0% Separated21.9% Widowed17.8% DivorcedWomen who did not give birth in the past 12 months Now married:
23.4% (13)Unmarried:
76.6% (41)
Marital status - Two or more races population 15 years and over
Males 61.4% Never married38.6% Now married0.0% Separated0.0% Widowed0.0% DivorcedFemales 57.9% Never married42.1% Now married0.0% Separated0.0% Widowed0.0% DivorcedWomen who did not give birth in the past 12 months Now married:
0.0% (0)Unmarried:
100.0% (60)
Marital status - White alone, not Hispanic / Latino population 15 years and over
Males 28.5% Never married59.2% Now married1.2% Separated2.3% Widowed8.9% DivorcedFemales 19.5% Never married58.6% Now married1.1% Separated9.7% Widowed11.1% DivorcedWomen who gave birth in the past 12 months Now married:
83.3% (88)Unmarried:
16.7% (18)
Women who did not give birth in the past 12 months Now married:
50.6% (899)Unmarried:
49.4% (877)
Marital status - Hispanic or Latino population 15 years and over
Males 38.8% Never married49.7% Now married0.0% Separated3.2% Widowed8.2% DivorcedFemales 46.1% Never married43.0% Now married1.6% Separated0.0% Widowed9.3% DivorcedWomen who did not give birth in the past 12 months Now married:
35.0% (75)Unmarried:
65.0% (140)
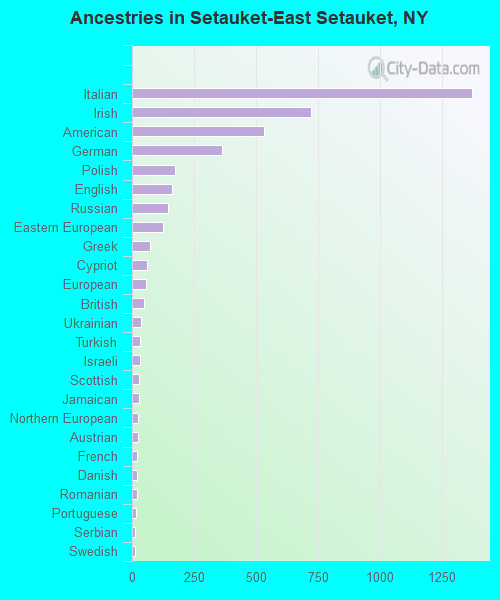
Ancestries in Setauket-East Setauket
1,373 22.2% Italian724 11.7% Irish533 8.6% American365 5.9% German173 2.8% Polish163 2.6% English146 2.4% Russian126 2.0% Eastern European73 1.2% Greek62 1.0% Cypriot58 0.9% European50 0.8% British37 0.6% Ukrainian34 0.5% Turkish32 0.5% Israeli30 0.5% Scottish29 0.5% Jamaican25 0.4% Northern European23 0.4% Austrian22 0.4% French22 0.4% Danish21 0.3% Romanian16 0.3% Portuguese14 0.2% Serbian14 0.2% Swedish13 0.2% Czech9 0.1% Armenian9 0.1% Hungarian9 0.1% Canadian8 0.1% Albanian7 0.1% Lithuanian7 0.1% Slavic6 0.10% Norwegian6 0.10% Slovak6 0.10% Belgian4 0.06% Swiss
Children Nativity (place of birth) in Setauket-East Setauket
Children under 6 years - Living with two parents Both parents native 294 100.0% NativeBoth parents foreign-born 24 100.0% NativeOne native, one foreign-born parent 167 100.0% NativeChildren under 6 years - Living with one parent Native parent 48 100.0% NativeChildren 6 to 17 years - Living with two parents Both parents native 1,454 98.8% Native18 1.2% Foreign-bornBoth parents foreign-born 149 100.0% NativeOne native, one foreign-born parent 229 98.9% Native3 1.1% Foreign-bornChildren 6 to 17 years - Living with one parent Native parent 335 100.0% NativeForeign-born parent 34 58.0% Native24 42.0% Foreign-born
Grandparents responsible for own grandchildren in Setauket-East Setauket
Grandparents (30 to 59 years) White / Caucasian 10 100.0% Not responsible for grandchildrenWhite alone, not Hispanic / Latino 11 100.0% Not responsible for grandchildrenGrandparents (60 years and over) White / Caucasian 12 13.6% Responsible for grandchildren79 86.4% Not responsible for grandchildrenWhite alone, not Hispanic / Latino 13 12.5% Responsible for grandchildren88 87.5% Not responsible for grandchildren