Races in Sequatchie Valley, Tennessee (TN) Detailed Stats
Ancestries, Foreign-born residents, place of birth
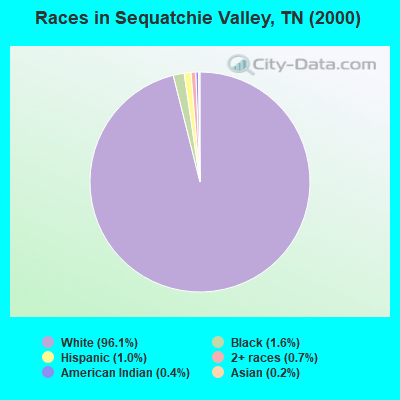
Race distribution in Sequatchie Valley

- 4,97396.1%White alone
- 851.6%Black alone
- 511.0%Hispanic
- 370.7%Two or more races
- 190.4%American Indian alone
- 80.2%Asian alone
- 20.04%Other race alone
- 10.02%Native Hawaiian and Other
Pacific Islander alone
2000
2022
-
- 4,505,93079.2%White alone
- 928,20416.3%Black alone
- 123,8382.2%Hispanic
- 54,8241.0%Two or more races
- 56,0771.0%Asian alone
- 13,8200.2%American Indian alone
- 4,7800.08%Other race alone
- 1,8100.03%Native Hawaiian and Other
Pacific Islander alone

-
- 5,070,02671.9%White alone
- 1,089,73815.5%Black alone
- 442,6296.3%Hispanic
- 279,3814.0%Two or more races
- 131,8171.9%Asian alone
- 26,9720.4%Other race alone
- 6,3870.09%American Indian alone
- 4,3890.06%Native Hawaiian and Other
Pacific Islander alone

Income and house value in Sequatchie Valley
- Median household income in 2022
- $51,683White non-Hispanic householders
- $39,029Black householders
- $22,129American Indian and Alaska Native householders
- $23,582Asian householders
- $58,126Some other race householders
- $40,473Two or more races householders
- $33,207Hispanic or Latino race householders
- Median 2022 house value
- $212,876White Non-Hispanic householders
- $109,251Black or African American householders
- $162,840American Indian or Alaska Native householders
- $133,232Some other race householders
- $111,027Two or more races householders
- $133,232Hispanic or Latino householders
Household income for White non-Hispanic householders

Household income for Black householders

Household income for American Indian and Alaska Native householders

Household income for Asian householders

Household income for Two or more races householders

Household income for Hispanic or Latino race householders

Zip code: 37367