Races in Seminole, Oklahoma (OK) Detailed Stats
Ancestries, Foreign-born residents, place of birth
Settings
X


Recent posts about races in Seminole, Oklahoma on our local forum with over 2,400,000 registered users:
 | Cushing chosen for $5.5 billion refinery investment (14 replies) |
| I'm Choctaw...Now What? (63 replies) |
| Should Oklahoma be a midwest state, southern state, or both? (604 replies) |
| Move to Guthrie ?? (43 replies) |
| The real "Lone Ranger" (51 replies) |
| Confederate Flags in OK? (163 replies) |
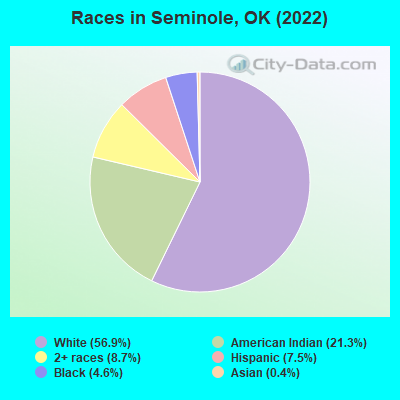
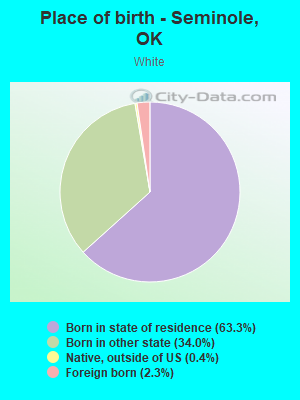
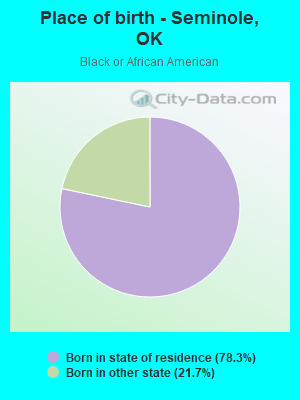
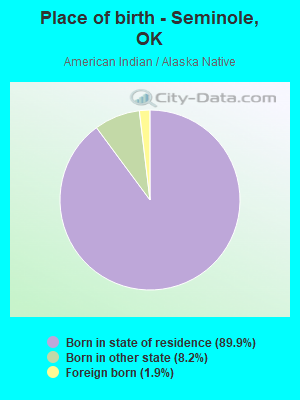
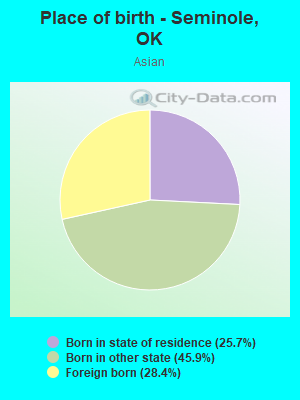
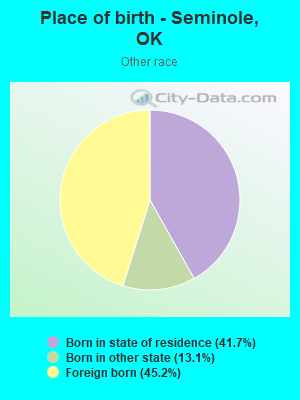
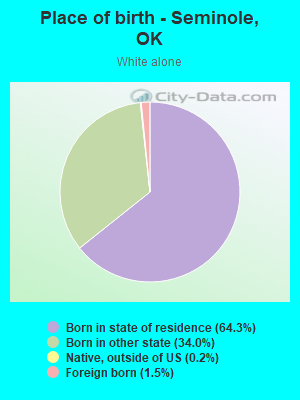
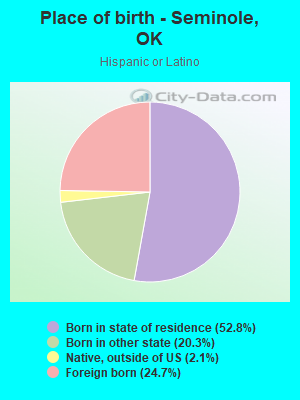
According to 2022 data, the most numerous races in Seminole, OK are White alone (4,116 residents), Hispanic (540 residents), and Two or more races (631 residents). 96.1% of Seminole residents speak English at home. 3.2% of Seminole, OK residents are foreign-born (2.1% born in Latin America, 0.6% born in Asia, 0.3% born in Europe), which is 90.3% less than the foreign-born rate of 6.0% across the entire state of Oklahoma.
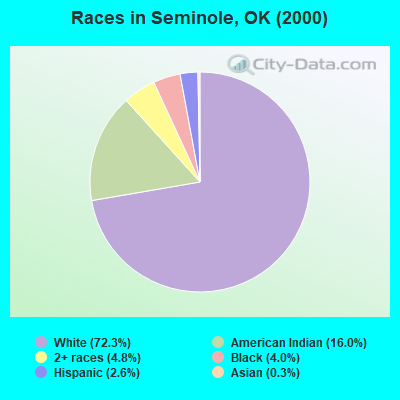
Race distribution in Seminole
2000
2022

- 4,98672.3%White alone
- 1,10216.0%American Indian alone
- 3304.8%Two or more races
- 2744.0%Black alone
- 1802.6%Hispanic
- 210.3%Asian alone
- 30.04%Other race alone
- 30.04%Native Hawaiian and Other
Pacific Islander alone
-
- 4,11656.9%White alone
- 1,53921.3%American Indian alone
- 6318.7%Two or more races
- 5407.5%Hispanic
- 3354.6%Black alone
- 270.4%Asian alone
- 70.10%Other race alone
2000
2022
-
- 2,556,36874.1%White alone
- 266,1587.7%American Indian alone
- 257,9817.5%Black alone
- 179,3045.2%Hispanic
- 140,2494.1%Two or more races
- 46,1721.3%Asian alone
- 2,3220.07%Other race alone
- 2,1000.06%Native Hawaiian and Other
Pacific Islander alone

-
- 2,517,40362.6%White alone
- 486,69212.1%Hispanic
- 364,4539.1%Two or more races
- 273,6506.8%American Indian alone
- 268,5436.7%Black alone
- 92,6722.3%Asian alone
- 10,7860.3%Other race alone
- 5,6010.1%Native Hawaiian and Other
Pacific Islander alone

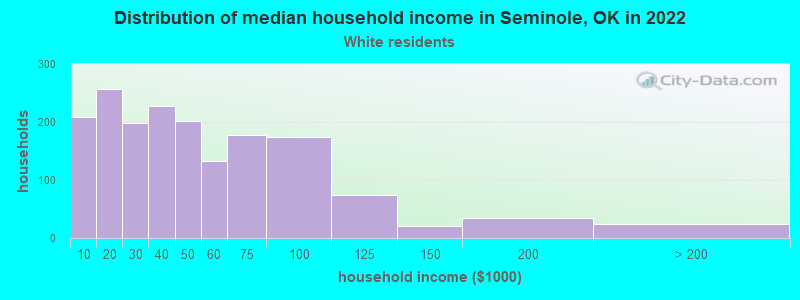
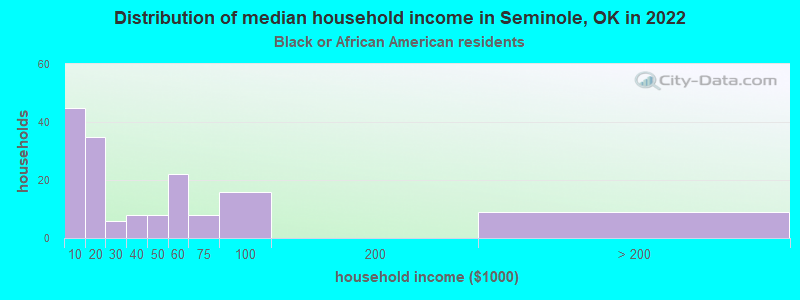
Income and house value in Seminole
- Median household income in 2022
- $38,898White non-Hispanic householders
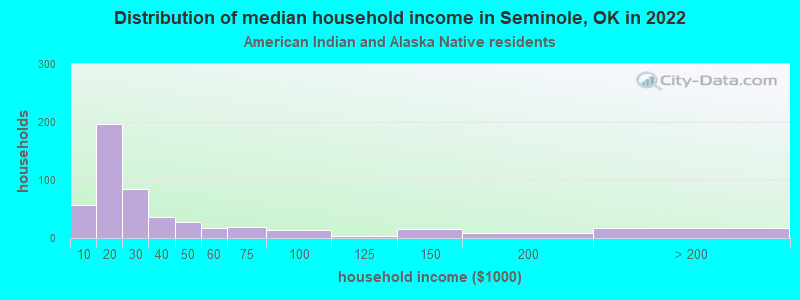
- $20,164American Indian and Alaska Native householders
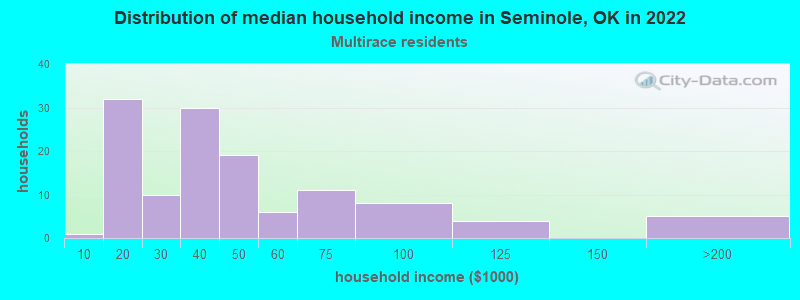
- $32,701Two or more races householders
- $26,486Hispanic or Latino race householders
- Median 2022 house value
- $90,926White Non-Hispanic householders
- $49,416Black or African American householders
- $88,554American Indian or Alaska Native householders
- $79,066Two or more races householders
- $65,822Hispanic or Latino householders
Household income for White non-Hispanic householders
Household income for Black householders
Household income for American Indian and Alaska Native householders
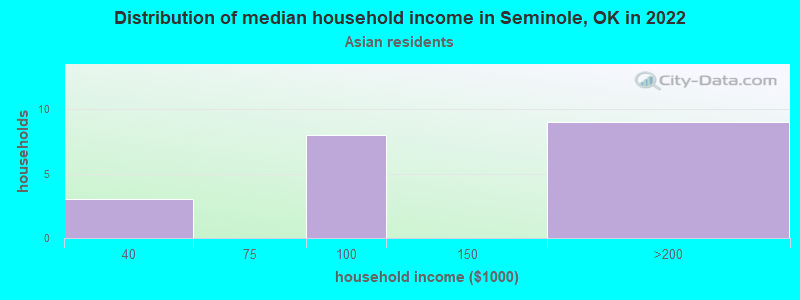
Household income for Asian householders
Household income for Some other race householders
Household income for Two or more races householders
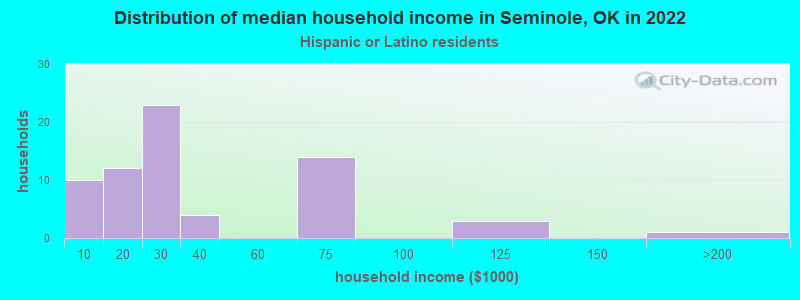
Household income for Hispanic or Latino race householders
Median age by race in Seminole
- 41.4Median age for White residents
- 37.9Males
- 43.4Females
- 28.8Median age for Black or African American residents
- 29.3Males
- 28.7Females
- 25.5Median age for American Indian / Alaska Native residents
- 26.3Males
- 25.0Females
- 38.6Median age for Asian residents
- -662,601,625.4Males
- 57.5Females
- -725,225,224.5Median age for Native Hawaiian / Pacific Islander residents
- -675,324,674.6Males
- -767,251,461.2Females
- 72.6Median age for Other race residents
- -664,359,860.9Males
- -690,821,255.3Females
- 14.4Median age for Two or more races residents
- 18.5Males
- 14.4Females
- 40.9Median age for White alone residents
- 37.8Males
- 43.4Females
- 21.2Median age for Hispanic or Latino residents
- 20.0Males
- 25.9Females
Owner/renter occupied households by race in Seminole
- House owners and renters - White residents
- 1,05362.6%Owner occupied
- 62837.4%Renter occupied
- House owners and renters - Black or African American residents
- 3923.7%Owner occupied
- 12476.3%Renter occupied
- House owners and renters - American Indian / Alaska Native residents
- 15431.8%Owner occupied
- 33168.2%Renter occupied
- House owners and renters - Asian residents
- 1354.9%Owner occupied
- 1045.1%Renter occupied
- House owners and renters - Other race residents
- 17100.0%Owner occupied
- House owners and renters - Two or more races residents
- 6651.6%Owner occupied
- 6248.4%Renter occupied
- House owners and renters - White alone residents
- 1,04762.8%Owner occupied
- 61937.2%Renter occupied
- House owners and renters - Hispanic or Latino residents
- 3853.8%Owner occupied
- 3246.2%Renter occupied
Language usage in Seminole
- English speakers - Total
- 96.1% of residents of Seminole speak English at home.
- 2.9% of residents speak Spanish at home
- 11156.1%Speak English very well
- 8743.9%Speak English less than very well
- 0.9% of residents speak other language at home
- 4572.6%Speak English very well
- 1727.4%Speak English less than very well
- English speakers - Born in the United States
- 97.3% of residents of Seminole speak English at home.
- 2.1% of residents speak Spanish at home
- 37100.0%Speak English very well
- 0.4% of residents speak other language at home
- 7100.0%Speak English very well
All residents speak only English at home
- English speakers - Foreign-born
- 33.8% of residents of Seminole speak English at home.
- 58.3% of residents speak Spanish at home
- 5239.1%Speak English very well
- 8160.9%Speak English less than very well
- 6.1% of residents speak other language at home
- 857.1%Speak English very well
- 642.9%Speak English less than very well
White (Caucasian) - Speak only English
| Native: | 100.0% (3,876) |
| Foreign-born: | 35.5% (34) |
White (Caucasian) - Speak another language
| Native: | 0.6% (23) |
| Foreign-born: | 65.6% (64) |
American Indian / Alaska Native - Speak only English
| Native: | 96.4% (1,456) |
| Foreign-born: | 93.4% (29) |
Asian - Speak only English
| Native: | 99.7% (24) |
| Foreign-born: | 28.5% (3) |
Other race - Speak only English
| Native: | 95.5% (10) |
| Foreign-born: | 100.0% (8) |
Two or more races - Speak only English
| Native: | 95.7% (652) |
| Foreign-born: | 52.3% (10) |
Two or more races - Speak another language
| Native: | 0.2% (2) |
| Foreign-born: | 28.0% (6) |
White alone - Speak only English
| Native: | 100.0% (3,819) |
| Foreign-born: | 38.7% (25) |
Hispanic or Latino - Speak only English
| Native: | 87.7% (323) |
| Foreign-born: | 24.1% (32) |
Hispanic or Latino - Speak another language
| Native: | 13.4% (49) |
| Foreign-born: | 77.7% (103) |
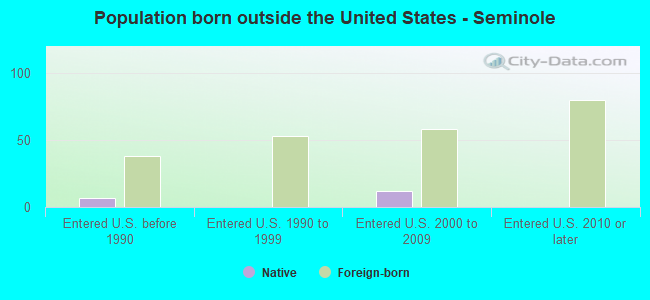
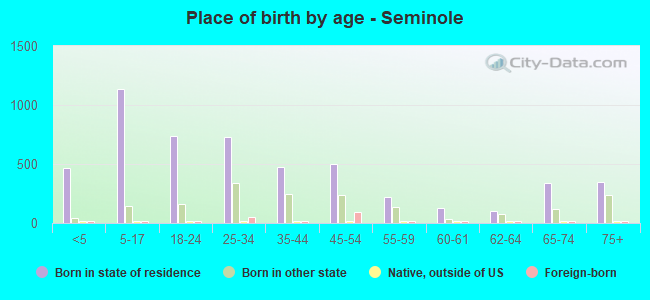
Foreign-born residents in Seminole
228 residents are foreign born (2.1% Latin America, 0.6% Asia, 0.3% Europe).
| This city: | 3.2% |
| Oklahoma: | 6.1% |

Marital status for residents in Seminole
Marital status - White (Caucasian) population 15 years and over
- Males
- 32.0%Never married
- 48.4%Now married
- 1.4%Separated
- 5.5%Widowed
- 12.7%Divorced
- Females
- 21.9%Never married
- 41.3%Now married
- 3.1%Separated
- 19.0%Widowed
- 14.6%Divorced
Women who gave birth in the past 12 months
| Now married: | 72.7% (69) |
| Unmarried: | 27.3% (26) |
Women who did not give birth in the past 12 months
| Now married: | 40.3% (367) |
| Unmarried: | 59.7% (545) |
Marital status - Black or African American population 15 years and over
- Males
- 45.5%Never married
- 28.7%Now married
- 6.2%Separated
- 4.5%Widowed
- 15.2%Divorced
- Females
- 74.5%Never married
- 0.0%Now married
- 0.0%Separated
- 9.7%Widowed
- 15.9%Divorced
Women who did not give birth in the past 12 months
| Now married: | 0.0% (0) |
| Unmarried: | 100.0% (78) |
Marital status - American Indian / Alaska Native population 15 years and over
- Males
- 53.2%Never married
- 25.6%Now married
- 0.0%Separated
- 0.0%Widowed
- 21.2%Divorced
- Females
- 40.1%Never married
- 30.5%Now married
- 3.7%Separated
- 17.4%Widowed
- 8.3%Divorced
Women who gave birth in the past 12 months
| Now married: | 47.4% (9) |
| Unmarried: | 52.6% (10) |
Women who did not give birth in the past 12 months
| Now married: | 36.9% (185) |
| Unmarried: | 63.1% (315) |
Marital status - Asian population 15 years and over
- Males
- 0.0%Never married
- 100.0%Now married
- 0.0%Separated
- 0.0%Widowed
- 0.0%Divorced
- Females
- 0.0%Never married
- 71.4%Now married
- 0.0%Separated
- 28.6%Widowed
- 0.0%Divorced
Marital status - Other race population 15 years and over
- Males
- 0.0%Never married
- 0.0%Now married
- 0.0%Separated
- 100.0%Widowed
- 0.0%Divorced
- Females
- 0.0%Never married
- 0.0%Now married
- 0.0%Separated
- 77.8%Widowed
- 22.2%Divorced
Marital status - Two or more races population 15 years and over
- Males
- 49.7%Never married
- 37.1%Now married
- 6.3%Separated
- 0.6%Widowed
- 6.3%Divorced
- Females
- 37.6%Never married
- 37.6%Now married
- 5.7%Separated
- 5.0%Widowed
- 14.2%Divorced
Women who gave birth in the past 12 months
| Now married: | 100.0% (20) |
| Unmarried: | 0.0% (0) |
Women who did not give birth in the past 12 months
| Now married: | 37.4% (57) |
| Unmarried: | 62.6% (96) |
Marital status - White alone, not Hispanic / Latino population 15 years and over
- Males
- 31.2%Never married
- 48.2%Now married
- 1.5%Separated
- 5.9%Widowed
- 13.3%Divorced
- Females
- 21.3%Never married
- 40.6%Now married
- 3.3%Separated
- 19.7%Widowed
- 15.1%Divorced
Women who gave birth in the past 12 months
| Now married: | 72.7% (72) |
| Unmarried: | 27.3% (27) |
Women who did not give birth in the past 12 months
| Now married: | 40.5% (357) |
| Unmarried: | 59.5% (525) |
Marital status - Hispanic or Latino population 15 years and over
- Males
- 56.9%Never married
- 39.0%Now married
- 0.0%Separated
- 0.5%Widowed
- 3.6%Divorced
- Females
- 50.3%Never married
- 35.0%Now married
- 0.0%Separated
- 10.8%Widowed
- 3.8%Divorced
Women who did not give birth in the past 12 months
| Now married: | 21.7% (25) |
| Unmarried: | 78.3% (91) |
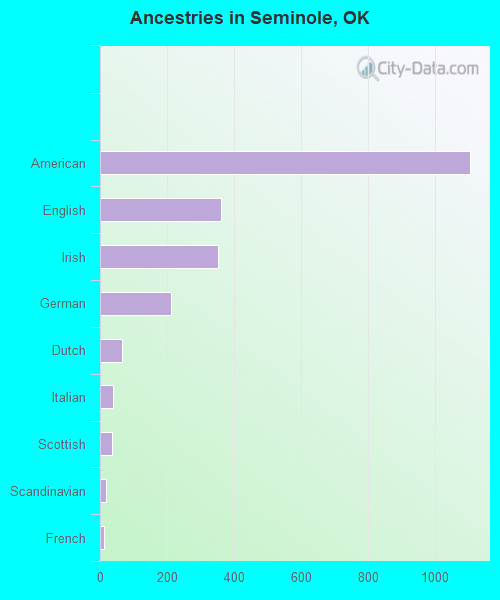
Ancestries in Seminole

- 1,10629.6%American
- 3629.7%English
- 3519.4%Irish
- 2115.6%German
- 661.8%Dutch
- 391.0%Italian
- 350.9%Scottish
- 190.5%Scandinavian
- 130.3%French
- 70.2%British
- 70.2%Canadian
- 60.2%Belgian
- 60.2%European
- 60.2%Scotch-Irish
- 50.1%Yugoslavian
- 20.05%Ukrainian
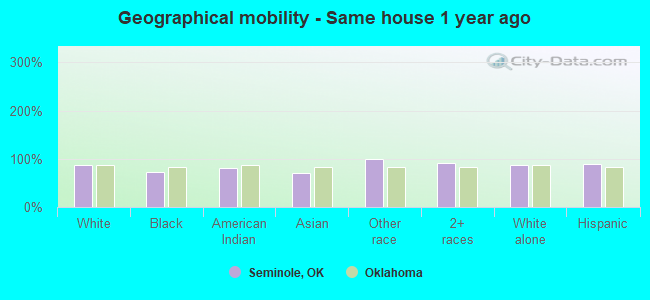
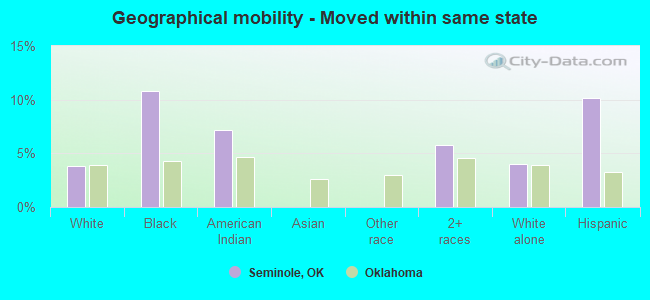
Geographical mobility in Seminole

- Same house 1 year ago
- 3,63887.5%White (Caucasian)
- 25571.8%Black or African American
- 1,34579.9%American Indian / Alaska Native
- 2371.4%Asian
- 1899.2%Other race
- 76090.7%Two or more races
- 3,49986.5%White alone, not Hispanic / Latino
- 48589.9%Hispanic or Latino
-
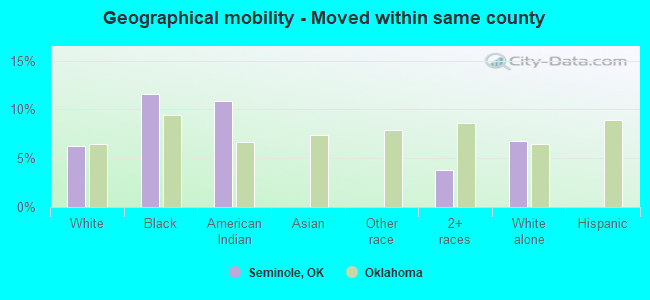
- Moved within same county
- 2596.2%White / Caucasian
- 4111.5%Black or African American
- 18310.9%American Indian / Alaska Native
- 323.8%Two or more races
- 2736.8%White alone, not Hispanic / Latino
-
- Moved within same state
- 1593.8%White / Caucasian
- 3810.8%Black or African American
- 1207.1%American Indian / Alaska Native
- 495.8%Two or more races
- 1634.0%White alone, not Hispanic / Latino
- 5510.2%Hispanic or Latino
-
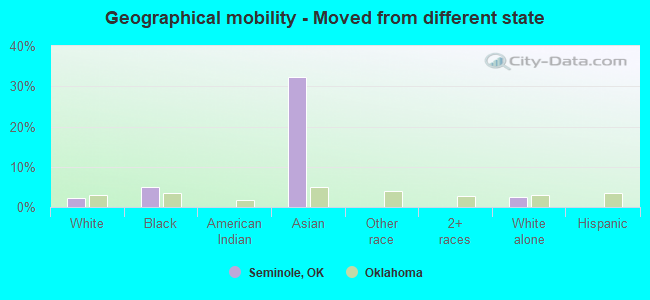
- Moved from different state
- 942.3%White / Caucasian
- 174.9%Black or African American
- 1032.2%Asian
- 982.4%White alone, not Hispanic / Latino
-
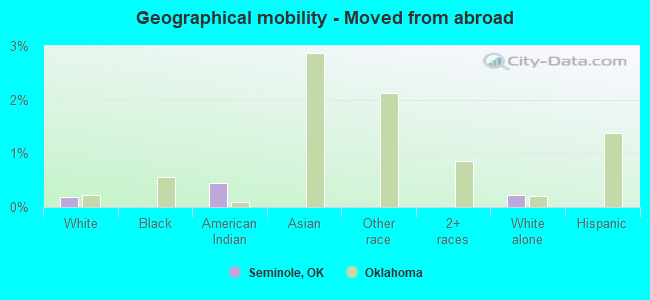
- Moved from abroad
- 70.2%White
- 80.4%American Indian / Alaska Native
- 90.2%White alone, not Hispanic / Latino
Children Nativity (place of birth) in Seminole
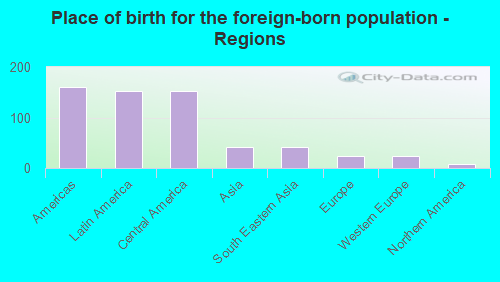
Place of birth for residents in Seminole
![Place of birth for the foreign-born population - Regions]()
- 161Americas
- 152Latin America
- 152Central America
- 42Asia
- 42South Eastern Asia
- 24Europe
- 24Western Europe
- 8Northern America
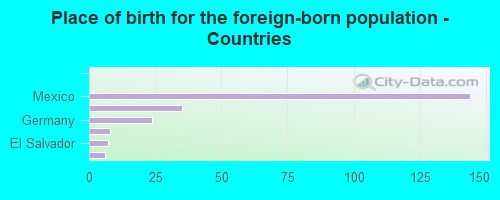
![Place of birth for the foreign-born population - Countries]()
- 144Mexico
- 35Philippines
- 24Germany
- 8Canada
- 7El Salvador
- 6Thailand
Grandparents responsible for own grandchildren in Seminole
Zip codes: 74868.