Races in Schererville, Indiana (IN) Detailed Stats
Data:
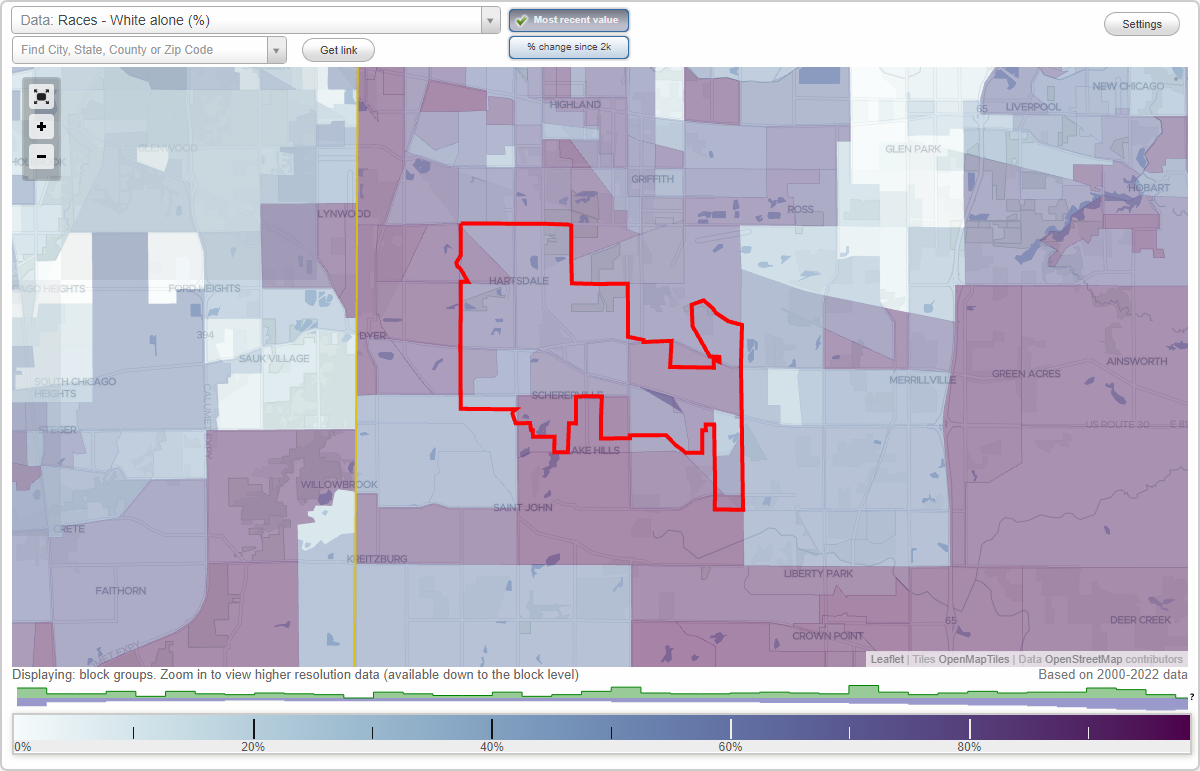
Races - White alone (%)
Races - White alone (% change since 2000)
Races - Black alone (%)
Races - Black alone (% change since 2000)
Races - American Indian alone (%)
Races - American Indian alone (% change since 2000)
Races - Asian alone (%)
Races - Asian alone (% change since 2000)
Races - Hispanic (%)
Races - Hispanic (% change since 2000)
Races - Native Hawaiian and Other Pacific Islander alone (%)
Races - Native Hawaiian and Other Pacific Islander alone (% change since 2000)
Races - Two or more races(%)
Races - Two or more races(% change since 2000)
Races - Other race alone (%)
Races - Other race alone (% change since 2000)
Racial diversity
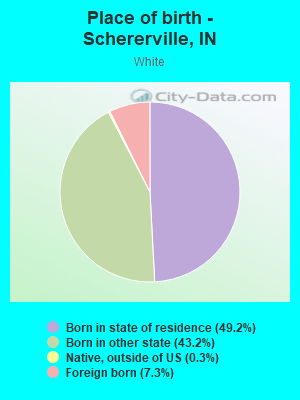
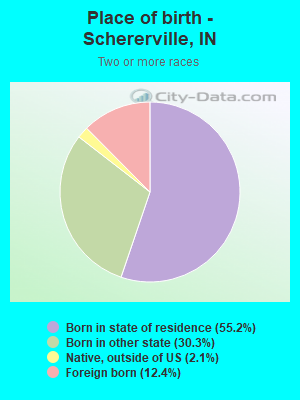
Place of birth - Born in state of residence (%)
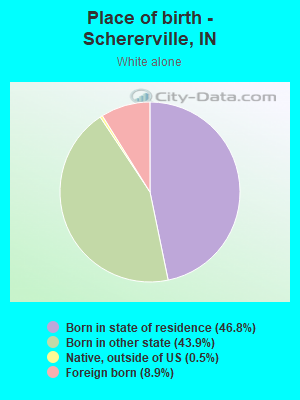
Place of birth - Born in state of residence (%) - White
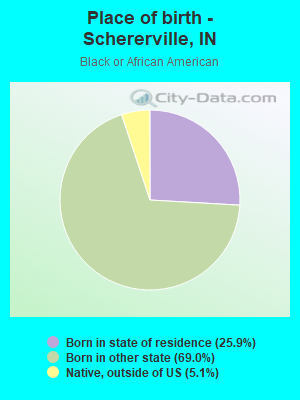
Place of birth - Born in state of residence (%) - Black or African American
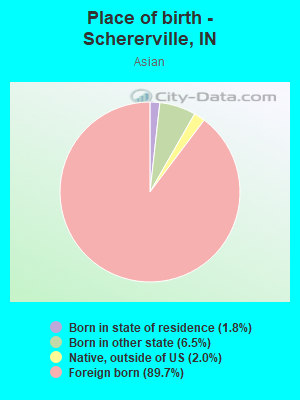
Place of birth - Born in state of residence (%) - Asian
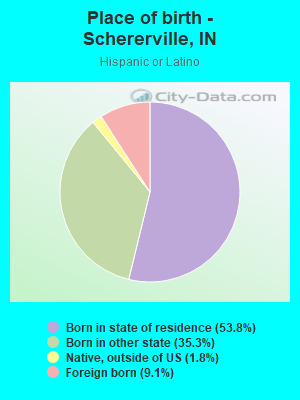
Place of birth - Born in state of residence (%) - Hispanic or Latino
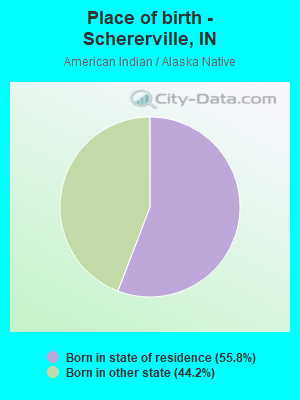
Place of birth - Born in state of residence (%) - American Indian and Alaska Native
Place of birth - Born in state of residence (%) - Multirace
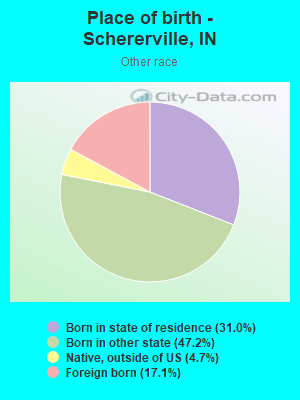
Place of birth - Born in state of residence (%) - Other Race
Place of birth - Born in other state (%)
Place of birth - Born in other state (%) - White
Place of birth - Born in other state (%) - Black or African American
Place of birth - Born in other state (%) - Asian
Place of birth - Born in other state (%) - Hispanic or Latino
Place of birth - Born in other state (%) - American Indian and Alaska Native
Place of birth - Born in other state (%) - Multirace
Place of birth - Born in other state (%) - Other Race
Place of birth - Native, outside of US (%)
Place of birth - Native, outside of US (%) - White
Place of birth - Native, outside of US (%) - Black or African American
Place of birth - Native, outside of US (%) - Asian
Place of birth - Native, outside of US (%) - Hispanic or Latino
Place of birth - Native, outside of US (%) - American Indian and Alaska Native
Place of birth - Native, outside of US (%) - Multirace
Place of birth - Native, outside of US (%) - Other Race
Place of birth - Foreign born (%)
Place of birth - Foreign born (%) - White
Place of birth - Foreign born (%) - Black or African American
Place of birth - Foreign born (%) - Asian
Place of birth - Foreign born (%) - Hispanic or Latino
Place of birth - Foreign born (%) - American Indian and Alaska Native
Place of birth - Foreign born (%) - Multirace
Place of birth - Foreign born (%) - Other Race
Residents speaking English at home (%)
Residents speaking English at home - Born in the United States (%)
Residents speaking English at home - Native, born elsewhere (%)
Residents speaking English at home - Foreign born (%)
Residents speaking Spanish at home (%)
Residents speaking Spanish at home - Born in the United States (%)
Residents speaking Spanish at home - Native, born elsewhere (%)
Residents speaking Spanish at home - Foreign born (%)
Residents speaking other language at home (%)
Residents speaking other language at home - Born in the United States (%)
Residents speaking other language at home - Native, born elsewhere (%)
Residents speaking other language at home - Foreign born (%)
Marital status - Never married (%)
Marital status - Now married (%)
Marital status - Separated (%)
Marital status - Widowed (%)
Marital status - Divorced (%)
Ancestries Reported - Arab (%)
Ancestries Reported - Czech (%)
Ancestries Reported - Danish (%)
Ancestries Reported - Dutch (%)
Ancestries Reported - English (%)
Ancestries Reported - French (%)
Ancestries Reported - French Canadian (%)
Ancestries Reported - German (%)
Ancestries Reported - Greek (%)
Ancestries Reported - Hungarian (%)
Ancestries Reported - Irish (%)
Ancestries Reported - Italian (%)
Ancestries Reported - Lithuanian (%)
Ancestries Reported - Norwegian (%)
Ancestries Reported - Polish (%)
Ancestries Reported - Portuguese (%)
Ancestries Reported - Russian (%)
Ancestries Reported - Scotch-Irish (%)
Ancestries Reported - Scottish (%)
Ancestries Reported - Slovak (%)
Ancestries Reported - Subsaharan African (%)
Ancestries Reported - Swedish (%)
Ancestries Reported - Swiss (%)
Ancestries Reported - Ukrainian (%)
Ancestries Reported - United States (%)
Ancestries Reported - Welsh (%)
Ancestries Reported - West Indian (%)
Ancestries Reported - Other (%)
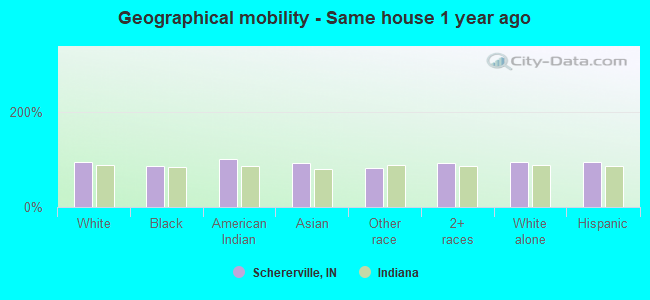
Geographical mobility - Same house 1 year ago (%)
Geographical mobility - Same house 1 year ago (%) - White
Geographical mobility - Same house 1 year ago (%) - Black or African American
Geographical mobility - Same house 1 year ago (%) - Asian
Geographical mobility - Same house 1 year ago (%) - Hispanic or Latino
Geographical mobility - Same house 1 year ago (%) - American Indian and Alaska Native
Geographical mobility - Same house 1 year ago (%) - Multirace
Geographical mobility - Same house 1 year ago (%) - Other Race
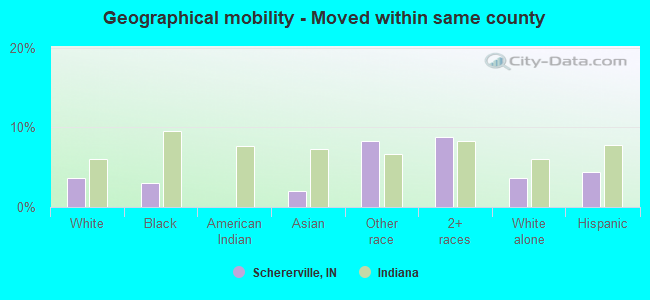
Geographical mobility - Moved within same county (%)
Geographical mobility - Moved within same county (%) - White
Geographical mobility - Moved within same county (%) - Black or African American
Geographical mobility - Moved within same county (%) - Asian
Geographical mobility - Moved within same county (%) - Hispanic or Latino
Geographical mobility - Moved within same county (%) - American Indian and Alaska Native
Geographical mobility - Moved within same county (%) - Multirace
Geographical mobility - Moved within same county (%) - Other Race
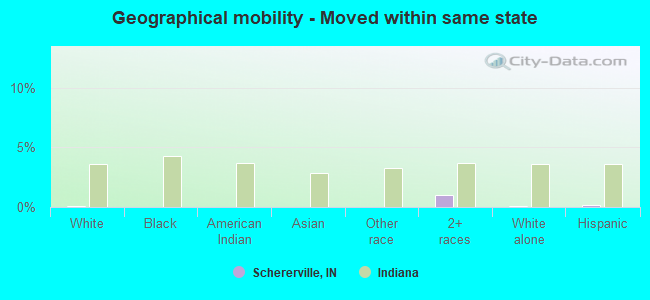
Geographical mobility - Moved from different county within same state (%)
Geographical mobility - Moved from different county within same state (%) - White
Geographical mobility - Moved from different county within same state (%) - Black or African American
Geographical mobility - Moved from different county within same state (%) - Asian
Geographical mobility - Moved from different county within same state (%) - Hispanic or Latino
Geographical mobility - Moved from different county within same state (%) - American Indian and Alaska Native
Geographical mobility - Moved from different county within same state (%) - Multirace
Geographical mobility - Moved from different county within same state (%) - Other Race
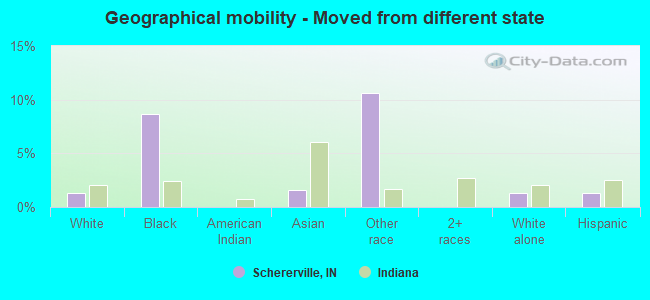
Geographical mobility - Moved from different state (%)
Geographical mobility - Moved from different state (%) - White
Geographical mobility - Moved from different state (%) - Black or African American
Geographical mobility - Moved from different state (%) - Asian
Geographical mobility - Moved from different state (%) - Hispanic or Latino
Geographical mobility - Moved from different state (%) - American Indian and Alaska Native
Geographical mobility - Moved from different state (%) - Multirace
Geographical mobility - Moved from different state (%) - Other Race
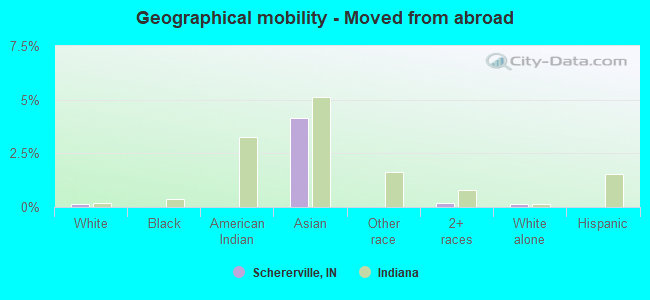
Geographical mobility - Moved from abroad (%)
Geographical mobility - Moved from abroad (%) - White
Geographical mobility - Moved from abroad (%) - Black or African American
Geographical mobility - Moved from abroad (%) - Asian
Geographical mobility - Moved from abroad (%) - Hispanic or Latino
Geographical mobility - Moved from abroad (%) - American Indian and Alaska Native
Geographical mobility - Moved from abroad (%) - Multirace
Geographical mobility - Moved from abroad (%) - Other Race
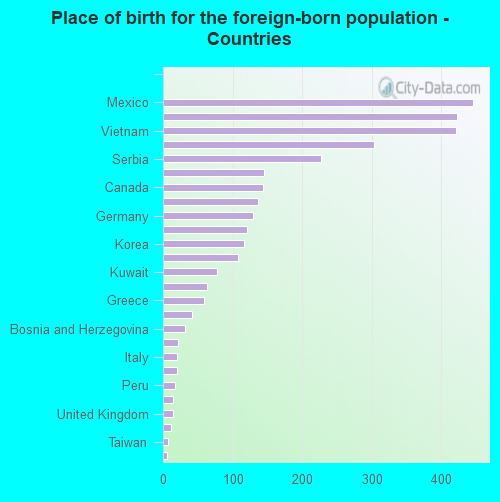
Place of birth for the foreign-born population - Ireland (%)
Place of birth for the foreign-born population - Denmark (%)
Place of birth for the foreign-born population - Norway (%)
Place of birth for the foreign-born population - Sweden (%)
Place of birth for the foreign-born population - United Kingdom (%)
Place of birth for the foreign-born population - England (%)
Place of birth for the foreign-born population - Scotland (%)
Place of birth for the foreign-born population - Other Northern Europe (%)
Place of birth for the foreign-born population - Austria (%)
Place of birth for the foreign-born population - Belgium (%)
Place of birth for the foreign-born population - France (%)
Place of birth for the foreign-born population - Germany (%)
Place of birth for the foreign-born population - Netherlands (%)
Place of birth for the foreign-born population - Switzerland (%)
Place of birth for the foreign-born population - Other Western Europe (%)
Place of birth for the foreign-born population - Greece (%)
Place of birth for the foreign-born population - Italy (%)
Place of birth for the foreign-born population - Portugal (%)
Place of birth for the foreign-born population - Spain (%)
Place of birth for the foreign-born population - Other Southern Europe (%)
Place of birth for the foreign-born population - Albania (%)
Place of birth for the foreign-born population - Belarus (%)
Place of birth for the foreign-born population - Bosnia and Herzegovina (%)
Place of birth for the foreign-born population - Bulgaria (%)
Place of birth for the foreign-born population - Croatia (%)
Place of birth for the foreign-born population - Czechoslovakia (%)
Place of birth for the foreign-born population - Hungary (%)
Place of birth for the foreign-born population - Latvia (%)
Place of birth for the foreign-born population - Lithuania (%)
Place of birth for the foreign-born population - North Macedonia (Macedonia) (%)
Place of birth for the foreign-born population - Moldova (%)
Place of birth for the foreign-born population - Poland (%)
Place of birth for the foreign-born population - Romania (%)
Place of birth for the foreign-born population - Russia (%)
Place of birth for the foreign-born population - Serbia (%)
Place of birth for the foreign-born population - Ukraine (%)
Place of birth for the foreign-born population - Other Eastern Europe (%)
Place of birth for the foreign-born population - China (%)
Place of birth for the foreign-born population - Hong Kong (%)
Place of birth for the foreign-born population - Taiwan (%)
Place of birth for the foreign-born population - Japan (%)
Place of birth for the foreign-born population - Korea (%)
Place of birth for the foreign-born population - Other Eastern Asia (%)
Place of birth for the foreign-born population - Afghanistan (%)
Place of birth for the foreign-born population - Bangladesh (%)
Place of birth for the foreign-born population - India (%)
Place of birth for the foreign-born population - Iran (%)
Place of birth for the foreign-born population - Kazakhstan (%)
Place of birth for the foreign-born population - Nepal (%)
Place of birth for the foreign-born population - Pakistan (%)
Place of birth for the foreign-born population - Sri Lanka (%)
Place of birth for the foreign-born population - Uzbekistan (%)
Place of birth for the foreign-born population - Other South Central Asia (%)
Place of birth for the foreign-born population - Burma (%)
Place of birth for the foreign-born population - Cambodia (%)
Place of birth for the foreign-born population - Indonesia (%)
Place of birth for the foreign-born population - Laos (%)
Place of birth for the foreign-born population - Malaysia (%)
Place of birth for the foreign-born population - Philippines (%)
Place of birth for the foreign-born population - Singapore (%)
Place of birth for the foreign-born population - Thailand (%)
Place of birth for the foreign-born population - Vietnam (%)
Place of birth for the foreign-born population - Other South Eastern Asia (%)
Place of birth for the foreign-born population - Armenia (%)
Place of birth for the foreign-born population - Iraq (%)
Place of birth for the foreign-born population - Israel (%)
Place of birth for the foreign-born population - Jordan (%)
Place of birth for the foreign-born population - Kuwait (%)
Place of birth for the foreign-born population - Lebanon (%)
Place of birth for the foreign-born population - Saudi Arabia (%)
Place of birth for the foreign-born population - Syria (%)
Place of birth for the foreign-born population - Turkey (%)
Place of birth for the foreign-born population - Yemen (%)
Place of birth for the foreign-born population - Other Western Asia (%)
Place of birth for the foreign-born population - Eritrea (%)
Place of birth for the foreign-born population - Ethiopia (%)
Place of birth for the foreign-born population - Kenya (%)
Place of birth for the foreign-born population - Somalia (%)
Place of birth for the foreign-born population - Uganda (%)
Place of birth for the foreign-born population - Zimbabwe (%)
Place of birth for the foreign-born population - Other Eastern Africa (%)
Place of birth for the foreign-born population - Cameroon (%)
Place of birth for the foreign-born population - Congo (%)
Place of birth for the foreign-born population - Democratic Republic of Congo (Zaire) (%)
Place of birth for the foreign-born population - Other Middle Africa (%)
Place of birth for the foreign-born population - Egypt (%)
Place of birth for the foreign-born population - Morocco (%)
Place of birth for the foreign-born population - Sudan (%)
Place of birth for the foreign-born population - Other Northern Africa (%)
Place of birth for the foreign-born population - South Africa (%)
Place of birth for the foreign-born population - Other Southern Africa (%)
Place of birth for the foreign-born population - Cabo Verde (%)
Place of birth for the foreign-born population - Ghana (%)
Place of birth for the foreign-born population - Liberia (%)
Place of birth for the foreign-born population - Nigeria (%)
Place of birth for the foreign-born population - Senegal (%)
Place of birth for the foreign-born population - Sierra Leone (%)
Place of birth for the foreign-born population - Other Western Africa (%)
Place of birth for the foreign-born population - Australia (%)
Place of birth for the foreign-born population - New Zealand (%)
Place of birth for the foreign-born population - Fiji (%)
Place of birth for the foreign-born population - Micronesia (%)
Place of birth for the foreign-born population - Bahamas (%)
Place of birth for the foreign-born population - Barbados (%)
Place of birth for the foreign-born population - Cuba (%)
Place of birth for the foreign-born population - Dominica (%)
Place of birth for the foreign-born population - Dominican Republic (%)
Place of birth for the foreign-born population - Grenada (%)
Place of birth for the foreign-born population - Haiti (%)
Place of birth for the foreign-born population - Jamaica (%)
Place of birth for the foreign-born population - St. Vincent and the Grenadines (%)
Place of birth for the foreign-born population - Trinidad and Tobago (%)
Place of birth for the foreign-born population - West Indies (%)
Place of birth for the foreign-born population - Other Caribbean (%)
Place of birth for the foreign-born population - Belize (%)
Place of birth for the foreign-born population - Costa Rica (%)
Place of birth for the foreign-born population - El Salvador (%)
Place of birth for the foreign-born population - Guatemala (%)
Place of birth for the foreign-born population - Honduras (%)
Place of birth for the foreign-born population - Mexico (%)
Place of birth for the foreign-born population - Nicaragua (%)
Place of birth for the foreign-born population - Panama (%)
Place of birth for the foreign-born population - Other Central America (%)
Place of birth for the foreign-born population - Argentina (%)
Place of birth for the foreign-born population - Bolivia (%)
Place of birth for the foreign-born population - Brazil (%)
Place of birth for the foreign-born population - Chile (%)
Place of birth for the foreign-born population - Colombia (%)
Place of birth for the foreign-born population - Ecuador (%)
Place of birth for the foreign-born population - Guyana (%)
Place of birth for the foreign-born population - Peru (%)
Place of birth for the foreign-born population - Uruguay (%)
Place of birth for the foreign-born population - Venezuela (%)
Place of birth for the foreign-born population - Other South America (%)
Place of birth for the foreign-born population - Canada (%)
Place of birth for the foreign-born population - Other Northern America (%)
Place of birth for the foreign-born population - Other (%)
Latest news about races in Schererville, IN collected exclusively by city-data.com from local newspapers, TV, and radio stations
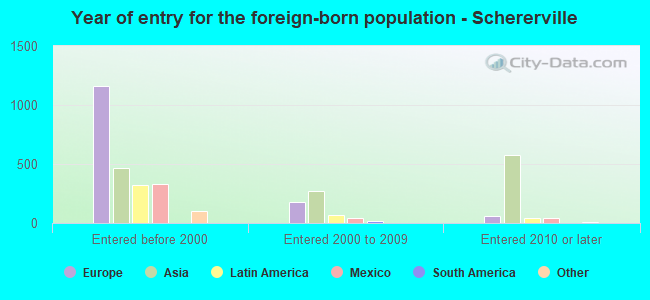
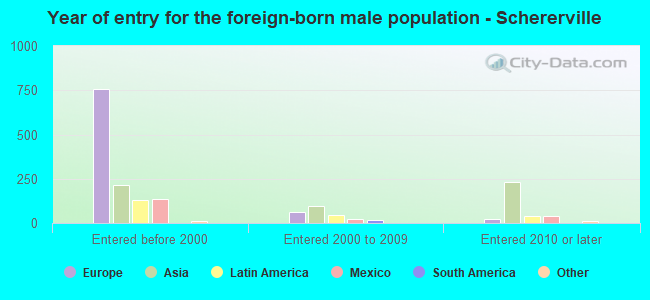
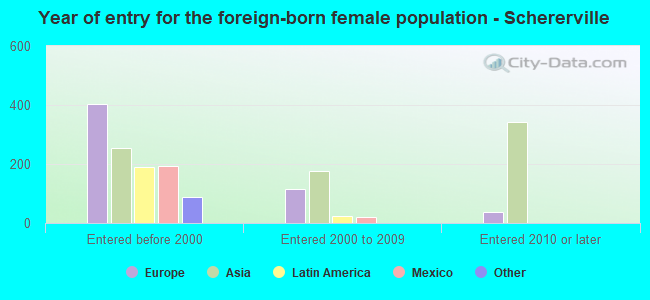
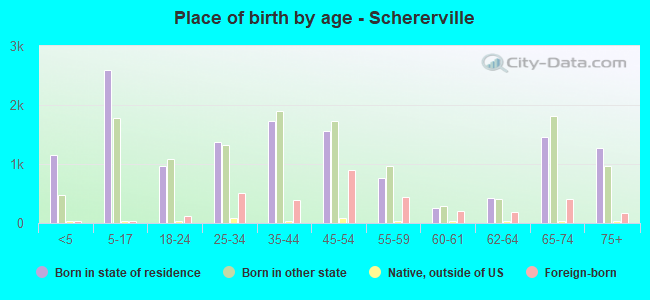
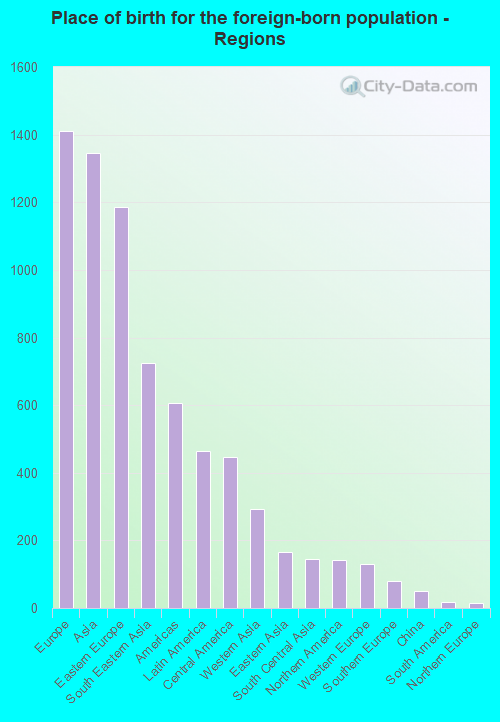
According to 2022 data, the most numerous races in Schererville, IN are White alone (20,327 residents), Black alone (2,298 residents), and Hispanic (4,690 residents). 80.8% of Schererville residents speak English at home. 11.4% of Schererville, IN residents are foreign-born (4.4% born in Europe, 4.1% born in Asia, 1.4% born in Latin America), which is 47.2% greater than the foreign-born rate of 6.0% across the entire state of Indiana.
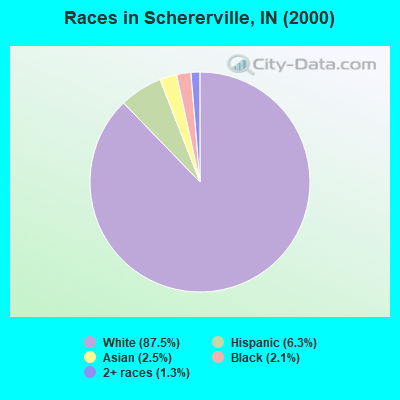
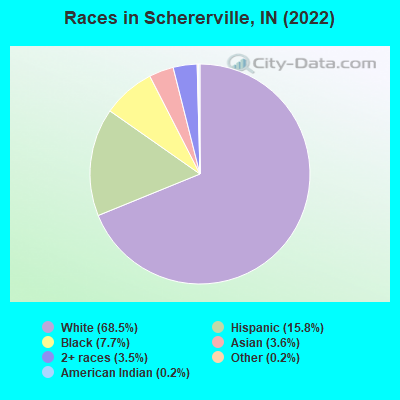
Race distribution in Schererville
2000 2022
5,219,373 85.8% White alone 505,462 8.3% Black alone 214,536 3.5% Hispanic 61,115 1.0% Two or more races 58,424 1.0% Asian alone 13,654 0.2% American Indian alone 6,348 0.1% Other race alone 1,573 0.03% Native Hawaiian and Other
5,192,455 76.0% White alone 628,054 9.2% Black alone 534,528 7.8% Hispanic 263,242 3.9% Two or more races 172,880 2.5% Asian alone 33,467 0.5% Other race alone 5,866 0.09% American Indian alone 2,545 0.04% Native Hawaiian and Other
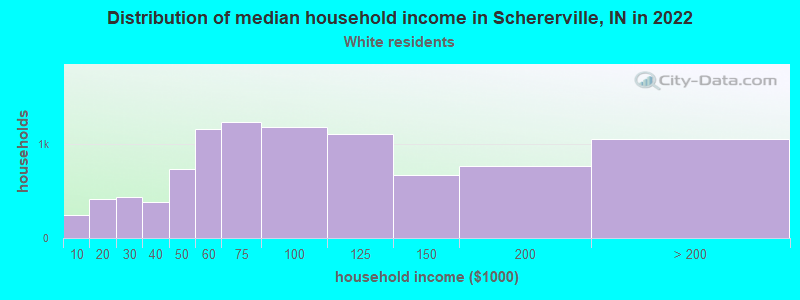
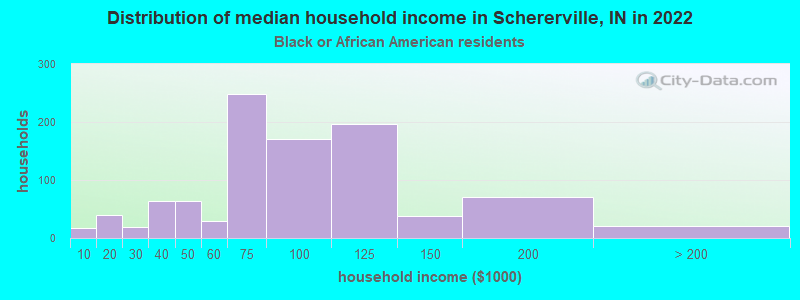
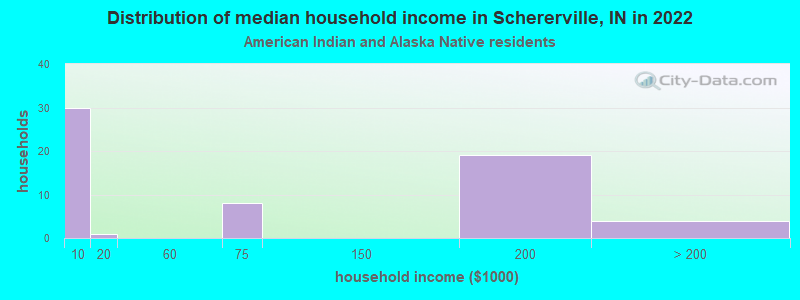
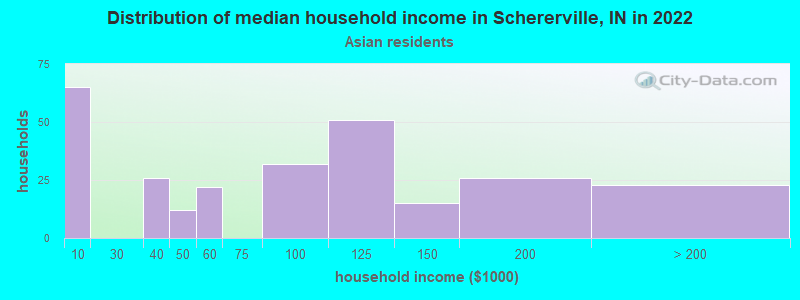
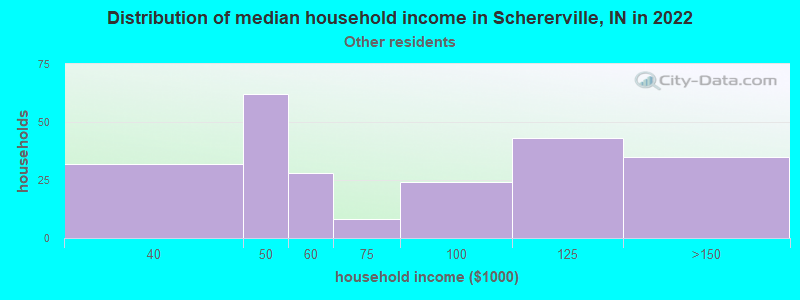
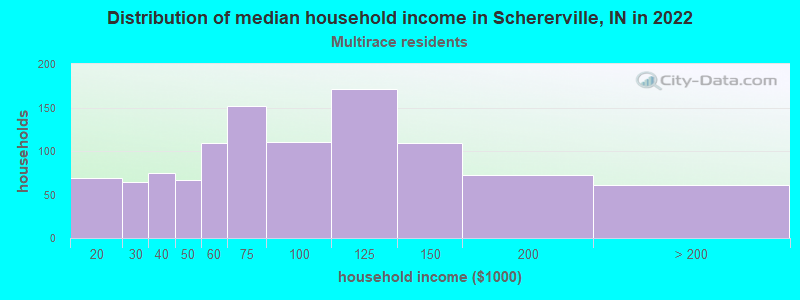
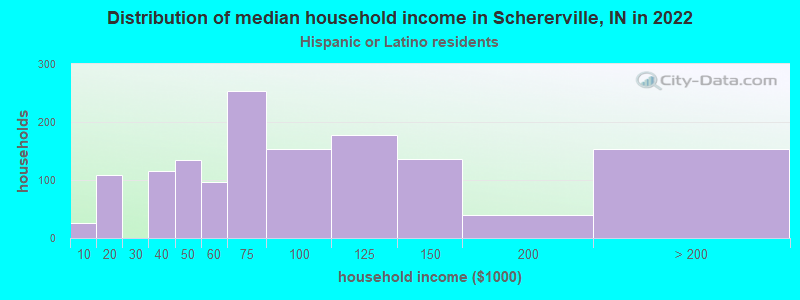
Income and house value in Schererville Median household income in 2022 $78,195 White non-Hispanic householders$80,933 Black householders$87,706 Asian householders$82,674 Some other race householders$98,924 Two or more races householders$85,342 Hispanic or Latino race householdersMedian 2022 house value $326,973 White Non-Hispanic householders$395,249 Black or African American householders $456,844 Asian householders$376,666 Some other race householders$333,446 Two or more races householders$326,556 Hispanic or Latino householders
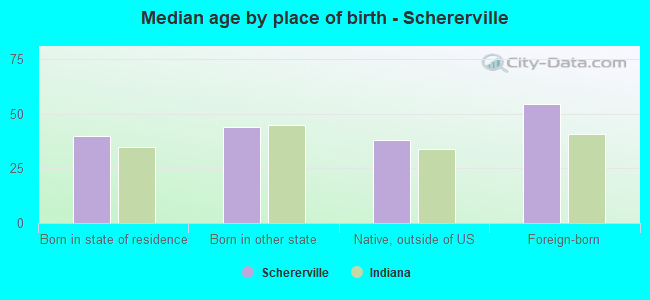
Median age by race in Schererville
47.2 Median age for White residents45.8 48.8 31.8 Median age for Black or African American residents31.6 31.0 36.1 Median age for American Indian / Alaska Native residents-531,041,069.2 27.9 45.9 Median age for Asian residents32.7 47.2 -664,335,663.7 Median age for Native Hawaiian / Pacific Islander residents-644,025,156.6 -664,437,011.6 56.7 Median age for Other race residents34.1 62.9 28.9 Median age for Two or more races residents27.7 28.1 48.7 Median age for White alone residents48.7 50.1 28.8 Median age for Hispanic or Latino residents27.4 29.3
Owner/renter occupied households by race in Schererville
House owners and renters - White residents 8,000 85.9% Owner occupied1,309 14.1% Renter occupiedHouse owners and renters - Black or African American residents 335 34.1% Owner occupied649 65.9% Renter occupiedHouse owners and renters - American Indian / Alaska Native residents 41 92.4% Owner occupied3 7.6% Renter occupiedHouse owners and renters - Asian residents 199 71.3% Owner occupied80 28.7% Renter occupiedHouse owners and renters - Other race residents 121 53.9% Owner occupied103 46.1% Renter occupiedHouse owners and renters - Two or more races residents 859 74.3% Owner occupied297 25.7% Renter occupiedHouse owners and renters - White alone residents 7,846 86.1% Owner occupied1,266 13.9% Renter occupiedHouse owners and renters - Hispanic or Latino residents 1,005 72.9% Owner occupied374 27.1% Renter occupied
Language usage in Schererville
English speakers - Total 80.8% of residents of Schererville speak English at home.
7.2% of residents speak Spanish at home 1,685 83.9% Speak English very well324 16.1% Speak English less than very well13.6% of residents speak other language at home 2,387 62.3% Speak English very well1,442 37.7% Speak English less than very well
English speakers - Born in the United States 89.5% of residents of Schererville speak English at home.
7.2% of residents speak Spanish at home 837 94.2% Speak English very well52 5.8% Speak English less than very well3.7% of residents speak other language at home 433 95.8% Speak English very well19 4.2% Speak English less than very well
English speakers - Native, born elsewhere 49.1% of residents of Schererville speak English at home.
43.1% of residents speak Spanish at home 82 82.0% Speak English very well18 18.0% Speak English less than very well8.2% of residents speak other language at home 19 100.0% Speak English very well
English speakers - Foreign-born 16.5% of residents of Schererville speak English at home.
13.6% of residents speak Spanish at home 215 48.6% Speak English very well227 51.4% Speak English less than very well74.9% of residents speak other language at home 1,194 49.0% Speak English very well1,244 51.0% Speak English less than very well
White (Caucasian) - Speak only English Native:
94.2% (17,731)Foreign-born:
16.1% (250)
White (Caucasian) - Speak another language Native:
5.8% (1,096)Foreign-born:
84.4% (1,308)
Asian - Speak only English Native:
58.8% (55)Foreign-born:
23.0% (217)
Asian - Speak another language Native:
40.4% (37)Foreign-born:
76.5% (722)
Other race - Speak another language Native:
38.5% (201)Foreign-born:
97.6% (106)
Two or more races - Speak another language Native:
48.6% (1,573)Foreign-born:
100.0% (508)
White alone - Speak only English Native:
93.7% (16,815)Foreign-born:
12.9% (233)
White alone - Speak another language Native:
7.0% (1,263)Foreign-born:
91.9% (1,653)
Hispanic or Latino - Speak only English Native:
64.7% (2,447)Foreign-born:
2.6% (11)
Hispanic or Latino - Speak another language Native:
34.7% (1,314)Foreign-born:
97.3% (421)
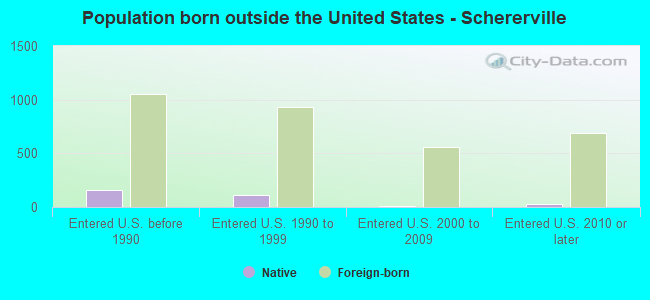
Foreign-born residents in Schererville 3,371 residents are foreign born (4.4% Europe , 4.1% Asia , 1.4% Latin America ).
This city:
11.4%Indiana:
5.6%
Marital status for residents in Schererville Marital status - White (Caucasian) population 15 years and over
Males 31.9% Never married53.0% Now married1.8% Separated2.2% Widowed11.1% DivorcedFemales 21.6% Never married52.4% Now married1.2% Separated12.2% Widowed12.4% DivorcedWomen who gave birth in the past 12 months Now married:
88.1% (90)Unmarried:
11.9% (12)
Women who did not give birth in the past 12 months Now married:
53.3% (2,281)Unmarried:
46.7% (1,997)
Marital status - Black or African American population 15 years and over
Males 57.9% Never married35.4% Now married0.0% Separated2.8% Widowed3.9% DivorcedFemales 42.5% Never married28.1% Now married6.7% Separated2.3% Widowed20.4% DivorcedWomen who gave birth in the past 12 months Now married:
0.0% (0)Unmarried:
100.0% (96)
Women who did not give birth in the past 12 months Now married:
38.1% (211)Unmarried:
61.9% (343)
Marital status - American Indian / Alaska Native population 15 years and over
Males 0.0% Never married100.0% Now married0.0% Separated0.0% Widowed0.0% DivorcedFemales 25.0% Never married25.0% Now married0.0% Separated0.0% Widowed50.0% DivorcedWomen who did not give birth in the past 12 months Now married:
38.5% (24)Unmarried:
61.5% (38)
Marital status - Asian population 15 years and over
Males 52.8% Never married45.6% Now married0.0% Separated0.0% Widowed1.6% DivorcedFemales 40.7% Never married47.5% Now married0.0% Separated3.6% Widowed8.1% DivorcedWomen who did not give birth in the past 12 months Now married:
29.6% (101)Unmarried:
70.4% (241)
Marital status - Other race population 15 years and over
Males 49.8% Never married37.7% Now married0.0% Separated0.0% Widowed12.5% DivorcedFemales 7.2% Never married62.8% Now married0.0% Separated13.4% Widowed16.6% DivorcedWomen who did not give birth in the past 12 months Now married:
34.0% (33)Unmarried:
66.0% (63)
Marital status - Two or more races population 15 years and over
Males 52.0% Never married44.3% Now married0.0% Separated0.0% Widowed3.7% DivorcedFemales 55.3% Never married28.3% Now married0.0% Separated8.4% Widowed8.0% DivorcedWomen who gave birth in the past 12 months Now married:
0.0% (0)Unmarried:
100.0% (97)
Women who did not give birth in the past 12 months Now married:
24.0% (240)Unmarried:
76.0% (761)
Marital status - White alone, not Hispanic / Latino population 15 years and over
Males 30.4% Never married54.6% Now married1.6% Separated2.3% Widowed11.0% DivorcedFemales 20.9% Never married52.3% Now married1.3% Separated12.5% Widowed12.9% DivorcedWomen who gave birth in the past 12 months Now married:
100.0% (73)Unmarried:
0.0% (0)
Women who did not give birth in the past 12 months Now married:
53.0% (2,124)Unmarried:
47.0% (1,881)
Marital status - Hispanic or Latino population 15 years and over
Males 51.5% Never married37.3% Now married1.4% Separated0.5% Widowed9.4% DivorcedFemales 36.8% Never married45.4% Now married0.0% Separated10.0% Widowed7.8% DivorcedWomen who gave birth in the past 12 months Now married:
21.4% (22)Unmarried:
78.6% (81)
Women who did not give birth in the past 12 months Now married:
41.1% (378)Unmarried:
58.9% (541)
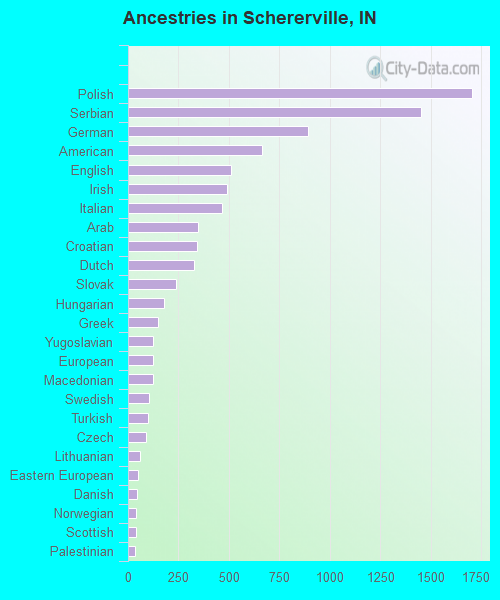
Ancestries in Schererville
1,703 12.4% Polish1,451 10.6% Serbian890 6.5% German662 4.8% American509 3.7% English488 3.6% Irish467 3.4% Italian345 2.5% Arab341 2.5% Croatian329 2.4% Dutch237 1.7% Slovak180 1.3% Hungarian147 1.1% Greek126 0.9% Yugoslavian123 0.9% European122 0.9% Macedonian105 0.8% Swedish97 0.7% Turkish87 0.6% Czech57 0.4% Lithuanian48 0.4% Eastern European44 0.3% Danish41 0.3% Norwegian40 0.3% Scottish36 0.3% Palestinian32 0.2% Jordanian32 0.2% French29 0.2% Ukrainian23 0.2% Scandinavian22 0.2% Nigerian11 0.08% British10 0.07% Romanian10 0.07% Russian9 0.07% African7 0.05% Czechoslovakian6 0.04% French Canadian6 0.04% Welsh5 0.04% Bulgarian3 0.02% Assyrian2 0.01% Canadian
Geographical mobility in Schererville Same house 1 year ago 20,217 95.2% White (Caucasian)1,936 85.6% Black or African American102 100.0% American Indian / Alaska Native969 92.4% Asian508 81.7% Other race3,716 92.1% Two or more races19,333 95.4% White alone, not Hispanic / Latino4,372 95.3% Hispanic or LatinoMoved within same county 784 3.7% White / Caucasian69 3.1% Black or African American21 2.0% Asian52 8.3% Other race355 8.8% Two or more races731 3.6% White alone, not Hispanic / Latino202 4.4% Hispanic or LatinoMoved within same state 13 0.1% White / Caucasian1 0.0% Black or African American41 1.0% Two or more races13 0.1% White alone, not Hispanic / Latino9 0.2% Hispanic or LatinoMoved from different state 285 1.3% White / Caucasian196 8.7% Black or African American16 1.5% Asian66 10.6% Other race257 1.3% White alone, not Hispanic / Latino60 1.3% Hispanic or LatinoMoved from abroad 28 0.1% White43 4.1% Asian8 0.2% Two or more races28 0.1% White alone, not Hispanic / Latino
Children Nativity (place of birth) in Schererville
Children under 6 years - Living with two parents Both parents native 1,032 100.0% NativeBoth parents foreign-born 76 87.4% Native11 12.6% Foreign-bornOne native, one foreign-born parent 175 100.0% NativeChildren under 6 years - Living with one parent Native parent 600 100.0% NativeForeign-born parent 25 100.0% NativeChildren 6 to 17 years - Living with two parents Both parents native 2,386 99.3% Native18 0.7% Foreign-bornBoth parents foreign-born 300 91.1% Native29 8.9% Foreign-bornOne native, one foreign-born parent 425 100.0% NativeChildren 6 to 17 years - Living with one parent Native parent 715 100.0% NativeForeign-born parent 62 47.4% Native68 52.6% Foreign-born
Grandparents responsible for own grandchildren in Schererville
Grandparents (30 to 59 years) White / Caucasian 103 40.6% Responsible for grandchildren151 59.4% Not responsible for grandchildrenBlack or African American 8 100.0% Responsible for grandchildrenTwo or more races 201 100.0% Responsible for grandchildrenWhite alone, not Hispanic / Latino 106 39.9% Responsible for grandchildren159 60.1% Not responsible for grandchildrenHispanic or Latino 153 100.0% Responsible for grandchildrenGrandparents (60 years and over) White / Caucasian 16 9.6% Responsible for grandchildren151 90.4% Not responsible for grandchildrenBlack or African American 4 26.2% Responsible for grandchildren11 73.8% Not responsible for grandchildrenTwo or more races 18 18.3% Responsible for grandchildren80 81.7% Not responsible for grandchildrenWhite alone, not Hispanic / Latino 17 14.4% Responsible for grandchildren102 85.6% Not responsible for grandchildrenHispanic or Latino 23 16.6% Responsible for grandchildren115 83.4% Not responsible for grandchildren